update Aug. 23, 2000
This research was sponsored by the National Science Foundation
Division of Atmospheric Sciences
under grant ATM97-14177. Any opinions, findings, and conclusions
or recommendations expressed in this material are those of the authors
and do not necessarily reflect the views of the National Science
Foundation.
Discussed here are preliminary results from measurements obtained on the
January 13, 1998, Lake-ICE research flight. Also available are
photos
taken from the Electra aircraft.
This case exhibited typical low altitude features. After a frontal
passage, the cold, dry and stable air mass moved across Lake Michigan
for several days. Surface winds were northwesterly at ~11m/s. With
lake surface temperatures of +3C and air temperatures of -20C, the
surface layer was absolutely unstable and quite turbulent. Heat and
moisture were rapidly mixed into the surface layer, and resulted a
steady deepening and evolution of the boundary layer (BL) downwind.
The BL was capped by an inversion layer that sloped to higher altitudes
downwind. Trails of steam fog were produced near the upwind shore
line, and were continually mixing, evaporating and reforming downwind.
By about 100km downwind, this strong shallow convection was
sufficiently modified that a cloud base was discernible, and
two-dimensional cloud-size mesoscale structures were becoming organized
and detectable on the Electra's Eldora radar.
Aircraft Measurements
The Electra aircraft made a series of low level upwind/downwind passes
at ~600m above the lake surface, approximately aligned with the wind.
This plot shows data taken during one upwind pass.
The wind is blowing from left to right, and the Electra flew from right
to left. The TIME axis was transformed from aircraft time to
Parcel time, as estimated from the aircraft speed and the wind:
parcel time = aircraft time x (TAS + WS) / WS
Parcel time estimates the wind-borne travel time of an air parcel from
the upwind boundary to the point where the aircraft measured its properties.
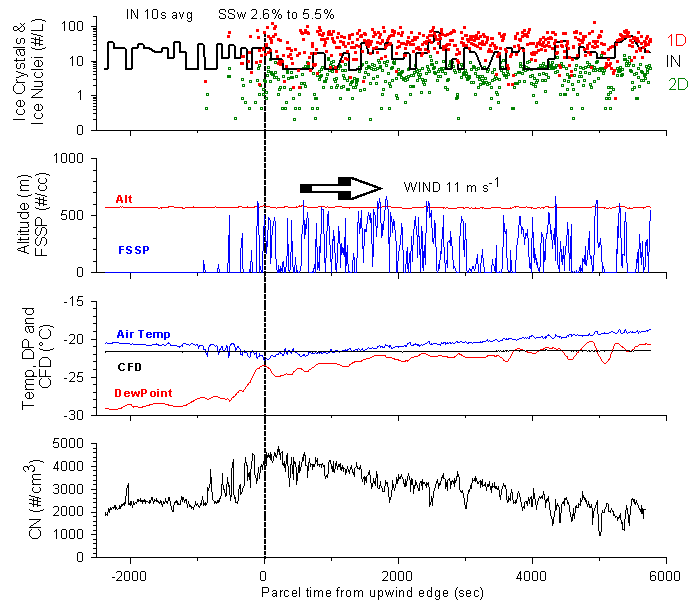
|
The aircraft was within the boundary layer (BL) until it crossed the top
of the sloping BL and entered the overlying air mass at Parcel time
zero (vertical dashed line).
(top two panels)
Ice concentrations were ~5-10 per liter from the 2D-C probe (red) and
10-100 per liter from the 1D (260x) probe (green). Ice developed
rapidly near the upwind edge, at the same location where the liquid
cloud formed. Water and ice cloud formed at lower altitudes and mixed
up to this altitude. The ice nuclei concentration was ~10-20 per liter
with the CFD sampling at -22C and 2.6 to 5.5% super-saturation.
Small regions of cloud water (FSSP) and ice particles (2D & 1D) were associated with narrow updrafts ~800m in size in the well-mixed BL.
(next)
Temperature and dew point traces show that the lake was a strong source
of heat and water vapor; both increase downwind. The thin black line
shows the temperature of ice nuclei measurements (-22C).
(bottom)
The CN trace shows a steady decrease of aerosol concentration downwind
(due to scavenging and dilution), cleaner air above the BL (parcel time < 0),
and evidence of fine scale structure and rapid mixing within and near
the top of the capping inversion.
|
The Electra continued its upwind/downwind transects over nearly the same
region during the next four hours. The same cloud and thermodynamic
features were evident during each pass. All of the features seemed to
stay intact, as if they were defined by longitude positions over the
lake:
- the air got warmer and wetter as it advected across the lake
- steady decrease of aerosol concentration downwind
- water cloud was very complicated (fine scale structure)
- ice formed at the same time as the water cloud
- typical ice concentrations ~5-10 per liter
The lake-effect structure was a fairly "steady" phenomenon, the proof of
which is that the air flowed through the aircraft sampling region in
about 1.8 hours, but the thermodynamic, aerosol and cloud patterns
stayed the same. The following hour-long plots of aircraft data show
these features.
14:00 - 15:00 UTC
Electra data upwind/downwind cycles. CN removal, BL warmer and wetter
downwind (97k gif).
15:00 - 16:00 UTC
The next hour showed the same patterns (100k gif).
Back to Dave's Lake-ICE page