
 SHEBA ISFF Flux-PAM
Project Report
SHEBA ISFF Flux-PAM
Project Report
SHEBA ISFF Flux-PAM
Project Report
SHEBA ISFF Flux-PAM
Project Report
Kipp and Zonen model CM21 pyranometers and Eppley model PIR pyrgeometers were used to monitor the incoming and outgoing, short-wave and long-wave radiation.
|
| J. Militzer |
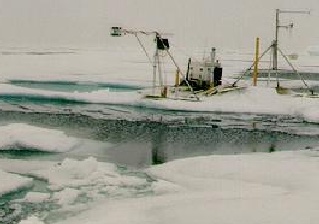
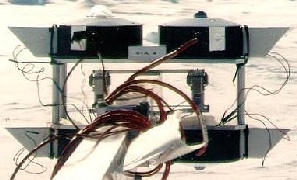
Both types of radiometer were mounted in circular PVC ventilator housings fitted with Eppley radiation shields. Ventilation of the radiometers was provided by circulating air into the plenum of the housing and venting through the annular slot surrounding the radiometer dome. The four housings were attached to an adjustable platform fitted with an electronic electrolytic level to allow the horizontal aspect of all four, two upward- and two downward-viewing, radiometers to be established and monitored. The platform was affixed to the end of a four meter boom canter-levered out from the flux station tripod, two meters above the surface.
The raw voltage data from the radiometer array corresponding to:
was input to a Campbell CR10 data logger mounted on the flux station tripod. Calibration factors and coefficients loaded in the memory of the data logger enabled these voltages to be converted to engineering units. This data was sent in serial form to the Eve computer at a rate of 1 Hz. The values of four components of the surface radiation budget, Rsw.in, Rsw.out, Rlw.in and Rlw.out can be calculated from the measured parameters.
For the pyranometer, the calibrated response of the thermopile directly yields the measured visible radiation flux.
Rsw = cswVsw
where Rsw is the short-wave radiation flux, csw is a calibration constant and Vsw is the voltage output of the radiometer.
For the pyrgeometer, the situation is more complex because of the sensitivity of the long-wave radiation sensor to thermal effects beyond the simple response of the thermopile. The thermopile voltage Vlw responds to the long-wave radiation flux absorbed by the thermopile,
Rpile = clwVlw
where Rpile is the signal associated with the portion of the long-wave radiation flux absorbed by the thermopile and clw is a calibration constant
However, three corrections are required to this simple relation in order to obtain the long-wave radiation flux. The pyrgeometer thermopile response under-estimates the intercepted infrared radiation because the top surface of the pyrgeometer thermopile re-emits infrared radiation proportional to its absolute temperature. Hence an additional term Cc, dependent upon the temperature of the top surface of the thermopile, must be added to the output of the thermopile in order to obtain the true estimate of energy arriving at the pyrgeometer. For each pyrgeometer the temperature of the case housing the thermopile Tc is measured and Cc is calculated from the Stefan-Boltzman relation,
Cc = sigma Tc4
where sigma is the Stefan-Boltzman coefficient, 5.67 x 10⁻⁸, and the temperature Tc is in °K.
The pyrgeometer thermopile views the environment through the pyrgeometer dome. Because the dome is not completely transparent in the long-wave spectral region, the dome's own temperature contributes to the radiation received by the thermopile. A correction Cdc is calculated using the relationship,
Cdc = sigma Adc (Td4- Tc4)
where the value of the coefficient Adc is subject to uncertainty and values from 1.1 to 3.0 have been suggested. Here the dome temperature Td, again in °K, is determined from the average resistance of the three dome thermistors. This contribution, Cdc, must be subtracted from the thermopile output.
Finally, The pyrgeometer has a partial sensitivity to short-wave radiation due to the incomplete optical cut-off of the vacuum-deposited interference filter below 3 µm. This requires a correction.
Cv = Av Rsw
This correction, too, must be subtracted from the pyrgeometer output. Again, there is uncertainty as to the best value for the coefficient Av.
The correction terms applied to the pyrgeometer response yield the true value of the infrared radiation flux.
Rlw = Rpile + Cc - Cdc - Cv
Because all the individual sensor parameters involved are measured and archived, the four radiation components are calculated afresh each time that they are required. This procedure allows the values for the coefficients involved to be set according to preference during post-deployment analysis.
Both pre- and post- deployment calibrations of the radiometers were carried out for all radiometers. To compensate for the variation of radiometer response throughout the duration of the program, simple linear interpolations between the pre- and the post calibration factors were used for the radiometers throughout the program. The differences between the pre-project and the post-project thermopile response were less than 1% for the pyranometers, but for the pyrgeometers the differences ranged from 0.091% to 5.54% with a mean of 2.19%. The changes in the thermistor calibrations were negligible. The internal precision of the group of eight pyrgeometers is estimated to be within 3 W/m², and the overall accuracy to be 5 W/m².
The pyranometer calibration was undertaken at the NOAA/CMDL Solar Radiation Facility (SRF), in Boulder, Colorado, under the supervision of Donald Nelson. The SHEBA pyranometers, together with SRF calibration-standard pyranometers, were exposed to daylight on the roof of the SRF building, for a period of two months, both before and after the SHEBA field program.
The pyrgeometer calibration involved both the black body radiation response of the sensor thermopile and the temperature calibration of the sensor thermistors. The black body radiative response for the pyrgeometers was carried out under the supervision of Ellsworth Dutton of ERL/NOAA in Boulder, Colorado following the procedure described in Dutton, 1993, (Dutton, E.G. 1993, "An extended comparison between LOWTRAN7 computed and observed broadband thermal irradiances: global extremes and surface conditions", J. Atmos. Ocean. Technol., 10, 326-336). This procedure provided both the calibration constant for the the thermopile, clw, and the coefficient used to make the dome-case temperature-difference correction, Adc.
The temperature calibration of the pyrgeometer thermistors was undertaken in the NCAR Sensor Calibration Laboratory. The pyrgeometers were calibrated in an associated Environmental Systems, Model SD 308 temperature calibration chamber. For each pair of pyrgeometers, a previously-calibrated platinum resistance thermometer was used as a reference and was attached to the top of the pyrgeometers near the domes. The instruments were then surrounded with a thin layer of insulation to ensure minimal temperature gradients. A temperature range of 10 °C to -40 °C was covered. From 10 °C to -30 °C, steps of 10 °C were imposed. Below -30 °C smaller steps were used. For the higher temperatures, a typical soak time of 2 hours was used to ensure stability and minimize any spatial gradients. For the lower temperatures, a 4 hour soak time at each point was used. The temperature accuracy is estimated to be ± 0.05 °C.
The radiometers were mounted in circular PVC ventilator housings. Different heights of the internal mounting bases ensured that the radiation-sensitive elements of the two dissimilar sensors, the Kipp and Zonen pyranometer CM21 and the Eppley pyrgeometers, were brought to the same level. Eppley radiation shields attached to these circular housings provided identical exposures, so that when mounted side-by-side neither radiometer impinged upon the other's field of view. Ventilation of the radiometers was provided by circulating air into the plenum of the housing and venting through the annular slot surrounding the radiometer's dome. A great deal of effort was expended, throughout the program, to improve the effectiveness of ventilation.
When the radiometer array was serviced, care was taken to avoid unnecessary disturbance of the snow surface in the field of view of the down-looking radiometers. Although some disturbance was caused, it was noted that the wind quickly restored the natural condition of the surface. The height of the radiometer array above the local surface varied throughout the program as snow built up or was eroded. Table 7.1 shows the heights of the downward-looking radiometers with dates, based on logbook entries. Note that some logbook entries referred to the height of the boom. These boom heights were adjusted to yield radiometer heights by subtracting 15 cm.
| Station 1 | Station 2 | Station 3 | Station 4 | |||||||
|---|---|---|---|---|---|---|---|---|---|---|
| Date | Height | Date | Height | Date | Height | Date | Height | |||
| 98 04 07 | 1.58 m | 98 04 16 | 1.83 m | 98 04 14 | 1.40 m | 98 04 21 | 1.75 m | |||
| 98 06 12 | 1.37 m | 98 06 12 | 2.08 m | 98 06 19 | 1.56 m | 98 06 08 | 1.75 m | |||
| 98 06 22 | 1.58 m | 98 06 23 | 2.12 m | 98 06 30 | 1.64 m | 98 06 13 | 1.72 m | |||
| 98 07 06 | 1.66 m | 98 07 08 | 1.65 m | 98 07 09 | 1.79 m | 98 07 29 | 1.96 m | |||
| 98 07 22 | 1.87 m | 98 07 25 | 2.29 m | 98 07 31 | 1.76 m | 98 08 26 | 2.05 m | |||
| 98 08 04 | 1.97 m | 98 07 31 | 2.42 m | 98 08 10 | 1.83 m | 98 09 08 | 2.00 m | |||
| 98 08 29 | 1.93 m | 98 08 08 | 2.27 m | 98 08 25 | 1.85 m | 98 09 28 | 1.90 m | |||
| 98 09 28 | 1.90 m | 98 08 10 | 2.39 m | 98 09 28 | 2.13 m | 98 09 30 | 1.88 m | |||
| 98 09 30 | 1.91 m | 98 08 26 | 2.29 m | |||||||
| 98 09 28 | 1.82 m | |||||||||
Four SSSF radiometer arrays were deployed for the duration of SHEBA.
Shortly after the set-up of the Cleveland station in late October, the dome temperature data from the radiometer array was often 15-25 °C too high. After several attempts to resolve the problem by adjusting the cabling, terminating open channels and changing the delay times for the multiplexer relay, it was surmised that the multiplexing function of the CR10 Campbell data-logger was at fault. A temporary replacement of the original data-logger with a spare data-logger, into which the appropriate coefficients had been loaded, did not solve the problem as the replacement also exhibited multiplexing difficulties. The other stations did not exhibit this problem and a decision was made to swap the Cleveland data logger, together with the associated radiometer array, with the equivalent system from Florida. The problem-prone system was then closer to the ship and easier to work on. This exchange took place on 1 November and the data loggers were reprogrammed with the appropriate coefficients. The two radiometers arrays remained in their new assignments throughout the duration of SHEBA. Further tests were carried out on the radiometer array/Campbell now at Florida. A light bulb heater was installed in the Campbell box to keep the multiplexer slightly warm. By 18 November the light bulb operating at full power was sufficient to maintain the operation of the multiplexer. New multiplexers for the Campbells were shipped the SHEBA ice camp in mid December and the malfunctioning unit was replaced. Thereafter, the problem did not reoccur.
General descriptions of the four sites are given in Section 4. The down-looking radiometers at Atlanta and Baltimore viewed the local snow-covered sea ice throughout most of the duration of the field program. From late July/early August the situation became more complex as first localized, and then more wide-spread, surface melting occurred. Logbook entries after late August mention melt ponds surrounding the remote stations, sometimes covered in refrozen slush. A lead did open very near the Florida array in April, but the surface under the Florida array generally appears to have been subjected to less melt-water ponding and, even during the summer, the Florida down-looking radiometers viewed snow and ice.
The Cleveland station was involved with a pressure ridge in early February and the array was damaged by the ice. In April, the radiometer array was reinstalled on a three-legged stand independent of the PAM tripod and mast supporting the other sensors. This enabled the radiation array to be positioned anywhere in the general vicinity of the station. On 3 April this system was erected near Florida, and was then moved to the Seattle site on 16 April. At Seattle in late April a lead opened within 15m of the array. Subsequently, other leads opened and on 6 June there was open water within 6m of the array.
|
| P. Guest, August 22, 1998 |
The vertical orientation of the radiometer array was monitored continuously with an orthogonal pair of electronic level sensors. These sensors were nominally oriented at 45° to the axis of the boom supporting the radiometer array, in order to be aligned with the level adjustment axes of the array.
During the initial deployment of the SHEBA Flux-PAM stations, it was apparent that a null output of the electronic levels at Baltimore did not correspond with a level orientation of the radiometer array, and the radiometers could only be properly oriented with a bubble level. However, it appears that the radiometer arrays at the other stations were initially leveled using the electronic level sensors as a reference. Then in March or April 1998, NCAR staff discovered that the electronic level manufacturer had not informed them about known offsets in the sensors. Subsequently, this was not always fully appreciated by the field staff and a degree of confusion prevailed throughout the project about the proper reference for leveling the radiometers.
Fortunately each of the SHEBA radiometer arrays was leveled periodically with a bubble level, and the electronic level data immediately following those leveling events appear to be sufficiently consistent throughout the project to warrant using them to correct the data. The following tables list the offsets measured during those leveling events that appear to be valid. After removing these offsets from the data, it appears that the radiometers were generally maintained within 1°-1.5° of level, were often level to better than 1°, and were occasionally out of level by at most 2°-2.5°.
| Station 1 | Station 2 | |||||||
|---|---|---|---|---|---|---|---|---|
| Date | Time | lev.x (deg) | lev.y (deg) | Date | Time | lev.x (deg) | lev.y (deg) | |
| GMT | GMT | |||||||
| 98 03 09 | 21:00 | -0.98 | 0.12 | 98 04 08 | 22:45 | 0.24 | 0.42 | |
| 98 03 31 | 23:00 | -1.06 | -0.06 | 98 04 18 | 04:30 | 0.04 | 0.52 | |
| 98 04 08 | 00:30 | -0.98 | 0.02 | 98 04 30 | 21:30 | 0.10 | 0.48 | |
| 98 04 18 | 21:00 | -1.12 | -0.08 | 98 05 08 | 19:15 | -0.08 | 0.24 | |
| 98 04 21 | 20:00 | -1.04 | 0.10 | 98 06 26 | 23:15 | -0.10 | 0.88 | |
| 98 05 08 | 00:30 | -1.08 | 0.08 | 98 07 07 | 18:40 | -0.02 | 0.44 | |
| 98 07 06 | 18:20 | -1.12 | 0.17 | 98 07 14 | 22:30 | 0.22 | ||
| 98 07 21 | 19:30 | -1.01 | -0.06 | 98 07 23 | 23:15 | 0.18 | ||
| 98 07 25 | 01:00 | -0.86 | 0.10 | 98 07 30 | 22:15 | 0.22 | ||
| 98 07 28 | 23:00 | -0.97 | 0.06 | 98 08 07 | 23:45 | 0.10 | ||
| 98 08 03 | 23:00 | -0.92 | -0.10 | 98 08 10 | 23:45 | -0.08 | ||
| 98 09 06 | 22:50 | -0.22 | ||||||
The radiometer array at Atlanta was not leveled with a bubble until March 1998. However the offsets measured from March through August are internally consistent and are assumed to apply for the entire project. The median values of the observed offsets are -1.01° in x and 0.06° in y; the maximum deviation of the measured offsets from the median values is 0.16°.
With the exception of leveling events, the radiometer levels remained fairly steady until mid-March and then again from mid-August through September. From mid-March until mid-August, settling of the PAM tripod and radiometer legs caused changes of the radiometer level on the order of 0.5°-0.6°. In late March and April this settling is inferred to have been caused by nearby lead activity, and from June until August it was caused by melting of the snow and ice. Note that the radiometers were erroneously `leveled' using the electronic levels at 00:20 GMT on June 27, causing a leveling error of 1.1° in x, and were correctly leveled again at 18:40 GMT on July 6. The maximum deviations of the radiometers from horizontal from October 1997 until March 1998 are inferred to be 1.0° in x and 0.3° in y. The maximum deviations of the radiometers from horizontal from March to September 1998 were 1.1° in x and 0.6° in y.
Campbell data logger #3 and radiation array #3, originally installed at Cleveland, had a cold temperature problem with the data logger multiplexer. Consequently logger and radiation array #3 were swapped with units #4 from Florida on November 1. Radiation array #4 was not leveled with a bubble until April 8, after Station 2 was resurrected at the Seattle site. Station 2 was moved to the Maui site on June 10 and decommissioned on September 20. On July 8, the y axis of the radiometer levels failed. The levels were replaced on August 22, but the y axis data appear to remain defective. The level offsets are moderately consistent from April through August 22, after ignoring the data from a few anomalous leveling events. The medians of the offsets during this period are 0.1° in x and 0.46° in y; the maximum deviations of the measured offsets from the median values are 0.2° in x and 0.4° in y. These values are presumed to also apply during October 1997 at the Florida site and from November through February at the Cleveland site. The offset of the x axis of the levels installed on August 22 is assumed to be -0.22°, the only measurement available.
The radiometer levels remained fairly steady while Station 2 was at the Cleveland site (November through February) The maximum deviations of the radiometers from horizontal at the Cleveland site are inferred to be 0.2° in x and 0.6° in y. The radiometer levels were also fairly steady at the Seattle site until the end of May when surface melting and nearby active leads caused larger movements of the radiometers. The maximum deviations of the radiometers from horizontal in early June were 0.4° in x and 2.1° in y.
There was considerable movement of the radiometers from June through August 22, while station 2 was at the Maui site, associated with melting, cracking and ridging of the floes. The maximum deviations of the radiometers from horizontal during this period were 1.5° in x and, prior to July 8, 2.2° in y. The extreme in the y axis occurred following a spontaneous jump of 2° in the level output on June 22, and it is possible that this was an early symptom of the more obvious failure of the y axis on July 8.
| Station 3 | Station 4 | |||||||
|---|---|---|---|---|---|---|---|---|
| Date | Time | lev.x (deg) | lev.y (deg) | Date | Time | lev.x (deg) | lev.y (deg) | |
| GMT | GMT | |||||||
| 97 10 12 | 22:00 | 1.12 | 2.84 | 98 04 02 | 01:30 | 0.44 | 0.0 | |
| 98 04 15 | 01:30 | 0.40 | -0.28 | 98 04 09 | 05:15 | 0.48 | 0.10 | |
| 98 05 02 | 22:00 | 0.42 | -0.40 | 98 04 20 | 23:30 | 0.38 | -0.02 | |
| 98 05 12 | 21:30 | 0.42 | -0.34 | 98 05 08 | 18:10 | 0.38 | -0.06 | |
| 98 06 29 | 18:30 | 0.24 | -0.14 | 98 06 06 | 23:30 | 0.46 | -0.24 | |
| 98 07 09 | 18:00 | 0.38 | -0.32 | 98 08 01 | 19:15 | 0.40 | 0.24 | |
| 98 07 20 | 23:30 | 0.44 | -0.56 | 98 08 03 | 00:00 | 0.40 | 0.00 | |
| 98 07 30 | 18:30 | 0.58 | -0.32 | 98 08 07 | 20:00 | 0.44 | 0.08 | |
| 98 08 10 | 23:00 | 0.62 | -0.64 | 98 08 11 | 22:00 | 0.28 | 0.00 | |
The radiation array at Baltimore was leveled with a bubble during the station installation in October 1997 and the offsets, 1.12° for x and 2.84° for y, are presumed to apply until March 18, when a new level sensor was installed at Baltimore. For March through September, the medians of the observed offsets are 0.42° in x and -0.33° in y; the maximum deviation of the measured offsets from the median values is 0.3°. On August 24, the radiometer level was obviously adjusted during a site visit, but the adjustment was not mentioned in the logbook and the implied y axis offet is not consistent with previous values. Then the logbook records a site visit on September 6 and notes that the radiometers were adjusted using a bubble level, but no adjustment is apparent in the data. These last two events have been ignored in estimating the level offsets.
From October through March, the radiometer levels at Baltimore were fairly steady; the maximum deviations of the radiometers from horizontal were 0.4° in x and 0.3° in y. From April through September, the maximum deviations of the radiometers from horizontal were 0.7° in x and 1.7° in y. These extremes occurred because of tripod settling during surface melting from mid-June through mid-August.
The radiation array at Florida, #3, was originally installed at Cleveland, but those two arrays were swapped in early November because of the multiplexer problem at Cleveland. Radiation array #3 appears not to have been properly leveled until April 2, 1998, following a move of the station to a new location. The level offsets are moderately consistent from April through August, after ignoring the data from a few anomalous leveling events. The medians of the offsets during this period are 0.4° in x and 0.0° in y; the maximum deviations of the measured offsets from the median values are 0.1° in x and 0.24° in y. These offsets are presumed to also apply during October 1997 at the Cleveland site and from November through March at the Florida site.
With the exception of leveling events, Florida radiometer levels were fairly steady from October 1997 through the end of May. The deviations of the radiometers from horizontal at the end of October are inferred to be 0.4° in both x and y. The maximum deviations of the radiometers from horizontal from November through May are 0.9° in x and 0.6° in y. In early June, the radiometers were at times out of level by 5° or more due to rapid melting of the surface. This was fixed on June 5 and 6 by moving the tripod and installing plywood ablation shields; however surface melting and settling of the tripod continued until the end of August. The maximum deviations of the radiometers from horizontal after June 6 were 2.1° in x and 1.5° in y.
Ventilation of the radiometer domes is an important consideration in the Arctic sea ice environment. When leads of open water are formed, warm sea-water is exposed to the cold atmosphere. Water evaporates and quickly condenses to yield a supercooled water fog, termed `smoke'. This supercooled water fog freezes on exposed surfaces to yield rime, a fluffy low-density deposit. In addition to the riming mechanism, there is also the possibility of the direct deposition of hoar from the vapor phase, when locally supersaturated air encounters the cold surfaces. Irrespective of the specific mechanism of production and whether the deposit was either rime or hoar, the effect of the growth of the low-density frost deposit was to degrade the response of the radiometers.
For the short-wave radiometer the effect can range from a partial reduction of light intensity due to obstruction when the dome is covered with frost, to an apparent enhancement of light intensity when low angle direct sunlight illuminates a partial frost covering and scatters light directly into the radiometer. For the long-wave radiometer the effect can be more subtle. A covering of frost results in the radiometer sensing infrared radiation associated with the frost itself, which is at the ambient air temperature, rather than the true incident radiation. The contribution of this component of the radiation depends on the extent of coverage. Any significant frost coverage of the radiometers renders the radiation data suspect. During the passage of supercooled fogs it would be very difficult to avoid the deposition of rime/hoar. However, there was the hope that, after the condition had abated, ventilation of the domes with under-saturated ambient air would result in the removal of the frost. Heating of the air, even by a fraction of a degree, would enhance this effect. A serious limitation which constrained the efficiency of the ventilation of the Flux-PAM radiometer array was the total amount of power available at the remote stations. Only 20-30 Watts was generated by the thermo-electric generators for the operation of all functions of the remote station. Of this, only ~8 Watts was available for ventilation and/or heating, ~2 Watts per radiometer.
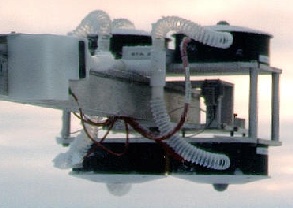
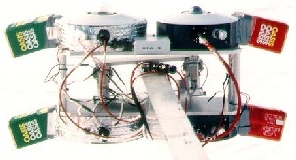
A succession of different ventilation/heating systems were devised for the radiometer arrays over the first several months of the SHEBA deployment.
|
| E. Andreas, October 12, 1997 |
The next variant, tested at Florida during late February, removed the resistance heater from the axial fan holder and utilized six 0.2 Watt resistance heaters, installed in the ventilation plenum distributed around the ventilator slot. Again the ventilator/heater combination failed to prevent the accumulation of rime.
|
| E. Andreas, May 17, 1998 |
|
| E. Andreas, May 16, 1998 |
In addition to the improvements in the ventilation to reduce the riming of all radiometers, the Kipp and Zonen incoming and outgoing short-wave radiometers were specifically modified using electrical resistance heater elements. Starting with the Florida radiometers on 10 April, 2.5 Watt, 30 ohm Minco heating elements were introduced into the short-wave radiometer inter-dome space. Addition of the Minco heating elements was subsequently carried out for Baltimore, Seattle, and Atlanta on April 14, 19 and 22, respectively.
When Station 2 was initially resurrected adjacent to Florida in April 1998, an experiment was undertaken to determine the effect of the removal of the pyranometer outer dome on both the calibration and the riming characteristics of the radiometer. This was motivated by the observation in the field that the double-dome pyranometers generally became rimed before the adjacent single-dome pyrgeometers. On April 4, the outer domes of the Station 2 pyranometers were removed, and for the following week the radiometers were operated with only the single inner dome. The result of the week-long study was that the riming of the Station 2 single-dome pyranometers was slightly less than that of the Florida double-dome pyranometers. However, inspection of the short-wave radiation flux data indicated that the flux measured by the Station 2 single-dome pyranometer was ~5-8% greater than the flux measured by the adjacent Florida array. With such a minimal improvement in the riming characteristics and a noticeable change in the response, it was decided to abandon the idea of removing the outer domes.
During the course of station visits, the radiometers were often manually cleaned to remove frost and ice deposits, although in some cases the record indicates that the deposits were resistant to these attempts. Tables 7.7.1-7.7.4 list the recorded manual cleaning incidents, including references to the corresponding logbook entries. It is certainly likely that additional manual cleaning events occurred which were not recorded.
| Date | Time | Event | Log | Date | Time | Event | Log | |
|---|---|---|---|---|---|---|---|---|
| GMT | GMT | |||||||
| 97 10 16 | ? | Ice on domes | 41 | 98 03 20 | 12:00 | Cleaned domes | 328 | |
| 97 10 25 | 21:00? | Cleaned all sensors | 97 | 98 03 31 | 22:00 | Cleaned SW domes | 346 | |
| 97 12 23 | 20:00 | Cleaned domes | 167 | 98 04 06 | 23:00 | Cleaned SW domes | 365 | |
| 97 12 23 | 20:30 | Cleaned domes | 187 | 98 04 11 | 23:30 | Cleaned domes | 384 | |
| 98 01 15 | 20:00 | Cleaned domes | 217 | 98 04 18 | 20:00 | Cleaned domes | 404 | |
| 98 02 0 2 | 08:00 | Frost on domes | 242 | 98 04 21 | 18:30 | Cleaned domes | 414 | |
| 98 02 08 | 23:45 | Could not clean domes | 249 | 98 04 28 | 23:00 | Cleaned domes | 434 | |
| 98 02 11 | 19:00 | Cleaned domes | 274 | 98 07 21 | 9:30 | Cleaned domes | 592 | |
| 98 03 05 | 20:00 | Removed array | 299 | 98 08 03 | 15:00 | Cleaned domes | 614 | |
| 98 03 09 | 20:00 | Replaced array | 308 | 98 08 14 | 20:00? | Ice on domes | 635 | |
| Date | Time | Event | Log | Date | Time | Event | Log | |
|---|---|---|---|---|---|---|---|---|
| GMT | GMT | |||||||
| 97 10 12 | 19:00? | Set-up | 37 | 98 04 04 | 04:00 | Restarted station | 353 | |
| 97 10 19 | 22:30 | Cleaned domes | 52 | 98 04 10 | 15:00 | Reinstalled outer domes | 375 | |
| 97 10 22 | 22:00 | Removed array | 56 | 98 04 12 | 02:15 | Cleaned domes | 382 | |
| 97 10 21 | 22:00 | Replaced array | 59 | 98 04 19 | 22:45 | Cleaned SW | 409 | |
| 97 12 18 | 19:30 | Cleaned domes | 155 | 98 04 22 | 23:00 | Replaced SW dome | 418 | |
| 97 12 27 | 20: 00? | Cleaned domes | 173 | 98 05 28 | 02:00? | Ice on domes | 489 | |
| 98 01 05 | 20:00? | Frost on domes | 191 | 98 07 06 | 19:00 | Cleaned SW domes | 571 | |
| 98 01 17 | 20:00 | Cleaned domes | 220 | 98 07 23 | 23:00 | Cleaned domes | 595 | |
| 98 02 06 | 06:00 | Cleveland damaged | 258 | 98 08 10 | 23:30 | Cleaned domes | 625 | |
| Date | Time | Event | Log | Date | Time | Event | Log | |
|---|---|---|---|---|---|---|---|---|
| GMT | GMT | |||||||
| 97 10 12 | 21:00 | Set-up | 33 | 98 03 04 | 20:30 | Cleaned domes | 296 | |
| 97 10 16 | 00:00? | Ice on SW domes | 42 | 98 03 18 | 20:00 | Cleaned domes | 324 | |
| 97 12 24 | 20:30 | Cleaned domes | 170 | 98 03 31 | 01:00 | Removed array | 344 | |
| 98 01 01 | 21:00 | Cleaned domes | 183 | 98 04 14 | 17:00 | Replaced array | 395 | |
| 98 01 13 | 21:00 | Cleaned domes | 213 | 98 05 01 | 23:00 | Cleaned SW domes | 443 | |
| 98 02 18 | 00:00? | Cleaned domes | 264 | 98 08 10 | 23:00 | Cleaned domes | 626 | |
| Date | Time | Event | Log | Date | Time | Event | Log | |
|---|---|---|---|---|---|---|---|---|
| GMT | GMT | |||||||
| 97 12 14 | 00:00 | Removed/ reinstalled array | 142 | 98 03 05 | 00:00 | Replaced array | 297 | |
| 97 12 17 | 01:00 | Cleaned domes | 148 | 98 03 07 | 22:00 | Cleaned domes | 304 | |
| 97 12 20 | 08:30 | SW domes frosted | 161 | 98 03 08 | 2000? | Cleaned SW domes | 306 | |
| 97 12 23 | 23:00 | Cleaned domes | 168 | 98 03 13 | 20:00 | Cleaned domes | 315 | |
| 97 12 29 | 22:45 | Cleaned domes | 175 | 98 03 16 | 18:30 | Cleaned domes | 320 | |
| 98 01 08 | 20:00 | Removed array | 201 | 98 03 22 | 18:00 | Cleaned domes | 331 | |
| 98 01 09 | 18:00 | Replaced array | 205 | 98 03 24 | 22:30 | Cleaned domes | 336 | |
| 98 01 10 | 20:30 | Cleaned domes | 208 | 98 04 03 | 18:00 | Cleaned domes | 351 | |
| 98 01 11 | 23:15 | Frost on domes | 209 | 98 04 05 | 18:00 | Cleaned domes? | 359 | |
| 98 01 31 | ??:?? | Cleaned domes | 239 | 98 04 09 | 00:00- 06:00 | Removed/ reinstalled array | 369 | |
| 98 02 03 | 20:00? | Frost on domes | 243 | 98 04 21 | 19:15 | Cleaned domes | 413 | |
| 98 02 21 | 22:00 | Removed array | 270 | 98 05 08 | 21:00 | Cleaned domes | 455 | |
| 98 02 24 | 20:00 | Replaced array | 277 | 98 08 07 | 19:00 | Cleaned domes | 619 | |
| 98 02 28 | 00:00 | Removed/ reinstalled array | 286 | 98 09 18 | 20:00? | Cleaned domes | 696 | |
| 98 03 02 | 01:00 | Removed array | 290 | |||||
It was observed in the field, that whenever any one radiometer of the array became rimed, then generally all the radiometers also became rimed. Advantage can be taken of this by examining the response of the up-looking pyrgeometer. Any significant riming of the dome of the up-looking pyrgeometer results in the pyrgeometer viewing this frost coating rather than the sky. As this frost coating is at the ambient near-surface temperature there is a significant difference in the apparent energy flux. Examination of pyrgeometer data, when manual cleaning removed the frost coating the dome, allowed the magnitude of this difference to be seen. Between January 18-25, 1998, the radiation array at Florida was cleaned six times, and each time the rime re-established itself. As can be seen from Figure 7.1, step changes of 30 - 40 W/m², corresponding to a temperature difference of ~12 °C, were observed each time the rime was removed and the radiometer viewed the sky.
Although the ETL and ARM down-welling long-wave radiation data did show a systematic difference of a few W/m², examination of their year-long record indicated that both normally remained rime-free. Assuming a spatially-homogeneous sky cover, the differences between the down-welling long-wave radiation data from the remote stations and the comparable data from the well-maintained ETL and ARM radiometers can provide a clue as to the riming conditions. Whenever the difference exceeds some threshold, then riming can be suspected on the remote station radiation array.
The down-welling radiation differences for each Flux-PAM station, referenced to both the ETL and ARM radiometers, are included in the hourly SHEBA data as Rlwdiff.in.ETL and Rlwdiff.in.ARM. Individual plots for Stations 1, 2, 3, and 4 show the index based upon the ETL data. It is suggested that whenever the value exceeds ~20 W/m², the radiation data from the remote station should be regarded with suspicion, as riming is likely to be present. It may be seen that riming conditions persisted throughout November, December, January and February, and then diminished, occurring much less regularly in the months of March, April and May, and were practically absent later in the year.
| Table of Contents | Previous | Top | Next |