
 SHEBA ISFF Flux-PAM
Project Report
SHEBA ISFF Flux-PAM
Project Report
SHEBA ISFF Flux-PAM
Project Report
SHEBA ISFF Flux-PAM
Project Report
Atmospheric pressure was measured with Vaisala PTB 220B digital barometers located inside the large insulated boxes containing
|
| J. Militzer |
Atmospheric temperature and relative humidity were measured with NCAR hygrothermometers (TRH) consisting of a Vaisala Humitter 50Y sensor interfaced to NCAR microprocessor electronics and enclosed in a mechanically-aspirated NCAR radiation shield. The Vaisala 50Y sensors employ a platinum-resistance temperature (PRT) transducer and an Intercap capacitive humidity transducer. Since the 50Y PRT has a lower limit of -40 °C, it was supplemented for the SHEBA project with a thermistor calibrated over the range -55 °C to 10 °C. The temperature and humidity sensors were calibrated prior to the SHEBA field project in the NCAR Sensor Calibration Laboratory and the derived calibration coefficients were entered into EPROM memory in the individual TRH electronics. The NCAR hygrothermometer outputs a serial message containing fully-calibrated temperature(s) and relative humidity (with respect to water) data.
The TRH electronics were also used to ingest data from the electronic magnetometer compass. Since the compass data are necessary for determination of wind direction, they are discussed in the section of the report devoted to the sonic anemometers.
Temperature and humidity calibrations were performed at NCAR both before and after the SHEBA field project. The post-project temperature calibrations were nominally within 0.1 °C of the pre-project calibrations for both the platinum resistance and thermistor transducers. During the post-project humidity calibrations, the outputs from four of the 50Y sensors were less than the pre-project calibrations by 2-4 %RH, while a fifth sensor (TRH006) was less by 4-8 %RH. The cause of the departure of TRH006 from the other NCAR 50Ys is not known. Additional post-project laboratory tests were performed to determine the performance of the 50Y sensors near the frost point at low temperatures. The results of those tests are found in Appendix A.
The sign of the humidity calibration shift is also somewhat surprising, because contamination of the capacitive transducers would be expected to increase rather than decrease the sensor output. However, a similar shift (relative to the manufacturer's original calibration) was found in the post-project calibration at NCAR of Vaisala HMP 35 sensors used on the ASFG 20-m tower. A smaller shift of only 1-2 %RH was found for an ASFG hand-held HMP 35 unit, which had much less exposure to the environment over the course of the project. The humidity sensors were calibrated at -15 °C in a Thunder Scientific 2-pressure humidity chamber, with a manufacturer-specified accuracy of ±1 %RH. More details on the calibration procedures and results are available on request from NCAR.
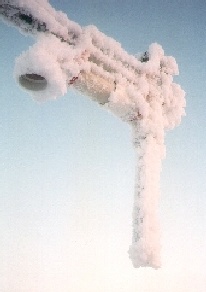
The hygrothermometer radiation shield is composed of two concentric cylinders made of thin-walled brass tubes,
|
| E. Andreas, October 25, 1997 |
Table 6.1 lists the heights of the TRH radiation shield
inlets measured relative to the local surface.
(On August 24-26, the heights of the hygrothermometer booms were measured
at stations 2-4, rather than the inlet heights,
and the heights of the inlets were estimated
by subtracting 43 cm from those measurements.)
The heights of the sonic booms were measured more often than
the heights of the hygrothermometer inlets and are also listed in Table 6.1
so that they can be used to estimate the inlet heights
when the inlet heights were not measured directly.
The variability of the difference of these two heights is perhaps caused by
lack of spatial uniformity of the surface.
| Station 1 | Station 2 | |||||
|---|---|---|---|---|---|---|
| Date | TRH | Sonic | Date | TRH | Sonic | |
| 97 10 15 | 2.88m | 97 10 15 | 2.88m | |||
| 98 04 11 | 2.26m | 98 04 11 | 2.82m | |||
| 98 04 17 | 2.26m | 98 04 16 | 2.87m | |||
| 98 05 21 | 1.27m | 2.22m | 98 05 16 | 1.81m | 2.87m | |
| 98 06 12 | 1.43m | 2.39m | 98 06 12 | 2.04m | 3.02m | |
| 98 06 22 | 1.61m | 2.51m | 98 06 23 | 1.92m | 3.03m | |
| 98 07 06 | 2.77m | 98 07 07 | 3.12m | |||
| 98 07 21 | 2.87m | 98 07 23 | 3.24m | |||
| 98 08 03 | 2.92m | 98 07 30 | 3.23m | |||
| 98 08 29 | 1.87m | 2.97m | 98 08 26 | 2.18m | 3.28m | |
| 98 09 16 | 1.84m | 2.90m | 98 09 16 | 2.30m | 3.26m | |
| 98 09 30 | 1.69m | 2.73m | ||||
| Station 3 | Station 4 | |||||
|---|---|---|---|---|---|---|
| Date | TRH | Sonic | Date | TRH | Sonic | |
| 97 10 15 | 2.87m | 97 10 23 | 1.73m | 2.90m | ||
| 98 04 22 | 2.46m | 98 04 11 | 2.75m | |||
| 98 05 15 | 1.43m | 2.34m | 98 04 20 | 2.62m | ||
| 98 06 18 | 1.71m | 2.63m | 98 05 16 | 1.88m | 2.84m | |
| 98 06 29 | 1.80m | 2.68m | 98 06 08 | 1.87m | 2.89m | |
| 98 07 09 | 2.69m | 98 06 13 | 1.86m | 2.90m | ||
| 98 07 30 | 2.97m | 98 07 29 | 2.93m | |||
| 98 08 10 | 2.97m | 98 08 26 | 1.87m | 2.95m | ||
| 98 08 24 | 1.94m | 2.93m | 98 09 08 | 1.87m | 2.93m | |
| 98 09 20 | 1.90m | 2.92m | 98 09 20 | 1.96m | 2.92m | |
| 98 09 30 | 1.82m | 2.94m | ||||
Andreas and Claffey have provided 1 hour estimates of TRH and sonic height above snow, based on the above measurements and snowline data from Don Perovich's group. These estimates are documented in an appendix to this report.
Six NCAR hygrothermometers were used during SHEBA field operations. Table 6.2 lists the history of the TRH serial numbers for each station. Each row represents a change in the hygrothermometer at one of the stations. Also included in the table are the apparent reasons for the changes and a reference to the relevant logbook entry. Only one or two changes appear to be associated with failures of the temperature and humidity sensors. Many of the TRH changes were associated with upgrades or repairs that were implemented by successive swaps among the stations. These included an improvement to the radiation shield mount, installation of sonic heaters, and repair of a beacon. (The sonic heaters and beacon were controlled by the TRH microprocessor.) The TRH aspiration fan occasionally attracted the attention of a passing polar bear and thus two changes were needed to repair bear damage. Note that TRH001 saw limited use before failing and did not receive a post-project calibration.
| Date | GMT | 1 | 2 | 3 | 4 | Comment | Logbook # |
|---|---|---|---|---|---|---|---|
| 0003 | 0004 | 0005 | 0006 | installed | |||
| 97 10 28 | 18:50 | 0003 | 0004 | 0005 | 0007 | improve mount | 93 |
| 97 10 28 | 23:35 | 0003 | 0006 | 0005 | 0007 | improve mount | 93 |
| 97 10 29 | 19:20 | 0004 | 0006 | 0005 | 0007 | improve mount | 97 |
| 97 10 30 | 00:50 | 0004 | 0006 | 0003 | 0007 | improve mount | 98 |
| 97 12 24 | 21:55 | 0004 | 0006 | 0007 | suspicious RH? | 170 | |
| 97 12 27 | 20:30 | 0004 | 0005 | 0006 | 0007 | bear repair | 125,155,173 |
| 97 12 31 | 23:35 | 0004 | 0005 | 0006 | 0003 | test | 180 |
| 98 01 08 | 06:10 | 0004 | 0005 | 0006 | 0007 | sonic heaters | 195 |
| 98 01 13 | 20:35 | 0004 | 0005 | 0007 | sonic heaters | 213 | |
| 98 01 14 | 03:15 | 0004 | 0005 | 0007 | 0006 | sonic heaters | 212 |
| 98 01 15 | 19:55 | 0006 | 0005 | 0007 | sonic heaters | 217 | |
| 98 01 21 | 00:40 | 0006 | 0005 | 0007 | 0003 | sonic heaters | 225 |
| 98 02 03 | 22:15 | 0005 | 0007 | 0006 | repair beacon | 243 | |
| 98 02 09 | 00:40 | 0003 | 0007 | 0006 | repair beacon | 242 | |
| 98 02 26 | 01:15 | 0003 | 0007 | 0005 | test? | 280 | |
| 98 03 31 | 01:05 | 0003 | 0001 | 0005 | bear repair | 344 | |
| 98 04 06 | 22:35 | 0003 | 0006 | 0001 | 0005 | resurrected stn 2 | 362 |
| 98 05 11 | 22:45 | 0003 | 0006 | 0001 | 0007 | check spare | 461 |
| 98 05 25 | 22:20 | 0003 | 0006 | 0005 | 0007 | bad RH | 485 |
During SHEBA field operations, it was noted that the 50Y PRT was usually from 0 to 0.2 °C warmer than the thermistor, although the laboratory calibration of both transducers is accurate to better than 0.1 °C. The PRT is the standard Vaisala 50Y temperature sensor and is enclosed, along with the humidity sensor, in a porous shield designed to protect the humidity sensor from contamination. The thermistor was mounted external to the porous shield. We suspect that the PRT was not dissipating its self-heating as effectively as the thermistor sensor, because the porous shield restricts the heat exchange with the ambient air. This explanation is supported by a series of simple tests carried out in early March 1998: when the porous shield was removed, the temperature of the PRT was no longer higher than that of the thermistor, and when it was replaced, the PRT was again warmer than the thermistor. Thus the thermistor data might be expected to better represent the ambient air temperature, but the 50Y PRT data should be used (above -35 °C) to convert the 50Y relative humidity measurements to ambient mixing ratio. The hour-average air temperatures calculated during post-project processing of the data are the PRT temperature above -35 °C (as determined by the PRT) and the thermistor temperature below.
| Table of Contents | Previous | Top | Next |