| Graphic: | 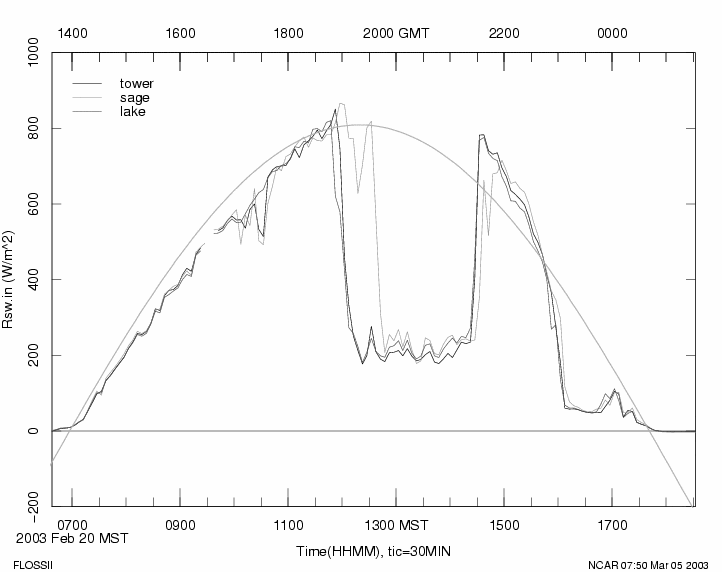
When Kate was here on Monday, I was concerned that Rsw.in was significantly
different at times between the sites.  Some of this could be snow/ice on the
domes, but it seemed like there were more cases with different radiation than
could be explained just by snow/ice.  Now is an example where there are patches
of sun slowly propogating across the surface, which could make differences
(at least instantaneously) of Rsw.in between lake/sage/tower.  I'm still not
completely convinced that the 5-min ave values should be as different as the
400 W/m2 that we sometimes get.

P.S. The attached graph shows several problems (that are real!).  [The red line
is: 1300*sin(dat("azel.sun")[,2]*pi/180)
1. A semi-stationary cloud pattern (probably orographically influenced) shadows
grass and lake at about noon, but doesn't move over sage until 45min later.
2. When this cloud shifts off at about 14:00, it apparently ducts some of the
sun to have even more than a clear-sky irradiance.
3. At about 16:00, thick clouds built up along the Gore Range cause "sunset" to
occur early, though some light is still present until real sunset.

It is going to be difficult to use these data for QCing snow/ice cases!
It may also indicate that using Rlw.in.sage as a surrogate for Rlw.in.grass may
be a mistake.
189: Soil, Site all stns, Tue 04-Mar-2003 13:37:58 MST, Gravimetric soil samples
17:00 Mar 4 Sage
Near B.
                   Fresh(4 Mar) Dry(5 Mar)	%(wet/total)
A sample taken 16:00 which broke, but I recovered some:
   0-~5	   	   80.3		56.9		29.1
		   56.9		49.7		12.7

The real sample:
   0-3 cm  EI 	   28.0	    	18.4 		34.3
           EII     30.0		19.8		34.0
           EIII    28.7		19.8		31.0
   Mean:					33.1
   Total sample:   88.6         [59.3]
   Density:			[0.86]

   3-8 cm  FI      52.8		44.1		16.5
           FII     54.0		44.5		17.6
           FIII    48.8		38.4		21.3
   Mean:					18.5
   Total sample:  179.3		[146.1]
   Density:			[1.28]

12:45 Mar 4 Lake
Close to B!
Dug down through 28 cm of snow - broke up ice coating surface

                   Fresh(4 Mar) Dry(5 Mar)
(has some ice/snow on the top, but mostly solid frozen)
  0-3 cm  AI       38.0		28.5		25.0
          AII      35.9		27.3		24.0
          AIII     23.3		17.8		23.6
  Mean:						24.2
  Total sample:	   99.8		[75.6]
  Density			[1.10]

(peaty: root and stem)
  3-8 cm  BI       19.3		14.7		23.8
          BII      15.7		11.3		28.0
          BIII     16.0		11.2		30.0
  Mean:						27.3
  Total sample:    87.8         [63.8]
  Density:	   		[0.56]

15:00 Mar 5 Grass site:
Close to B:
Dug down through 28 cm of snow - broke up ice coating surface

                   Fresh(5 Mar) Dry(6 Mar)
(has some ice/snow on the top, but mostly solid frozen)
  0-3 cm  CI       18.3		4.4		76.0
          CII      10.9		3.1		71.6
          CIII     12.9		2.9		77.5
  Mean:						[75.0]
  Total sample:	   42.9		[10.7]
  Density	   0.62		0.16

(peaty: root and stem)
  3-8 cm  DI       28.3		22.1		21.9
          DII      19.8		13.1		33.8
          DIII     29.4		24.0		18.4
  Mean:						[24.7]
  Total sample:    111.2	[83.7]
  Density:	   0.97		0.73

17:00 Mar 5 Lake site:

Close to C:

                   Fresh(5 Mar) Dry(
(has some ice/snow on the top, but mostly solid frozen)
  0-3 cm  EI       32.8		23.5		28.4	[had a grub inside!]
          EII      26.9		19.7		26.8
          EIII     28.4		20.6		27.5
  Mean:						[27.5]
  Total sample:	   92.5		[67.1]
  Density	   1.35		0.98

(peaty: root and stem)
  3-8 cm  FI       39.4		24.7		37.3
          FII      44.8		32.3		27.9
          FIII     39.8		22.7		43.0
  Mean:						[36.1]
  Total sample:    157.9	[100.9]
  Density:	   1.38		0.88

09:30 Mar 6 Grass site:
Close to A:
                   Fresh(6 Mar) Dry(7 Mar)
(has some ice/snow on the top, but mostly solid frozen)
  0-3 cm  AI       14.5		1.6		89.0
          AII      10.6		1.0		90.6
          AIII     11.1		1.1		90.1
						89.8
  Mean:
  Total sample:	   37.0 	3.8		(but not complete volume)
  Density	   0.54		0.06

(peaty: root and stem)
  3-8 cm  BI       22.2		9.8		55.9
          BII      16.5		7.5		54.5
          BIII     17.9		4.6		74.3
  Mean:						61.3
  Total sample:    87.8		34.0
  Density:	   0.77		0.30

13:00 Mar 6 Sage site:
Close to A:
I took two cores that broke (along with the corer), so I only recovered about
6cm deep cores twice.
                   Fresh(6 Mar) Dry(7 Mar)
  0-~6 cm EI       44.2		34.3		22.4
          EII      34.5		27.3		20.9
          EIII     42.4		34.0		19.8
  Mean:						21.1
  Total sample:	   138.7 	109.4		(very crude estimate)
  Density	   1.01		0.80

  0-~6 cm FI       42.8		34.5		19.4
          FII      37.7		31.4		16.7
          FIII     39.4		31.8		19.3
  Mean:						18.5
  Total sample:    168.1 	137.0		(very crude estimate)
  Density:	   1.22		1.00


[] values are calculated from other variables
Diameter of corer is 5.4cm
187: Weather, Site all stns, Tue 04-Mar-2003 09:00:17 MST, snowing
It started snowing ~0500 this morning and is still coming down -- I estimate
about 1" has fallen so far.  About 15 min ago, I checked sage and all sensors
were snow-free (T/RH, sonic, krypton, 4-comp rad, and net).
182: Weather, Site all stns, Sun 02-Mar-2003 09:58:56 MST, fog/frost
There was heavy fog last night and associated rime this morning on all sensors.
On the drive in (~0830), I brushed the rime (but couldn't get at all of the
underlying frost) off of all rads, sonic, and krypton at sage, then at lake.

About 0900, I brushed off bare.1.5m, then all grass rads.  I then brushed off
the 1&2m sonic and krypton at the tower.  Next, I "twanged" the NW guy wires
to knock rime off all sonics and kryptons.  Nevertheless, I decided to climb
the tower to check on the effectiveness of the "twanging".  I twanged the
side boom guy wires and was able to knock off a bit more rime, though I think
that the tower guy twanging would have been adequate by itself.  All this
twanging was sufficient to get the 20&30m sonics happy again (not cycling diag).

While on the tower, I noticed that rime had clogged the T/RH inlets.  I blew/
wiped the rime off of all of the T/RHs, in the order: 30, 25, 20, 15, 10, 5,
0.5, 1, 2m.  Note that I didn't open the tubes to get at any ice that may
be on the Gortex cap.  Also note that I didn't think of doing the T/RHs at
lake and sage.
180: Weather, Site all stns, Sat 01-Mar-2003 14:37:43 MST, fog this AM
We took the morning off to go to Steamboat, but noticed that there was still
fog in low-lying areas at 8:40 this morning.  Thus, I'm not surprised that the
kryptons had their usual failures.

We also saw 2 coyotes and a large herd of elk along the road driving into the
site just now.
168: Radiometers, Site all stns, Wed 26-Feb-2003 15:28:33 MST, Removing radiometer snow doughnuts
The ventilation prevented the fine powdery snow from settling upon the
radiometer domes. Doughnuts of snow formed, up to 7-8cm high, with a central
hole and an annulus extending from the ventilator slot to the edge of the
radiation shield. All upward-looking radiometers as well as the ice detectors
had the same problem. Some downlooking rads had an icicle from their dome.
14:00 Sage, removed doughnuts and cleaned all domes.NB Netrad was already clear.
14:10 Lake, ditto
14:21 Grease, cleaned dome
14:28 Bare, cleaned dome.
14:30 4m scaffold, removed doughnut and cleaned domes
14:32 Ice.a and Ice.b ditto
14:45 - 14:55 Drew in boom. S pyrg already clear, removed doughnut from N pyrg.
              The fans were unplugged with the N fan's wires cut.
              Left trolley inboard until we fix fan wiring.
16:10 -16:20  Remounted fans and powered up. Fans operated.
              Ran out the trolley BUT THE TROLLEY DIDN'T GO ALL THE WAY
167: Status, Site all stns, Tue 25-Feb-2003 16:35:00 MST, Daily status, Feb 25
Weather Plots:  OK

Rain Gauge: OK

Vbatt: Got a little low last night.  It dropped to ~12.1.

Sonics 2m: OK

Sonics profile: OK

Krytons: kh2o.20m  stn0  spiked to almost 14 g/m3 between 1000 and 1100

MST Feb  Other sensors ranged between 2-4 g/m3 during that same time.
No diurnal variation last night.

H2O-kh2o: this plot also shows data spike from 20m sensor.

Tv and P:  OK.

Scalar variance: OK

Fluxes at 2m: OK

Flux profiles: OK

CO2:  OK

TRHdiff 2m:  OK

TRH_diff_profiler:  Temp profile is good.  RH profile looks a little
different most likely because of the snow.  30m sensor is recording
about 2% more moisture then other sensors, which is probably fine.
Should keep an eye on 2m meter sensor to see how it behaves.  Currently
it's reading ~3-4% lower than other sensors, may be malfunctioning.

Thermocouples, Ice Detectors:  Ttc.ref.stn0 is OK. It is a reference
temperature and will vary from the other Ttc's.

Long Wave Rad:. OK

|Tdome-Tcase| : .OK

Tsoil:  . Tsoil.2.5cm.a.sage still looks like it may be exposed to
air.  Im just ignoring this, since we should have adequate Tsoil
sampling.  All Tsoil tower(grass) have a bit nit of noise from the
radiometer fans, but this is small enough that I'm ignoring it too.

Qsoil:  Qsoil.c.10cm lake sensor still down.  It might also be a cable
cut (like the Gsoil.10.cm.a problem found at lake), but will require
more digging up of snow to check.  Currently, I'm ignoring this as well
since there is probably enough redundancy in the Qsoil measurements.

Gsoil:  Gsoil.c.10cm.sage still bad, the cable was probably cut.  Needs
to be fixed.
Gsoilc.10cm.lake still on the fritz.

Soil Thermal Properties:  Are looking better.  Steve has been keeping a
close eye on the data and the sensors appear to working properly, and
are giving us some good data.

u,v spectra, stn 1-3:   Good

w,tc spectra, stn 1-3:  OK

u,v spectra tower:  OK

w,tc spectra tower: OK

kryton spectra:  A lot of white noise between 0000-0030 higher
than 1.00 Hz
166: , Site all stns, Tue 25-Feb-2003 10:59:37 MST, Site inspection after snow
Persistant snow fall last night and on into the daytime. Only ~10 cm of low
density powder.
Saw well over 100 elk near the road near Sage..
Arrived at 8:45: check_aster, Daisy and Cosmos, Dailies only completed to 22 Feb.
9:30 - 10:00 Yutaka Hagimoto and I inspected tower site.
Ice detecors have snow doughnuts, 6 or so cm high with a hole down to the domes.
Photograped and also applied handkerchief test. Light lit (and also later saw
cockpit response.
Cleaned snow from cal gas guages:
Hi-cal = 1250/10
Lo-cal = 1400/12
Walked in front of tower photographed lower levels of sensors. Neither sonics
nor Kr's snow clogged..
Climbed 20m or so up tower. Snow on steps and walkways.

10:30 visited Sage: cleaned solar panels
From ladder photographed LW.in and SW.in. Same snow doughnuts as ice detectors.
Neither sonic nor Kr snow clogged.
165: Status, Site all stns, Mon 24-Feb-2003 17:08:00 MST, Daily status, Feb 24
Weather Plots:  OK

Rain Gauge: OK

Vbatt: Great.

Sonics 2m: OK

Sonics profile: OK

Krytons: kh2o.2m  sage increased to almost 6 g/m3 between 2100 and 2200
MST Feb 23 and then slowly dropped back down.  Other sensors ranged
between 1-2 g/m3 during that same time.

H2O-kh2o: this plot shows sensor at 2m sage measuring more moisture
also.

Tv and P:  OK.

Scalar variance: OK

Fluxes at 2m: OK

Flux profiles: OK

CO2:  OK

TRHdiff 2m:  RH plot shows sage-tower is about 2% more moist than
lake-tower between 1900 MST Feb 23 and 1300 MST Feb 24.

TRH_diff_profiler: looks like we had a little inversion between
0500-0800 MST

Thermocouples, Ice Detectors:  Ttc.ref.stn0 is doing it's own thing (and
has been since plotting began), and doesn't look good. Ttc.h.stn.0
deviates a bit from the other sensors also (~2-5 deg) between 2000 MST
Feb 23 and 0400 Feb 24.

Long Wave Rad:. OK

|Tdome-Tcase| : .OK

Tsoil:  . Tsoil.2.5cm.a.sage still looks like it may be exposed to
air.  Im just ignoring this, since we should have adequate Tsoil
sampling.  All Tsoil tower(grass) have a bit nit of noise from the
radiometer fans, but this is small enough that I'm ignoring it too.

Qsoil:  Qsoil.c.10cm lake sensor still down.  It might also be a cable
cut (like the Gsoil.10.cm.a problem found at lake), but will require
more digging up of snow to check.  Currently, I'm ignoring this as well
since there is probably enough redundancy in the Qsoil measurements.

Gsoil:  Gsoil.c.10cm.sage still bad, the cable was probably cut.  Needs
to be fixed.
Gsoilc.10cm.lake still on the fritz.

Soil Thermal Properties:  Are looking better.  Steve has been keeping a
close eye on the data and the sensors appear to working properly, and
are giving us some good data.

u,v spectra, stn 1-3:   Good

w,tc spectra, stn 1-3:  OK

u,v spectra tower:  OK

w,tc spectra tower: w.1m isn't really following along with other
profiles?

kryton spectra:  Quite a bit of white noise between 0000-0030 higher
than 1.00 Hz
163: Status, Site all stns, Fri 21-Feb-2003 15:00:00 MST, Daily status, Feb 21
Weather Plots:  OK

Rain Gauge: OK

Vbatt: Great.

Sonics 2m: OK

Sonics profile: OK

Krytons: Good.

H2O-kh2o: OK

Tv and P:  OK.

Scalar variance: for 2m tc'tc' plot tower and sage show a bit more
scalar variance than lake during the daytime (1.0-1.5 deg).

Fluxes at 2m: tower and sage also show slightly more flux than at lake,
although difference is not as great (~.3)

Flux profiles: OK

CO2:  Large spike (from 241 up to 253 and back down) at 1400 MST on Feb
20.

TRH:OK

Long Wave Rad:. OK

|Tdome-Tcase| : .OK

Tsoil:  . Tsoil.2.5cm.a.sage still looks like it may be exposed to
air.  Im just ignoring this, since we should have adequate Tsoil
sampling.  All Tsoil tower(grass) have a bit nit of noise from the
radiometer fans, but this is small enough that I'm ignoring it too.

Qsoil:  Qsoil.c.10cm lake sensor still down.  It might also be a cable
cut (like the Gsoil.10.cm.a problem found at lake), but will require
more digging up of snow to check.  Currently, I'm ignoring this as well
since there is probably enough redundancy in the Qsoil measurements.

Gsoil: Gsoila.10cm.lake(3) began to drift off on it's own at ~2100 MST
Jan 19.  It kept decreasing until 0700-0800 MST on the 20th when it
slowly began to rise again.  By noon it was back in line with the other
sensors.
Gsoil.c.10cm.sage still bad, the cable was probably cut.  Needs
to be fixed.
Gsoilc.10cm.lake still on the fritz.

Soil Thermal Properties:  Are looking better.  Steve has been keeping a
close eye on the data and the sensors appear to working properly, and
are giving us some good data.

u,v spectra, stn 1-3:   There appears to be some white noise at the
lower frequencies (.001 Hz) and also at frequencies greater than 10.0.

w,tc spectra, stn 1-3:  OK

u,v spectra tower:  Some white noise at frequencies greater than 10.0 Hz

w,tc spectra tower: OK

kryton spectra:  OK
162: Status, Site all stns, Wed 20-Feb-2003 15:00:00 MST, Daily status, Feb 20
Weather Plots:  OK

Rain Gauge: OK

Vbatt: Great.

Sonics 2m: OK

Sonics profile: OK

Krytons: Good.

H2O-kh2o: OK

Tv and P:  OK.

Scalar variance: for 2m tc'tc' plot tower and sage show a bit more
scalar variance than lake during the daytime (1.0-1.5 deg).

Fluxes at 2m: tower and sage also show slightly more flux than at lake,
although difference is not as great (~.2)

Flux profiles: OK

CO2:  OK

TRH:OK

Long Wave Rad:. rlw.out.grease.stn0 measurements are lower than other
sensors by between 10-40 W/m2.

|Tdome-Tcase| : .OK

Tsoil:  . Tsoil.2.5cm.a.sage still looks like it may be exposed to
air.  Im just ignoring this, since we should have adequate Tsoil
sampling.  All Tsoil tower(grass) have a bit nit of noise from the
radiometer fans, but this is small enough that I'm ignoring it too.

Qsoil:  Qsoil.c.10cm lake sensor still down.  It might also be a cable
cut (like the Gsoil.10.cm.a problem found at lake), but will require
more digging up of snow to check.  Currently, I'm ignoring this as well
since there is probably enough redundancy in the Qsoil measurements.

Gsoil: Gsoila.10cm.lake(3) began to drift off on it's own at ~2100 MST
Jan 19.  It kept decreasing until 0700-0800 MST on the 20th when it
slowly began to rise again.  By noon it was back in line with the other
sensors.
Gsoil.c.10cm.sage still bad, the cable was probably cut.  Needs
to be fixed.
Gsoilc.10cm.lake still on the fritz.

Soil Thermal Properties:  Are looking better.  Steve has been keeping a
close eye on the data and the sensors appear to working properly, and
are giving us some good data.

u,v spectra, stn 1-3:   There appears to be some white noise at the
lower frequencies (.001 Hz).

w,tc spectra, stn 1-3:  OK

u,v spectra tower:  No plots as of 4:25 pm

w,tc spectra tower: No plots as of 4:25 pm

kryton spectra:  No plots as of 4:25 pm
161: Status, Site all stns, Wed 19-Feb-2003 15:00:00 MST, Daily status, Feb 19
Weather Plots:  OK

Rain Gauge: OK

Vbatt: Great.

Sonics 2m: OK

Sonics profile: OK

Krytons: Good. Some diurnal variation with four of the sensors.

H2O-kh2o: OK

Tv and P:  OK.

Scalar variance: OK

Fluxes at 2m: OK

Flux profiles: OK

CO2:  At 1200 MST CO2 jumped from ~234 ppmV to ~246 ppmV

TRH:OK

Long Wave Rad:. rlw.out.grease.stn0 measurements are lower than other
sensors by about 20 W/m2.

|Tdome-Tcase| : .OK

Tsoil:  . Tsoil.2.5cm.a.sage still looks like it may be exposed to
air.  Im just ignoring this, since we should have adequate Tsoil
sampling.  All Tsoil tower(grass) have a bit nit of noise from the
radiometer fans, but this is small enough that I'm ignoring it too.

Qsoil:  Qsoil.c.10cm lake sensor still down.  It might also be a cable
cut (like the Gsoil.10.cm.a problem found at lake), but will require
more digging up of snow to check.  Currently, I'm ignoring this as well
since there is probably enough redundancy in the Qsoil measurements.

Gsoil: Gsoil.c.10cm.sage still bad, the cable was probably cut.  Needs
to be fixed.
Gsoilc.10cm.lake still on the fritz.

Soil Thermal Properties:  Are looking better.  Steve has been keeping a
close eye on the data and the sensors appear to working properly, and
are giving us some good data.

u,v spectra, stn 1-3:   There appears to be some white noise at the
lower frequencies (.001 Hz).

w,tc spectra, stn 1-3:  OK

u,v spectra tower:  OK

w,tc spectra tower: OK

kryton spectra:  kh2o.10m and kh2o.2m sort of trail off on their own
between 00:00-00:30
159: Soil, Site all stns, Sat 22-Feb-2003 17:12:02 MST, 10V regulators added
From 1300-1400 added regulators to the switched 12V signals from the CR10s at
all 3 sites (grass, then sage, then lake).  I'm not sure about some of the
electrical contacts -- the daily plots show that I did make a change --
hopefully, it was for the good!
155: Weather, Site all stns, Fri 21-Feb-2003 08:13:55 MST, Weather conditions
A light snow occured in the early morning.
By daybreak there were only scattered clouds.
A good opportunity to check the functioning of the frost detector.
145: Kryptons, Site all stns, Wed 19-Feb-2003 12:07:08 MST, Kr cleaned
On 19 Feb .Between 11:00 and 11:30 all the tower Kr's were cleaned, starting
at the lowest and working to the uupermost.
Yesyerday, 18 Feb the Kr's at the outlying sites were all cleaned during the
radiometer cleaning visits, see logbook # 140
140: Radiometers, Site all stns, Tue 18-Feb-2003 16:51:56 MST, Radiometer cleaning
Made a tour of the radiometers and cleaned domes and inspected sites.In no case
was there any dirt apparent on cleaning tissue.

14:04 Grass: 10% snow cover only a few cm deep over flat laying long grass
Downlooking LW and SW have housing but no fans
Up looking LW and SW have housings and fans. LW.in fan stopped. I spun it and
it started up.

15:00 Sage: Helped Jielun et al locate TC system
           50% snow cover, patches 6-8 cm deep between and among the sage.
Both incoming SW and LW housings and fan operating
Outgoing SW housing, no fan, outgoing LW no housing
All domes cleaned,
Net rad still level
Cleaned Kr, psych fan operating

15:30 Lake 90% snow cover around site.
SW.in fan operating, SW.out housing no fan, LW.out no housing
cleaned all domes, cleaned Kr, psych fan operating

15:40 Scaffold: 50% snow in dappled patches.
4m LW.in fan operating, LW.out no housing
1m LW.out no housing
Cleaned all domes

15:45 Grass (again) SW.in and LW.in fans operating
Only housings, no fan for SW.out and LW.out
Cleaned all domes

15:50 Greasewood: Snow drift 30 -50 cm deep under radiometer
LW.out has no housing.
Cleaned dome without breaking up the snow.
138: Status, Site all stns, Thu 06-Feb-2003 15:04:38 MST, Daily status, Feb 5
Weather Plots: OK

Rain Gauge: OK

Vbatt: OK

Sonics 2m: OK

Sonics profile: Ok, but w.10m.stn0 dropped out of sync with other sensors between 1600 on Feb 5 and 0200 on Feb 6 (down to ~0.5).

Krytons: OK, diurnal variation for all sensors.

H2O-kh2o: OK

Tv and P:  OK.

Scalar variance 2m: OK

Fluxes at 2m: OK.

Flux profiles: OK

CO2: Sensor was reset OK

TRH: OK

Long Wave Rad:. OK.

|Tdome-Tcase| : .OK.

Tsoil:  . OK

Tsoil.2.5cm.a.sage still looks like it may be exposed to
air.  Im just ignoring this, since we should have adequate Tsoil
sampling.  All Tsoil tower(grass) have a bit nit of noise from the
radiometer fans, but this is small enough that I'm ignoring it too.

Qsoil:  Qsoil.c.10cm lake is still not working properly and is showing quite a bit of variation.

Gsoil: Gsoil.c.10cm.sage and Gsoil.c.1m lake are both still down (see earlier entries).

Soil Thermal Properties:  Starting to look a little better.

U,V spectra stns 1-3: OK.

w,tc spectra stns 1-3: OK

U,V spectra, tower: small amount of white noise in higher frequencies (10+)

w,tc spectra, tower: OK


Kryton Spectra:  The power plots have some white noise at higher frequencies but all in all the signals follow the 2/3 line fairly well.


CO2 spectra: quite a bit of white noise in the power plot.
137: Status, Site all stns, Wed 05-Feb-2003 13:33:55 MST, Daily status, Feb 5
Weather Plots: OK

Rain Gauge: OK

Vbatt: OK

Sonics 2m: OK

Sonics profile: OK

Krytons: OK, diurnal variation for all sensors.

H2O-kh2o: OK

Tv and P:  OK.

Scalar variance 2m: kh2o'kh2o'.2m sensor at tower went off the charts at ~0700 and came back around 0900 MST

Fluxes at 2m: OK.

Flux profiles: OK

CO2: Sensor was reset (see earlier log entry).  Appears to be working fine.

TRH: OK

Long Wave Rad:. OK.

|Tdome-Tcase| : .OK.

Tsoil:  . OK

Tsoil.2.5cm.a.sage still looks like it may be exposed to
air.  Im just ignoring this, since we should have adequate Tsoil
sampling.  All Tsoil tower(grass) have a bit nit of noise from the
radiometer fans, but this is small enough that I'm ignoring it too.

Qsoil:  Qsoil.c.10cm lake is still not working properly and is showing quite a bit of variation. Qsoil.c.5cm lake(3) appears to be fine.

Gsoil: Gsoil.c.10cm.sage and Gsoil.c.1m lake are both still down (see earlier entries).

Soil Thermal Properties:  Starting to look a little better.

UW spectra: 10.00 f(Hz) between 0000-0030 does not look right, way too low.

Kryton Spectra:  The power plots have some white noise at the higher end of the spectra but the lower frequencies follow the 2/3 line fairly well.

2m sonic spectra: OK

Tower sonic spectra:OK

CO2 spectra: quite a bit of white noise in the power plot.
135: Status, Site all stns, Tue 04-Feb-2003 14:39:47 MST, Daily status, Feb 4
Weather Plots: OK

Rain Gauge: OK

Vbatt: OK

Sonics 2m: OK

Sonics profile: OK

Krytons: OK

H2O-kh2o: OK

Tv and P:  OK.

Scalar variance: OK

Fluxes at 2m: OK. Lake w'tc'.2m has not been following the general pattern during the day as tower and sage do. Instead of increasing, it basically stays within the same range while the others increase. Gordon believes it is because the lake bed is absorbing more heat than the other sights.

Flux profiles: OK

CO2: Sensor was reset (see earlier log entry).  Appears to be working fine.

TRH: OK

Long Wave Rad:. OK.

|Tdome-Tcase| : .OK.

Tsoil:  . Ok. Tsoil.b.2.5.cm sage had a little bleep (~1 deg) between 1300-1500 MST Feb 2.

Tsoil.2.5cm.a.sage still looks like it may be exposed to
air.  Im just ignoring this, since we should have adequate Tsoil
sampling.  All Tsoil tower(grass) have a bit nit of noise from the
radiometer fans, but this is small enough that I'm ignoring it too.

Qsoil:  Qsoil.c.10cm lake is still not working properly and is showing quite a bit of variation. Qsoil.c.5cm lake(3) appears to be fine.

Gsoil: Gsoil.c.10cm.sage and Gsoil.c.1m lake are both still down (see earlier entries).

Soil Thermal Properties:  Starting to look a little better.

Kryton Spectra:  The power plots have some white noise at the higher end of the spectra but the lower frequencies follow the 2/3 line fairly well.

2m sonic spectra: OK

Tower sonic spectra:OK

CO2 spectra: quite a bit of white noise in the power plot.
134: Status, Site all stns, Mon 03-Feb-2003 13:46:41 MST, Daily status, Feb 3
Weather Plots: OK

Rain Gauge: OK

Vbatt: OK

Sonics 2m: OK

Sonics profile: w.15m moved in line with other sensors at ~1400 MST Feb 2, and still looks good.


Krytons: Show increased moisture between 0600-0900 MST at all levels ranging between 2-12 g/m^3.

H2O-kh2o: OK

Tv and P:  OK.

Scalar variance: OK

Fluxes at 2m: Lake w'tc'.2m has not been following the general pattern during the day as tower and sage do. Instead of increasing, it basically stays within the same range while the others increase?

Flux profiles: OK

CO2: Sensor was reset (see earlier log entry).  Appears to be working fine.

TRH: OK, difference between 1m sensor and others is not noticable today (wasn't really over the weekend either).

Long Wave Rad:. Rlw.out.grease stn0 is lower than other sensors (during daylight) by ~5-10 W/m^2.

|Tdome-Tcase| : .OK.

Tsoil:  . Ok. Tsoil.b.2.5.cm sage had a little bleep (~1 deg) between 1300-1500 MST Feb 2.

Tsoil.2.5cm.a.sage still looks like it may be exposed to
air.  Im just ignoring this, since we should have adequate Tsoil
sampling.  All Tsoil tower(grass) have a bit nit of noise from the
radiometer fans, but this is small enough that I'm ignoring it too.

Qsoil:  Qsoil.c.10cm lake is doing some crazy stuff.  It came back up at ~1300 on Jan 31, and shows quite a bit of variation over the last two days. At about that same time, Qsoil.c.5cm lake(3) began behaving badly.  It climbed from ~8 %vol to ~32 %vol and over the last 3 days it has slowly come back down.  It looks like it came back into line around 0600 MST today.

Gsoil: Gsoil.c.10cm.sage and Gsoil.c.1m lake are both still down (see earlier entry).

Soil Thermal Properties:  All of these signals look bad, despite fixing
the wiring problem at the tower (grass).  It could take a while to get
good data from these, since there was a small air gap around the probes
after installation; however, the data look even worse.  In particular,
each "event" on Vheat should look like a square wave toggling between 0
and 1 V.  The "Vpile" signal at tower looks close to the signal expected
for Vheat, but at the wrong amplitude.
132: Status, Site all stns, Fri 31-Jan-2003 14:35:56 MST, Daily status, Jan 31
Weather Plots: OK

Rain Gauge: OK

Vbatt: OK

Sonics 2m: OK

Sonics profile: w.15m still reading lower than other sensors  It was checked with a level (see earlier log entry) but apparently that wasn't the problem.


Krytons: OK

H2O-kh2o: OK

Tv and P:  OK.

Scalar variance: OK

Fluxes at 2m: OK

Flux profiles: OK

CO2: Sensor crashed after 1130 MST Jan 28, don't know the cause.

TRH: Still concerned about the 1m sensor.  It is warmer and drier, as it should be, but lacks the same characterstics the other profiles have.

Long Wave Rad:. Rlw.out.grease stn0 is lower than other sensors (during daylight) by ~5-10 W/m^2.

|Tdome-Tcase| : .OK.

Tsoil:  . Ok. Tsoil.2.5cm.a.sage still looks like it may be exposed to
air.  Im just ignoring this, since we should have adequate Tsoil
sampling.  All Tsoil tower(grass) have a bit nit of noise from the
radiometer fans, but this is small enough that I'm ignoring it too.

Qsoil: 4 or the 6 Qsoilc.sensors from tower all (with the exception of the 5m sensor)increase to ~15-20 around 1500 MST. This may be a result of melting snow? Iwill keep and eye on it.
Qsoil.c.10cm lake is still both down.

Gsoil: Gsoil.c.10cm.sage and Gsoil.c.1m lake are both still down (see earlier entry).

Soil Thermal Properties:  All of these signals look bad, despite fixing
the wiring problem at the tower (grass).  It could take a while to get
good data from these, since there was a small air gap around the probes
after installation; however, the data look even worse.  In particular,
each "event" on Vheat should look like a square wave toggling between 0
and 1 V.  The "Vpile" signal at tower looks close to the signal expected
for Vheat, but at the wrong amplitude.
131: Status, Site all stns, Thu 30-Jan-2003 13:57:13 MST, Daily status, Jan 30
Weather Plots: OK

Rain Gauge: OK

Vbatt: OK

Sonics 2m: OK

Sonics profile: w.15m still reading lower than other sensors  It was checked with a level (see earlier log entry) but apparently that wasn't the problem.


Krytons: OK

H2O-kh2o: OK

Tv and P:  OK.

Scalar variance: OK

Fluxes at 2m: OK

Flux profiles: OK

CO2: Sensor crashed after 1130 MST Jan 28, don't know the cause.

TRH: OK

Long Wave Rad:. Rlw.out.grease stn0 is lower than other sensors by ~5-10 W/m^2.

|Tdome-Tcase| : .OK.

Tsoil:  . Ok. Tsiol.2.5cm.a.sage still looks like it may be exposed to
air.  Im just ignoring this, since we should have adequate Tsoil
sampling.  All Tsoil tower(grass) have a bit nit of noise from the
radiometer fans, but this is small enough that I'm ignoring it too.

Qsoil: Qsoilc.1m sage rose to about 13% and slowly dropped, over the last day, down to ~5% (still a little higher than other sensors). Will keep and eye on.
Qsoil.c.10cm lake is still both down.

Gsoil: Gsoil.c.10cm.sage and Gsoil.c.1m lake are both still down (see earlier entry).

Soil Thermal Properties:  All of these signals look bad, despite fixing
the wiring problem at the tower (grass).  It could take a while to get
good data from these, since there was a small air gap around the probes
after installation; however, the data look even worse.  In particular,
each "event" on Vheat should look like a square wave toggling between 0
and 1 V.  The "Vpile" signal at tower looks close to the signal expected
for Vheat, but at the wrong amplitude.
130: Status, Site all stns, Thu 30-Jan-2003 09:38:12 MST, Daily status, Jan 29
Weather Plots: OK

Rain Gauge: OK

Vbatt: OK

Sonics 2m: OK

Sonics profile: w.15m still reading lower than other sensors  It was checked with a level (see earlier log entry) but apparently that wasn't the problem.


Krytons: Ok, no large diurnal variation. There were a couple of spikes (~8-14 g/m^3).

H2O-kh2o: OK

Tv and P:  OK.

Scalar variance: OK

Fluxes at 2m: OK

Flux profiles: OK

CO2: Sensor crashed after 1130 MST Jan 28, don't know the cause.

TRH: OK

Long Wave Rad:. Rlw.out.grease stn0 is lower than other sensors by ~5-10 W/m^2.

|Tdome-Tcase| : .OK.

Tsoil:  . Ok. Tsiol.2.5cm.a.sage still looks like it may be exposed to
air.  Im just ignoring this, since we should have adequate Tsoil
sampling.  All Tsoil tower(grass) have a bit nit of noise from the
radiometer fans, but this is small enough that I'm ignoring it too.

Qsoil: Qsoilc.1m sage is acting up.
Qsoil.c.10cm lake sensor still down.  It might also be a cable
cut (like the Gsoil.10.cm.a problem found at lake), but will require
more digging up of snow to check.  Currently, I'm ignoring this as well
since there is probably enough redundancy in the Qsoil measurements.

Gsoil: Gsoil.c.10cm.sage became bad as Tony and Steve were working at
sage on 12/18.  The cable was cut and needs to be fixed.

Soil Thermal Properties:  All of these signals look bad, despite fixing
the wiring problem at the tower (grass).  It could take a while to get
good data from these, since there was a small air gap around the probes
after installation; however, the data look even worse.  In particular,
each "event" on Vheat should look like a square wave toggling between 0
and 1 V.  The "Vpile" signal at tower looks close to the signal expected
for Vheat, but at the wrong amplitude.
129: Status, Site all stns, Thu 30-Jan-2003 08:37:51 MST, Daily status, Jan 28
Weather Plots:  There is a small gap in the P, MR, 1.2m, spd, and dir
data from the tower at 1000 MST this morning, it was back up shortly
after.

Rain Gauge: OK

Vbatt: Great. Only down to 13.0 over night.

Sonics 2m: OK

Sonics profile: w.15m still reading lower that other sensors prior to
1000 MST when data gap took place.  Seems to have come in line with
others, may be fixed now.

Krytons: No large diurnal variation but there are some very interesting
spikes in the data.  The first was between 1600-1800 MST Jan 27 where
the 2m, 10m, 20m, and 30m sensors briefly rose to ~5-~8 g/m3.  The
larger of the two happened between 1000-1200 MST Jan 28 when all sensors
shot up (as much as 20 g/m3) and dropped back down (I think) after 1200
MST.

H2O-kh2o: This plot looks bad at times mentioned above in the Kryptons
section.  H2O-kh2o.20m.stn0 is still lower than other sensors by ~-1.0
g/m3.

Tv and P:  OK.

Scalar variance: show large increases corresponding to changes with
krytons, water vapor etc, at ~1600 MST Jan 27, and ~ 1100 MST Jan 28.

Fluxes at 2m: ""

Flux profiles: ""

TRH: RH at sage is a little higher that at lake (~2%) , but there
doesn't appear to be much difference in the temperatures.

Long Wave Rad:. Rlw.in.b.25m and Rlw.out.a.25m are up and running
again.  There were some glitches yesterday, I assume while it was being
worked on, but is looking
good now.

|Tdome-Tcase| : .in.a.26m stn and .in.b.25m stn0 were both off for a
while but began working again around 1600 MST Jan 27.  out.a.25m stn0
was acting up, reading higher than others, but appears to be corrected.

Tsoil:  . Ok. Tsiol.2.5cm.a.sage still looks like it may be exposed to
air.  Im just ignoring this, since we should have adequate Tsoil
sampling.  All Tsoil tower(grass) have a bit nit of noise from the
radiometer fans, but this is small enough that I'm ignoring it too.

Qsoil:  Qsoil.c.10cm lake sensor still down.  It might also be a cable
cut (like the Gsoil.10.cm.a problem found at lake), but will require
more digging up of snow to check.  Currently, I'm ignoring this as well
since there is probably enough redundancy in the Qsoil measurements.

Gsoil: Gsoil.c.10cm.sage became bad as Tony and Steve were working at
sage on 12/18.  The cable was probably cut.  Needs to be fixed.

Soil Thermal Properties:  All of these signals look bad, despite fixing
the wiring problem at the tower (grass).  It could take a while to get
good data from these, since there was a small air gap around the probes
after installation; however, the data look even worse.  In particular,
each "event" on Vheat should look like a square wave toggling between 0
and 1 V.  The "Vpile" signal at tower looks close to the signal expected
for Vheat, but at the wrong amplitude.
125: Radiometers, Site all stns, Tue 28-Jan-2003 14:57:32 MST, Radiometers Cleaned
7/27/03 25m radiometers cleaned.
7/28/03 All other radiometers cleaned with dry wipe.
Checked inside plenum at Sage and there was no snow packed
inside.  All domes looked very good although we did get
some snow showers this morning which left some moisture on
them.
I noticed something like a smudge inside the psp at Lake
on the small dome.  I don't know if that's a factor.
124: Kryptons, Site all stns, Tue 28-Jan-2003 14:54:04 MST, Kryptons cleaned
7/28/03 cleaned Sage, Lake
7/27/03 cleaned tower sensors.
Used alcohol with q-tip

NOTE: today SteveS mentioned kh2oV actually dropped on
20m unit after we cleaned it.   We examined it and it
was OK.  Re-cleaned with just a dry q-tip and after
looking at cockpit, it appears probably the best now.
I think the alcohol is a poor substitute for distilled
because it may leave a residue esp. if something comes
off the seal and/or qtip.  Plane dry q-tip is better imho.
122: Status, Site all stns, Mon 27-Jan-2003 21:17:58 MST, Jan 27 work: 25m rad. installed/fixed, t.10m, calgas note, guys
1/27/03

TRH.10m fan replaced.  Yes the other one was dead.
TRH.1m bell inlet partially broken (~40%).  This happened
       at the 10m but we decided to move the broken one down
       below where the wind is less.   On 1/28/03 we installed
       one of the unpainted metal bell inlets on this sensor
       to replace the broken bell.

25m Rad/Logger
    Removed logger. Replaced AM416: out=13529, in=13532.
    Wiring was apparently a problem in that:
    1. pyg.in.1 Amp pin-5 to 3-L1 was not seated in the shell
       so we pulled it out to make contact w/cable.
    2. pyg.out.2 Amp wires 7,4 to 6-H2,L2 not connected.
       so we connected them.
    3. CR10 4-H1/L1,H2/L2 were connected to Pyg.in.2
       CR10 5-H1/L1,H2/L2 were connected to Pyg.out.1
       These were apparently reversed per logger pgm
       so we swapped t  122           Status  Updated:28-Jan-2003 15:15  Jan 27 work  hem to
          CR10-4H1/L1 to pins 1,5 pyg.out.1
          CR10-4H2/L2 to pins 7,4 pyg.out.1
          CR10-5H1/L1 to pins 1,5 pyg.in.2
          CR10-5H2/L2 to pins 7,4 pyg.in.2

    Checked s/n of sensors:
          pyg.in.1  = 31975, south-side
          pyg.in.2  = 31979, north-side (just installed today)
          pyg.out.1 = 31974, south-side (just installed today)
          pyg.out.2 = 31977, north-side
    We verified that the cables from the sensors to the logger
    were consistent with the naming conventions.
    We then checked the 'pile' values on cockpit versus putting
    a hand over the sensors: all-4 names was consistent/correct.
    Cleaned domes.
    Per bullet Level check, the electronic sensor bias shows:
          y=-.039
          x=-.100

CalGas: Tony wanted to know what cylinders are here.  They need
        to be identifie  122           Status  Updated:28-Jan-2003 15:15  Jan 27 work  d with a visual marking such as colored
        tape bands to make this obvious !!!

        Hical Spare = 57677
        Hical ON    = IHOP site 8/3 (number was underneath
                      1580psi at 10psi setting
        Local Spare = LK438863
        Local ON    = LK387670
                      950psi, at 14psi setting

Kryptons:
        All tower kryptons cleaned.


Tower: all welds inspected looked OK
Tensioned upper Guy Wires 1-turn each.

         NE     SE       NW      SW
Top     550     500     520      600
4       510     600     610      580
3       430     520     570      500
2       425     580     500      470
Bottom  450     520     440      540


Base: swapped disk
      Added mouse bait
      Retrieved krypton 1101


Cosmos:
      cooler was not running, temp when we checked it was ~24
      We did not get back to trying the heat gun yet.
      The lid insul was left intact for the moment.
121: Status, Site all stns, Mon 27-Jan-2003 15:17:42 MST, Daily status Jan 27
Weather plots:OK

Rain: OK.

Pam power: Is doing excellent, it dropped to just below 13.0 over night.

Sonics 2m:  OK

Sonic profiles: Good. w.15m stn0 still seems to be measuring a tad bit lower than other instruments (~.2 m/s). Position of sensor may be off a little. It will be checked with a level on next visit.

Krytons: No diurnal variation for any of the sensors. kh2o.20m stn0 is reading higher than other sensors by ~.5 g/m^3

H2O-kh2o: HsO-kh2o.2m stn0 is measuring between -.6 and -.9 while other sensors read between -.1 and .4.

Tv and P: pressure sensor data at tower reading higher than sage...will be fixed in post processing.

2m Sonic QC and profile: OK

Sonic variance (2m / profile): OK

Scalar variance 2m: OK

Scalar variance: OK


Fluxes at 2m:  OK

Flux profiles: OK

CO2: OK

CO2 Moments: OK

TRH 2m difference: OK

TRH difference profile: RH profile of sensor at 1m is reading drier, by about 5%, than the other sensors.  John and Tony seem to believe this may be real.

Short wave radiation: OK .

Long Wave Radiation: OK.

|Tdome-Tcase|: OK.

Tsoil:  OK. Tsoil.2.5cm.a.sage still looks like it may be exposed to
air.
I'm just ignoring this, since we should have adequate Tsoil sampling.

Qsoil:  Qsoil.c.10cm lake sensor still down.  It might also a cable cut
(like the Gsoil.10cm.a problem found at lake), but will require more
digging
up snow to check.  Currently, I'm ignoring this as well since there
probably
is enough redundancy in the Qsoil measurements.

Gsoil: Gsoil.c.10cm sage became bad as Tony and Steve were working at sage
on
12/18.  Problem was not fixed because ground was frozen. Ignore for now.Gsoil.10cm lake has been removed...I think?
Gsoila.10cm tower took a large dip just after 0100 MST from ~0 to -100 W/m^2.


Soil Thermal properties: All of these signals look bad, despite "fixing"

the
wiring problem at tower (grass).  I've expected that it will take a
while to
get good data from these, since there was a small air gap around the
probes
after installation; however, the data look even worse.  In particular,
each
"event" on Vheat should look like a square wave toggling between 0 and 1.

Wind direction profile: OK, though there probably are biases of 1-2
degrees
(despite aligning the booms by eye up and down the tower and shooting
boom
angles that were mostly the same).  We'll need to check these angles
again.

T profile (5 min ave): 10m sensor has been acting up, and reading warmer than others lately.  It will be checked.


  Kate Beierle
  Associate Scientist I
  NCAR/ATD
  Research Technology Facilit
120: Status, Site all stns, Fri 24-Jan-2003 14:20:52 MST, Daily status Jan 24
Weather plots:OK

Rain: OK.

Pam power: OK

Sonics 2m:  OK

Sonic profiles: Good. w.15m stn0 still seems to be measuring a tad bit lower than other instruments (~.2 m/s). Position of sensor may be off a little. It will be checked with a level on next visit.

Krytons: OK. Diurnal variation is back, for all sensors.  Went wacky between 1900 on Jan 23 and 0100 Jan 24.

H2O-kh2o:  OK

Tv and P: pressure sensor data at tower reading higher than sage...will be fixed in post processing.

2m Sonic QC and profile: OK

Sonic variance (2m / profile): OK

Scalar variance 2m: all kh20'kh2o'.2m sensors spike to ~3-4 between 1800-0000 MST.

Scalar variance: kh20'kh2o'.2m sensors spike to 4 (or greater) between 1800-0000 MST.


Fluxes at 2m:  OK

Flux profiles: OK

CO2: OK

CO2 Moments: OK

TRH 2m difference: OK

TRH difference profile: 10m Temp and RH were off between 0900 and 1400 MST. Temp measurements were coming in ~2-5 deg above other sensors and the RH was reading a maximum of 15% more moist.

Short wave radiation: OK .

Long Wave Radiation: OK.

|Tdome-Tcase|: OK.

Tsoil:  OK. Tsoil.2.5cm.a.sage still looks like it may be exposed to
air.
I'm just ignoring this, since we should have adequate Tsoil sampling.

Qsoil:  Qsoil.c.10cm lake sensor still down.  It might also a cable cut
(like the Gsoil.10cm.a problem found at lake), but will require more
digging
up snow to check.  Currently, I'm ignoring this as well since there
probably
is enough redundancy in the Qsoil measurements.

Gsoil: Gsoil.c.10cm sage became bad as Tony and I were working at sage
on
12/18.  Problem was not fixed because ground was frozen. Ignore for now.


Soil Thermal properties: All of these signals look bad, despite "fixing"

the
wiring problem at tower (grass).  I've expected that it will take a
while to
get good data from these, since there was a small air gap around the
probes
after installation; however, the data look even worse.  In particular,
each
"event" on Vheat should look like a square wave toggling between 0 and 1.

Wind direction profile: OK, though there probably are biases of 1-2
degrees
(despite aligning the booms by eye up and down the tower and shooting
boom
angles that were mostly the same).  We'll need to check these angles
again.

T profile (5 min ave): 10m sensor has been acting up, and reading warmer than others lately.  It will be checked on next visit (Mon. Jan 27).


  Kate Beierle
  Associate Scientist I
  NCAR/ATD
  Research Technology Facilit
119: Status, Site all stns, Thu 23-Jan-2003 13:49:35 MST, Daily status Jan 23
Weather plots:OK

Rain: OK.

Pam power: OK

Sonics 2m:  OK

Sonic profiles: Good. w.15m stn0 still seems to be measuring a tad bit lower than other instruments (~.2 m/s). Position of sensor may be off a little. It will be checked with a level on next visit.

Krytons: OK

H2O-kh2o:  OK

Tv and P: pressure sensor data at tower reading higher than sage...will be fixed in post processing.

2m Sonic QC and profile: OK

Sonic variance (2m / profile): OK

Scalar variance 2m:  OK

Scalar variance: OK

Fluxes at 2m:  was more activity than normal at sage on Jan 22 between 0700 and 1500 MST. w'tc'2m increased to .1, values are generally around ~-.1-.05

Flux profiles: OK

CO2: OK

CO2 Moments: OK

TRH 2m difference: sage is higher by a degree between 0900 and 1500 MST on Jan 22. (this difference is also shown in the fluxes at 2m)

TRH profile difference:1m RH is reading a bit more moist than 2m by about 5%. John and Tony agree that this looks reasonable.

Short wave radiation: OK .

Long Wave Radiation: OK.

|Tdome-Tcase|: OK.

Tsoil:  OK. Tsoil.2.5cm.a.sage still looks like it may be exposed to
air.
I'm just ignoring this, since we should have adequate Tsoil sampling.

Qsoil:  Qsoil.c.10cm lake sensor still down.  It might also a cable cut
(like the Gsoil.10cm.a problem found at lake), but will require more
digging
up snow to check.  Currently, I'm ignoring this as well since there
probably
is enough redundancy in the Qsoil measurements.

Gsoil: Gsoil.c.10cm sage became bad as Tony and I were working at sage
on
12/18.  Problem was not fixed because ground was frozen. Ignore for now.


Soil Thermal properties: All of these signals look bad, despite "fixing"

the
wiring problem at tower (grass).  I've expected that it will take a
while to
get good data from these, since there was a small air gap around the
probes
after installation; however, the data look even worse.  In particular,
each
"event" on Vheat should look like a square wave toggling between 0 and 1.

Wind direction profile: OK, though there probably are biases of 1-2
degrees
(despite aligning the booms by eye up and down the tower and shooting
boom
angles that were mostly the same).  We'll need to check these angles
again.

T profile (5 min ave): 10m sensor has been acting up, and reading warmer than others lately.  It will be checked on next visit (Mon. Jan 27.


  Kate Beierle
  Associate Scientist I
  NCAR/ATD
  Research Technology Facilit
118: Soil, Site all stns, Wed 22-Jan-2003 15:39:36 MST, Soil sensor configuration
- Previous -
Next -
Index
| Graphic: | 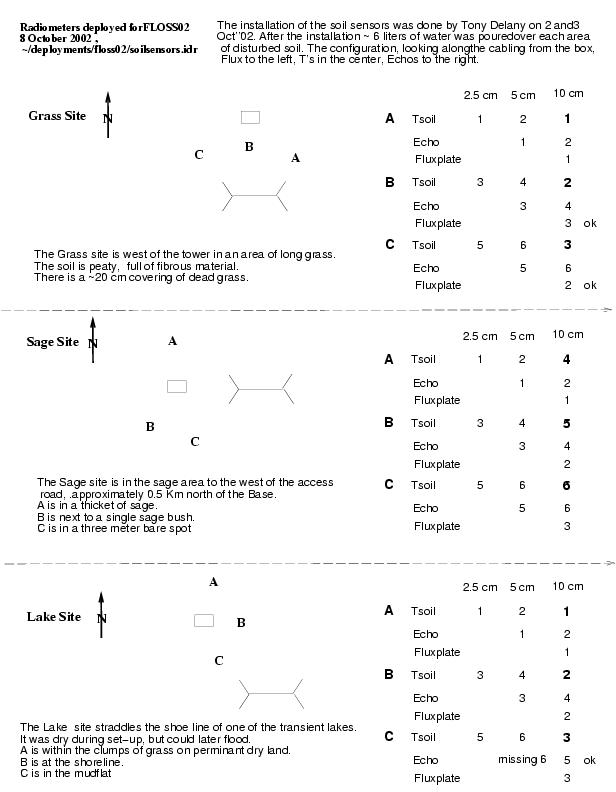
To view the configuration of the soil sensors at Grass, Sage and Lake:

Hit "Graphics Viewer", and then the little diamond.
- 117: Status, Site all stns, Wed 22-Jan-2003 15:31:46 MST, Daily status Jan 22
Weather plots:OK

Rain: No data shown in first plot.

Pam power: OK

Sonics 2m:  OK

Sonic profiles: Good. w.15m stn0 still seems to be measuring a tad bit lower than other instruments (~.2 m/s). Position of sensor may be off a little. It will be checked with a level on next visit.

Krytons: OK

H2O-kh2o:  OK

Tv and P: pressure sensor data at tower reading higher than sage...will be fixed in post processing.

2m Sonic QC and profile: OK

Sonic variance (2m / profile): OK

Scalar variance 2m:  OK

Scalar variance: OK

Fluxes at 2m:  OK

Flux profiles: OK

CO2: OK

CO2 Moments: OK

TRH 2m difference: OK

TRH profile difference:1m RH is reading a bit more moist than 2m by about 5%. John and Tony agree that this looks reasonable.

Short wave radiation: OK .

Long Wave Radiation: OK.

|Tdome-Tcase|: OK.

Tsoil:  OK. Tsoil.2.5cm.a.sage still looks like it may be exposed to
air.
I'm just ignoring this, since we should have adequate Tsoil sampling.

Qsoil:  Qsoil.c.10cm lake sensor still down.  It might also a cable cut
(like the Gsoil.10cm.a problem found at lake), but will require more
digging
up snow to check.  Currently, I'm ignoring this as well since there
probably
is enough redundancy in the Qsoil measurements.

Gsoil: Gsoil.c.10cm sage became bad as Tony and I were working at sage
on
12/18.  Problem was not fixed because ground was frozen. Ignore for now.


Soil Thermal properties: All of these signals look bad, despite "fixing"

the
wiring problem at tower (grass).  I've expected that it will take a
while to
get good data from these, since there was a small air gap around the
probes
after installation; however, the data look even worse.  In particular,
each
"event" on Vheat should look like a square wave toggling between 0 and 1.

Wind direction profile: OK, though there probably are biases of 1-2
degrees
(despite aligning the booms by eye up and down the tower and shooting
boom
angles that were mostly the same).  We'll need to check these angles
again.


  Kate Beierle
  Associate Scientist I
  NCAR/ATD
  Research Technology Facilit
- 116: Soil, Site all stns, Wed 22-Jan-2003 12:57:12 MST, TP01 wiring
- Previous -
Next -
Index
| Graphic: | 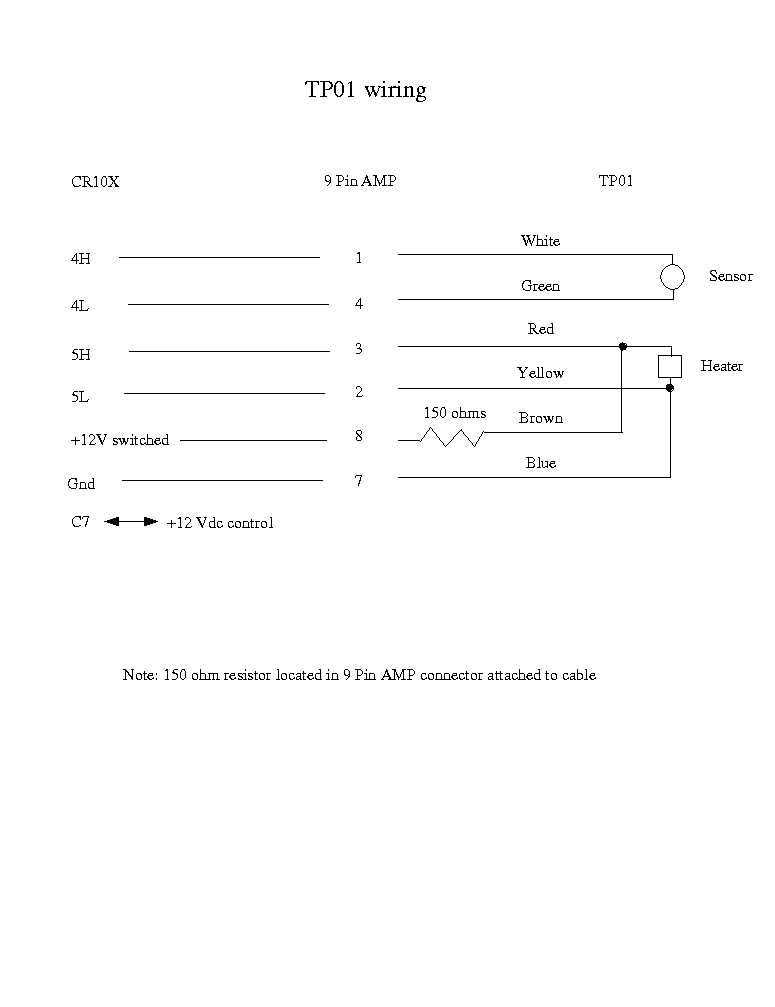
The graphics file shows the wiring ofr the TP01 probe. The color code
for the wires corrresponds to the probe wires and NOT the wires in the
logger box.
- 115: Status, Site all stns, Tue 21-Jan-2003 14:50:59 MST, Daily status Jan 21
Weather plots:OK

Rain: OK

Pam power: OK

Sonics 2m:  OK

Sonic profiles: Good. w.15m stn0 seems to be measuring a tad bit lower than other instruments (~.2 m/s).

Krytons: OK

H2O-kh2o:  OK

Tv and P: pressure sensor data at tower reading higher than sage and lake by about a millibar.

2m Sonic QC and profile: OK

Sonic variance (2m / profile): OK

Scalar variance 2m:  OK

Scalar variance: OK

Fluxes at 2m:  OK

Flux profiles: OK

CO2: OK

CO2 Moments: OK

TRH 2m difference: OK

TRH profile difference:OK

Short wave radiation: OK.

Long Wave Radiation: OK.

|Tdome-Tcase|: OK.

Tsoil:  OK. Tsoil.2.5cm.a.sage still looks like it may be exposed to
air.
I'm just ignoring this, since we should have adequate Tsoil sampling.

Qsoil:  Qsoil.c.10cm lake sensor still down.  It might also a cable cut
(like the Gsoil.10cm.a problem found at lake), but will require more
digging
up snow to check.  Currently, I'm ignoring this as well since there
probably
is enough redundancy in the Qsoil measurements.

Gsoil: Gsoil.c.10cm sage became bad as Tony and I were working at sage
on
12/18.  Problem was not fixed because ground was frozen. Ignore for now.


Soil Thermal properties: All of these signals look bad, despite "fixing"

the
wiring problem at tower (grass).  I've expected that it will take a
while to
get good data from these, since there was a small air gap around the
probes
after installation; however, the data look even worse.  In particular,
each
"event" on Vheat should look like a square wave toggling between 0 and 1.

Wind direction profile: OK, though there probably are biases of 1-2
degrees
(despite aligning the booms by eye up and down the tower and shooting
boom
angles that were mostly the same).  We'll need to check these angles
again.


  Kate Beierle
  Associate Scientist I
  NCAR/ATD
  Research Technology Facilit
- 114: Status, Site all stns, Fri 17-Jan-2003 14:42:35 MST, Daily status Jan 17
Weather plots:OK

Rain: OK

Pam power: OK

Sonics 2m:  OK

Sonic profiles: OK.

Krytons: OK

H2O-kh2o:  OK

Tv and P: pressure sensor data at tower dropped below sage and lake between 1300 and 1600 Jan 16, then rose again to between 2-4 mb greater than sage and lake.

2m Sonic QC and profile: OK

Sonic variance (2m / profile): OK

Scalar variance 2m:  OK

Scalar variance: OK

Fluxes at 2m:  OK

Flux profiles: OK

CO2: OK

CO2 Moments: OK

TRH 2m difference: OK

TRH profile difference: 10m sensor measurements varied from the others between
0900 MST Jan 16 and 1600 MST Jan 16 by as much as 6 deg C. Rebounded after 1600 and appears fine since.

Short wave radiation: OK.

Long Wave Radiation: OK.

|Tdome-Tcase|: all sensors fall out of sync after 0800 MST, as of 1400 they had not corrected themselves.

Tsoil:  OK. Tsoil.2.5cm.a.sage still looks like it may be exposed to
air.
I'm just ignoring this, since we should have adequate Tsoil sampling.

Qsoil:  Qsoil.c.10cm lake sensor still down.  It might also a cable cut
(like the Gsoil.10cm.a problem found at lake), but will require more
digging
up snow to check.  Currently, I'm ignoring this as well since there
probably
is enough redundancy in the Qsoil measurements.

Gsoil: Gsoil.c.10cm sage became bad as Tony and I were working at sage
on
12/18.  Problem was not fixed because ground was frozen. Ignore for now.


Soil Thermal properties: All of these signals look bad, despite "fixing"

the
wiring problem at tower (grass).  I've expected that it will take a
while to
get good data from these, since there was a small air gap around the
probes
after installation; however, the data look even worse.  In particular,
each
"event" on Vheat should look like a square wave toggling between 0 and 1.

Wind direction profile: OK, though there probably are biases of 1-2
degrees
(despite aligning the booms by eye up and down the tower and shooting
boom
angles that were mostly the same).  We'll need to check these angles
again.

w'kh2o' profiles:  01:00 profiles looks bad, 2 and 10 m sensors read w'kh2o' below -.0005 while the 20m and 30m sensors are ready w'h2o' at about .0005??


  Kate Beierle
  Associate Scientist I
  NCAR/ATD
  Research Technology Facilit
- 113: Status, Site all stns, Thu 16-Jan-2003 15:21:17 MST, Daily status Jan 16
Weather plots:OK

Rain: OK

Pam power: OK

Sonics 2m:  OK

Sonic profiles: OK.

Krytons: kh2o.2m lake(3) spiked to ~7 (g/m^3) and kh2o.20m.stn0 spiked to ~4 at 2400 Jan 15 MST.

H2O-kh2o:  OK

Tv and P: pressure sensor data at tower is still slightly higher then at other sites. (~2-3 mb)  Tbox.cosmos.stn0 is consistently warmer than daisy.


2m Sonic QC and profile: OK

Sonic variance (2m / profile): OK

Scalar variance 2m:  OK

Scalar variance: OK

Fluxes at 2m:  OK

Flux profiles: OK

CO2: OK

CO2 Moments: OK

TRH 2m difference: OK

TRH profile difference: 10m, for both RH and T were measuring about the same as the other sensors until about 1000 MST when the temperature began to increase(RH decreased). It continued to warm to 7 deg (~peaked at 1100) and didn't come back into sync until 1600 MST.

Short wave radiation: OK.

Long Wave Radiation: OK.

|Tdome-Tcase|: Tdome-Tcase.out...all sensors fall out of sync a bit between 0900 and 1700 MST

Tsoil:  OK. Tsoil.2.5cm.a.sage still looks like it may be exposed to
air.
I'm just ignoring this, since we should have adequate Tsoil sampling.

Qsoil:  Qsoil.c.10cm lake sensor still down.  It might also a cable cut
(like the Gsoil.10cm.a problem found at lake), but will require more
digging
up snow to check.  Currently, I'm ignoring this as well since there
probably
is enough redundancy in the Qsoil measurements.

Gsoil: Gsoil.c.10cm sage became bad as Tony and I were working at sage
on
12/18.  Problem was not fixed because ground was frozen. Ignore for now.
Problems with Gsoil.c.10cm.lake, it should be checked.

Soil Thermal properties: All of these signals look bad, despite "fixing"

the
wiring problem at tower (grass).  I've expected that it will take a
while to
get good data from these, since there was a small air gap around the
probes
after installation; however, the data look even worse.  In particular,
each
"event" on Vheat should look like a square wave toggling between 0 and 1.

Wind direction profile: OK, though there probably are biases of 1-2
degrees
(despite aligning the booms by eye up and down the tower and shooting
boom
angles that were mostly the same).  We'll need to check these angles
again.


  Kate Beierle
  Associate Scientist I
  NCAR/ATD
  Research Technology Facilit
- 112: Status, Site all stns, Wed 15-Jan-2003 15:07:47 MST, Daily status Jan 15
Weather plots:OK

Rain: OK

Pam power: OK

Sonics 2m:  OK

Sonic profiles: OK. w.15m stn0 is still reading a little lower (~-.2) than other sensors.

Krytons: plots are showing more moisture during early evening and early morning then throughout the night?

H2O-kh2o:  OK

Tv and P: pressure sensor data at tower is looking better, it matches sage and lake around 1200 MST Jan 14, then begins to break away a bit after 1800 MST jan 14.  After that, difference is about 2 mb.  Tbox.cosmos.stn0 is consistently warmer than daisy.


2m Sonic QC and profile: OK

Sonic variance (2m / profile): OK

Scalar variance 2m:  OK

Scalar variance: OK

Fluxes at 2m:  OK

Flux profiles: OK

CO2: OK

CO2 Moments: OK

TRH 2m difference: OK

TRH profile difference: 1m is more moist over night by ~5%. After 0700 MST all sensors measure about the same.

Short wave radiation: OK.

Long Wave Radiation: OK.

|Tdome-Tcase|: OK.

Tsoil:  OK. Tsoil.2.5cm.a.sage still looks like it may be exposed to
air.
I'm just ignoring this, since we should have adequate Tsoil sampling.

Qsoil:  Qsoil.c.10cm lake sensor still down.  It might also a cable cut
(like the Gsoil.10cm.a problem found at lake), but will require more
digging
up snow to check.  Currently, I'm ignoring this as well since there
probably
is enough redundancy in the Qsoil measurements.

Gsoil: Gsoil.c.10cm sage became bad as Tony and I were working at sage
on
12/18.  Problem was not fixed because ground was frozen. Ignore for now.
Problems with Gsoil.c.10cm.lake, it should be checked.

Soil Thermal properties: All of these signals look bad, despite "fixing"

the
wiring problem at tower (grass).  I've expected that it will take a
while to
get good data from these, since there was a small air gap around the
probes
after installation; however, the data look even worse.  In particular,
each
"event" on Vheat should look like a square wave toggling between 0 and 1.

Wind direction profile: OK, though there probably are biases of 1-2
degrees
(despite aligning the booms by eye up and down the tower and shooting
boom
angles that were mostly the same).  We'll need to check these angles
again.


  Kate Beierle
  Associate Scientist I
  NCAR/ATD
  Research Technology Facilit
- 111: Status, Site all stns, Tue 14-Jan-2003 14:24:22 MST, Daily status Jan 14
Weather plots:OK

Rain: OK

Pam power: OK

Sonics 2m:  OK

Sonic profiles: OK. w.15m stn0 is coming in a little bit lower (~-.2- -.4) than other sensors (.4 - -.1)

Krytons: Diurnal variation is not present for any sensors.

H2O-kh2o:  H20-kh20.2m sage had glitch from .6 to 1.2 on Jan 13 at 1300 MST

Tv and P: pressure sensor data at tower is a bit higher (by about 2 mb) than at other sites.  Tbox.cosmos.stn0 is consistently about 5 deg warmer than daisy.


2m Sonic QC and profile: OK

Sonic variance (2m / profile): OK

Scalar variance 2m:  OK

Scalar variance: OK

Fluxes at 2m: OK

Flux profiles: OK

CO2: OK

CO2 Moments: OK

TRH 2m difference: OK

TRH profile difference: 1m -.5m is about 4% drier than other differences measured.

Short wave radiation: OK.

Long Wave Radiation: OK, Rlw.in.b.25m and Rlw.out.a.25m stn0 were removed.

|Tdome-Tcase|: OK, out.grease stn0 no longer being plotted either.

Tsoil:  OK. Tsoil.2.5cm.a.sage still looks like it may be exposed to
air.
I'm just ignoring this, since we should have adequate Tsoil sampling.
All Tsoils.tower(grass) have a bit noise from the radiometer fans, but
this is
small enough that I'm ignoring it too.

Qsoil:  Qsoil.c.10cm lake sensor still down.  It might also a cable cut
(like the Gsoil.10cm.a problem found at lake), but will require more
digging
up snow to check.  Currently, I'm ignoring this as well since there
probably
is enough redundancy in the Qsoil measurements.

Gsoil: Gsoil.c.10cm sage became bad as Tony and I were working at sage
on
12/18.  Problem was not fixed because ground was frozen. Ignore for now.
Problems with Gsoil.c.10cm.lake, it should be checked.

Soil Thermal properties: All of these signals look bad, despite "fixing"

the
wiring problem at tower (grass).  I've expected that it will take a
while to
get good data from these, since there was a small air gap around the
probes
after installation; however, the data look even worse.  In particular,
each
"event" on Vheat should look like a square wave toggling between 0 and 1.

Wind direction profile: OK, though there probably are biases of 1-2
degrees
(despite aligning the booms by eye up and down the tower and shooting
boom
angles that were mostly the same).  We'll need to check these angles
again.


  Kate Beierle
  Associate Scientist I
  NCAR/ATD
  Research Technology Facilit
- 109: Status, Site all stns, Fri 10-Jan-2003 14:56:44 MST, Daily status Jan 10
Weather plots:Pressure at tower dropped yesterday afternooon just after 1300, to 751. It rebounded at 1700 MST

Rain: Top plot has no data.

Pam power: OK

Sonics 2m:  OK

Sonic profiles: OK

Krytons: Diurnal variation is present for all sensors.  Sensors show small moisture increase from  0100-0130 MST .

H2O-kh2o:  20m tower still showing signs that it may have a light leak? 2m tower
shows a small variation from what the other sensors are outputting.  It increased ~1.5 g/m^3 between 0100-0500 MST jan 9.

Tv and P: pressure sensor data at tower is quite a bit higher (by about 2 mb) than at other sites.  Tbox.cosmos.stn0 jumped from ~22 deg to ~58 deg between 0100and 0500 MST Jan 9.  Doubt that its real because temp shot straight up to 58 deg, apparently stayed there for 4 hours and dropped straight back to ~20 deg.


2m Sonic QC and profile: Small but quick increase in 10m for all components (u,v,w,diag), between 0300 and 0500 MST.

Sonic variance (2m / profile): v'v'.2m shot up to almost 7 (m/s)^2 at 0500 MST./ OK

Scalar variance 2m:  kh2o'kh2o'.2m steadily climbed to 4+ over night, suddenly dropped to near 0 at 0600 MST. Remained at/near zero until 1200 MST when all the sensors increeased to between 2.5-3.5. tc'tc'.2m showed a lot of variation over night, up until about 0500 when it dropped to almost zero where it has stayed

Scalar variance: OK

Fluxes at 2m: OK

Flux profiles: OK

CO2: OK

CO2 Moments: OK

TRH 2m difference: Temp dropped from ~-1 to ~-13 just before 0500, RH also decreased at this time from ~2% to ~-18%. Both recovered fairly quickly.

TRH profile difference: fairly significant temp change (drops 5-10 deg), and decrease in RH (10-20%) at 0500 MST.

Short wave radiation: OK.

Long Wave Radiation: OK, but Rlw.in.b.25m and Rlw.out.a.25m stn0, which were having having problems are not longer there?

|Tdome-Tcase|: OK, in.b.25m stn0 is no longer being plotted. out.grease stn0 no longer being plotted either.

Tsoil:  OK. Tsoil.2.5cm.a.sage still looks like it may be exposed to
air.
I'm just ignoring this, since we should have adequate Tsoil sampling.
All Tsoils.tower(grass) have a bit noise from the radiometer fans, but
this is
small enough that I'm ignoring it too.

Qsoil:  Qsoil.c.10cm lake sensor still down.  It might also a cable cut
(like the Gsoil.10cm.a problem found at lake), but will require more
digging
up snow to check.  Currently, I'm ignoring this as well since there
probably
is enough redundancy in the Qsoil measurements.

Gsoil: Gsoil.c.10cm sage became bad as Tony and I were working at sage
on
12/18.  Problem was not fixed because ground was frozen. Ignore for now.
Gsoil.c.10cm is back on the fritz. Also, keep an eye in Gsoil.a.10cm.sage, it seems to be behaving starngely.

Soil Thermal properties: All of these signals look bad, despite "fixing"

the
wiring problem at tower (grass).  I've expected that it will take a
while to
get good data from these, since there was a small air gap around the
probes
after installation; however, the data look even worse.  In particular,
each
"event" on Vheat should look like a square wave toggling between 0 and 1.

Wind direction profile: OK, though there probably are biases of 1-2
degrees
(despite aligning the booms by eye up and down the tower and shooting
boom
angles that were mostly the same).  We'll need to check these angles
again.


  Kate Beierle
  Associate Scientist I
  NCAR/ATD
  Research Technology Facilit
- 108: Status, Site all stns, Thu 09-Jan-2003 13:06:39 MST, Daily status Jan 9
Weather plots:Pressure at tower dropped yesterday afternooon to, or below, 752. It rebounded, and then dropped until about 1700 MST, Jan 8, and came back up around 2300.

Rain: From looking at top plot, there's no moisture, no calibraiton bleeps, and no sign of life.

Pam power: OK

Sonics 2m:  OK

Sonic profiles: w data from 10m drops from around 0 to -.5 m/s shortly before 0200 MST, and rebounds shortly after 0500 MST. None of other sensors behaved this way.

Krytons: Diurnal variation is present for all sensors except at 30m. 2m sensor misbehaves between 1700-2300  MST Jan 8.

H2O-kh2o: 20m and 30m show no diurnal variation. 2m jumps from -.8 to 1.3 at 1700, drops slightly over the next few hours, then returns to negative values.

Tv and P: pressure sensor behavior at tower noted above in weather section.


2m Sonic QC and profile: Flares up a bit over night, reading dropped again around 0900 MST.

Sonic variance (2m / profile):  OK

Scalar variance 2m: OK

Scalar variance: OK

Fluxes at 2m: OK

Flux profiles: OK

CO2: between 1700-2400 Jan 8 co2mr.2m, tlicor2m, and plicor.2m flatlined. Pressure also jumped from ~640 to ~840 mb during this time.

CO2 Moments: no moments data shown during times listed above.

TRH 2m difference:  OK

TRH profile difference: .  OK

Short wave radiation: OK.

Long Wave Radiation: OK but Rlw.in.b.25m and Rlw.out.a.25m stn0, which were having having problems are not longer there?

|Tdome-Tcase|: OK, in.b.25m stn0 is no longer being plotted. out.grease stn0 no longer being plotted either.

Tsoil:  OK. Tsoil.2.5cm.a.sage still looks like it may be exposed to
air.
I'm just ignoring this, since we should have adequate Tsoil sampling.
All Tsoils.tower(grass) have a bit noise from the radiometer fans, but
this is
small enough that I'm ignoring it too.

Qsoil:  Qsoil.c.10cm lake sensor still down.  It might also a cable cut
(like the Gsoil.10cm.a problem found at lake), but will require more
digging
up snow to check.  Currently, I'm ignoring this as well since there
probably
is enough redundancy in the Qsoil measurements.

Gsoil: Gsoil.c.10cm sage became bad as Tony and I were working at sage
on
12/18.  Problem was not fixed because ground was frozen. Ignore for now.
Gsoil.c.10cm lake was on the fritz prior to 1500 Jan 8 but seems to have
recovered.

Soil Thermal properties: All of these signals look bad, despite "fixing"

the
wiring problem at tower (grass).  I've expected that it will take a
while to
get good data from these, since there was a small air gap around the
probes
after installation; however, the data look even worse.  In particular,
each
"event" on Vheat should look like a square wave toggling between 0 and 1

V.
The "Vpile" signal at tower looks close to the signal expected for
Vheat, but
at the wrong amplitude.

Wind direction profile: OK, though there probably are biases of 1-2
degrees
(despite aligning the booms by eye up and down the tower and shooting
boom
angles that were mostly the same).  We'll need to check these angles
again.

u* profiles: First plot there is not data for sensors at 30 m between 1:00-6:00 MST?


  Kate Beierle
  Associate Scientist I
  NCAR/ATD
  Research Technology Facilit
- 106: Status, Site all stns, Wed 08-Jan-2003 14:03:31 MST, Daily status Jan 8
Weather plots:rainr tower(1) had a spike from -25 to -3 g/kg at 1530 on Jan 7.

Rain: OK

Pam power: OK

Sonics 2m:  w.2m tower was behaving strangely from 0700-0900 MST.

Sonic profiles: data from 10m is quite different than that
coming from other sensors.  for u component Between 0600-0900 the
10m sensor was reading between  -2 and -4 m/s, while others were close
to (or above) 0 m/s. At one point it jumped to 2 m/s from -2 m/s.The v componentduring this time ranged between 2 and 9 m/s.  The w component for the 5m, 10m and 15m sensors at that time looks bad also.  All sensors seem to recover
shortly after 0900 MST.

Krytons: OK. Diurnal variation is present for all sensors.

H2O-kh2o: 20m still shows a diurnal difference (light leak?).  This
didn't
change with cleaning on about 12/17.

Tv and P: tc.1m stn0 may have had a glitch just after 0800.  According to the sensor the temperature drops from ~-21 to ~-29 between 0800 and 0900 MST which is almost 10 deg colder than at other heights.


2m Sonic QC and profile: Flares up a bit over night, reading drop again around 0900 MST.

Sonic variance (2m / profile):  OK / Lots of spikes between 0400 and 0900 MST.

Scalar variance 2m: kh20'kh2o'.2m at tower steadily increased between 2100 MST Jan 7 and 0200 Jan 8 MST until it reached 4 where it has stayed.  There is very little evidence of sage...must be at or very close to zero.

Scalar variance: OK

Fluxes at 2m: OK

Flux profiles: Very irregular between 0200 and 0900 MST.

CO2: OK

CO2 Moments: OK

TRH 2m difference:  it seems that when RH.2m sage-tower drops significantly lake-tower increases by about the same magnitude.

TRH profile difference: .  OK

Short wave radiation: OK.

Long Wave Radiation: Rlw.inb.25m looks to have crashed. Rlw.out.a.25m stn0 is continueing to experiance problems.

|Tdome-Tcase|: out.a.25m is reading higher than others. Also, b.25m.stn0 appears to have crashed.

Tsoil:  OK. Tsoil.2.5cm.a.sage still looks like it may be exposed to
air.
I'm just ignoring this, since we should have adequate Tsoil sampling.
All Tsoils.tower(grass) have a bit noise from the radiometer fans, but
this is
small enough that I'm ignoring it too.

Qsoil:  Qsoil.c.10cm lake sensor still down.  It might also a cable cut
(like the Gsoil.10cm.a problem found at lake), but will require more
digging
up snow to check.  Currently, I'm ignoring this as well since there
probably
is enough redundancy in the Qsoil measurements.

Gsoil: Gsoil.c.10cm sage became bad as Tony and I were working at sage
on
12/18.  Problem was not fixed because ground was frozen. Ignore for now.


Soil Thermal properties: All of these signals look bad, despite "fixing"

the
wiring problem at tower (grass).  I've expected that it will take a
while to
get good data from these, since there was a small air gap around the
probes
after installation; however, the data look even worse.  In particular,
each
"event" on Vheat should look like a square wave toggling between 0 and 1

V.
The "Vpile" signal at tower looks close to the signal expected for
Vheat, but
at the wrong amplitude.

Wind direction profile: OK, though there probably are biases of 1-2
degrees
(despite aligning the booms by eye up and down the tower and shooting
boom
angles that were mostly the same).  We'll need to check these angles
again.


  Kate Beierle
  Associate Scientist I
  NCAR/ATD
  Research Technology Facilit
- 104: Log, Site all stns, Wed 08-Jan-2003 11:09:25 MST, yesterday's tasks
Today was another day filled with tasks:

Condtions:: started foggy, cleared shortly after sunrise, but things stayed rimed for
several hours.  Very light winds even up the tower, though not as calm as yesterday.
Pretty clear skies, with scattered cirrus now at the end of the day.

Sage (~8:00-9:30)
- found everything rimed due to the fog.
- found where Tony had sliced through the Gsoil.10cm.c cable and spliced the cut, but
data were still bad.  Left it broken (even though we had brought a spare, I couldn't
see how to install it in the frozen ground).
- corrected swapped wires for TP01 (4H&5H) [which fixed this problem]
- cleaned rads
- cleaned krypton & blew rime away from sonic

Tower
- Gordon rebooted cosmos since the Datel channels were all constant overnight (~1800-)
- cleaned 4m.bare
- found by swapping 1.5m.bare and grease that problem was with adaptor connector.
brought cable back to base to fix.
- (found that we had to reboot the Toughbook to get it to talk to com1, in the process
rebooted cosmos again.)

Lake (While Cody was effecting the repair, I went to Lake)
- cleaned all rads (net has ice inside dome -- probably should replace dome next time)
- swapped 4H&5H on TP01 here as well
- Got Gordon and Steve to start 10 min TP01 cycling at lake and sage

Base
- Got printer to work by removing, shaking, and reinstalling color cartridge
- charged ScopeMeter

Sage (~1130-1200)
- after Steve and Gordon reported noisy data from TP01, I monitored the signals with a
DVM.  Found TP01 working okay, but main PAM power cycling between 13.3-14.9 V.  The
charge controller (began with "F"?) was clicking every 5 seconds corresponding to the
min and max of the voltage cycling.  Temporarily fixed problem by removing solar panels
(and wind generator, but WG by itself didn't stop cycling).  [Later reconnected ~1600]

Tower (Cody started these tasks while I was at Sage)
- reconnected bare.1.5m
- cleaned bare.1.5m
- reconnected grease
- cleaned grease
- cleaned all rads at grass
- checked that AMP connector on TP01 was wired properly (it was, though later found that
the colors are wrong)
- asked Gordon to turn off TP01 10-min cycling (back to 3 hr) at sage and lake and
turn on 10-min cycling at grass.
- checked that all logger screws were tight at 25m (they were)
- pulled in.b.25m and out.a.25m after doing "hand warming" test of (in order):
out.b.25m, out.a.25m, in.a.25m, in.b.25m [have confirmed that the channels were connected
as we expected: "a"="1"=south; "b"="2"=north]
~1500
- removed hauling rope and secured davit
- more tests of TP01 found that cable colors from sensor itself are probably wrong.
I couldn't make sense of them by measuring the resistance between wires.  Left probe
connected with a guess at wiring, but probably wrong.  Asked Gordon to reset cycling back
to 3 hrs.
- Dumped the calibrated amount of water into the rain gauge.  The fluid level is about
at the midpoint of the cylinder (about 50cm below the top and about 8 cm above the
top of the "box").
- noted that only 490psi was left in Lo-Cal, so changed to new Lo-Cal bottle.  We forgot
to note the new pressure, we think 1700-1800.  My plan is to switch back to the first
Lo-Cal during the IOP, when we can get to it quickly once it runs out.
- finally removed stepladder from bare

Base (~1540)
- Stopped charging ScopeMeter
- Swapped USB disk
- Turned off oven

Sage (~1600)
- Reconnected solar panels

Left site.
- 103: Status, Site all stns, Wed 08-Jan-2003 09:44:45 MST, Daily status Jan 7
Weather plots: Ptower is having problems and should be checked
out.

Rain: No data shown in first plot (raina stn0 and rainr.grass stn0).
Evaporation plot don't look good either.

Pam power: OK, but power at sage dropped from ~14 to ~12.7 at about
0100...battery was temporarily disconnected,hould be coming back up
soon.

Sonics 2m:  u.2m at lake began to increase at after 0400 MST and peaked
at 19 m/s at 0800 MST while other stations remained near ~2m/s.  w.2m
lake is looking bad.  It drops to ~-1.0 m/s between 0400 and 0800,
during this time sage and tower spiked to ~-.8 and ~-.9.

Sonic profiles: data from 10m  and 15m  is quite different than that
coming from other sensors.  for u component Between 0600-0900 the
sensors were reading between  -10 and -15 m/s, while others were close
to 0 m/s. However the v component at these heights climbed to between
+10 and +15 m/s during this time.  w component for most of the sensors
around this time frame looks bad too.  All sensors seem to recover
shortly after 1000 MST.

Krytons: OK. Diurnal variation is present except at 2m.  There appears
to be very little moisture over night at that level and voltage never
drops until 0900 MST.  It seems to be working properly again after 0900.

H2O-kh2o: 20m still shows a diurnal difference (light leak?).  This
didn't
change with cleaning on about 12/17.

Tv and P:  Looks like pressure sensor was down over night.  Brought back
up at 0900 MST

2m Sonic QC and profile: Flares up a bit between 0400 and 1000 MST

Sonic variance (2m and profile):  All componnets flare up a bit between
0400 and 1000 MST with values reaching 10 m/s^2.

Scalar variance 2m:  tc'tc'.2m lake got up to ~3.0 between 0400-1000
MST.  kh20'kh2o'.2m got up to ~3.5 (g/m^3)^2 between
0400-0600 MST

Scalar variance: OK

Fluxes at 2m: Same deal, flares and glitches between 0400-1000 MST

Flux profiles: ""

CO2: Im not really sure what to make of this data.  Sensor seems to
have gone down between 1800 on Jan 6 and 0930 on Jan 7, and then
recovered.

CO2 Moments: ""

TRH 2m difference:  RH.2m sage-tower drops about 25% between 1000 and
1400 MST.

TRH profile difference: .  OK

Short wave radiation: OK.

Long Wave Radiation: Rlw.in.a25m and Rlw.inb.25m were acting up
yesterday afternoon, calmed over night and then 25 m data jumped quite a
bit higher than others and remains there.  Rlw.out.grease was not
looking good, looked like it was only reading 100
w/m^2 rather than 300 w/m^2 like the others, but recovered around 1100
MST.  Rlw.out.a.25m stn0 seems to have started experiencing problems at
0200 MST.

|Tdome-Tcase|: out.grease.stn0 should be checked, also should check both
in and out of  b.25m.stn0.

Tsoil:  OK. Tsoil.2.5cm.a.sage still looks like it may be exposed to
air.
I'm just ignoring this, since we should have adequate Tsoil sampling.
All Tsoils.tower(grass) have a bit noise from the radiometer fans, but
this is
small enough that I'm ignoring it too.

Qsoil:  Qsoil.c.10cm lake sensor still down.  It might also a cable cut
(like the Gsoil.10cm.a problem found at lake), but will require more
digging
up snow to check.  Currently, I'm ignoring this as well since there
probably
is enough redundancy in the Qsoil measurements.

Gsoil: Gsoil.c.10cm sage became bad as Tony and I were working at sage
on
12/18.  One of us probably cut a cable.  This should be fixed next
visit.

Soil Thermal properties: All of these signals look bad, despite "fixing"

the
wiring problem at tower (grass).  I've expected that it will take a
while to
get good data from these, since there was a small air gap around the
probes
after installation; however, the data look even worse.  In particular,
each
"event" on Vheat should look like a square wave toggling between 0 and 1

V.
The "Vpile" signal at tower looks close to the signal expected for
Vheat, but
at the wrong amplitude.

Wind direction profile: OK, though there probably are biases of 1-2
degrees
(despite aligning the booms by eye up and down the tower and shooting
boom
angles that were mostly the same).  We'll need to check these angles
again.


  Kate Beierle
  Associate Scientist I
  NCAR/ATD
  Research Technology Facilit
- 102: Status, Site all stns, Tue 07-Jan-2003 16:31:04 MST, Daily status Jan 6
One of the computers died on Jan 4, 2002 and affected all datasets
collected from sensors mounted near the bottom of the tower, through
0900 MST on Jan 6.

Pam power: OK.

Sonics:  No uvw data from tower at or below 5m.  Others look fine.

Krytons: OK. Diurnal variation is back.  kh20.20m.stn0 spikes to 24
g/m^3at noon MST, appears to be a data glitch.

H2O-kh2o: 20m still shows a diurnal difference (light leak?).  This
didn't
change with cleaning on about 12/17.

Tv and P: OK

Sonic variance 2m: OK

Scalar variance 2m:  kh20'kh2o'.2m got up to +4 (g/m3)2 between
0400-0600 MST

Scalar variance: tc'tc'.10m has a small gap of  missing data at 0000
MST.  kh2o'kh2o'.10m stn0 has missing data just after 0500 MST and then
no data after 0830 MST??

Fluxes at 2m: OK

Flux profiles: OK

CO2: Very little data because of downed computer.

CO2 Moments: Very little data.

TRH profile difference: .  5m and 30m may not have been working
correctly.  Between  1000 and 1300 MST, when computer was brought back
up, 5m sensor was reading between 2 and 6 degrees higher than others and
was drier by 10-25%.  30m tower looks like it had a glitch just before
noon.  Both seem to have recovered.

Short wave radiation: OK.

Long Wave Radiation: glitch in Rlw.out.4m.bare.stn0 and
Rlw.out.bare.stn0 of ~100(W/m2), both recovered almost immediately.
Rlw.out.grease is not looking good, looks like it's only reading 100
w/m2 rather than 300 w/m2 like the others.

|Tdome-Tcase|: out.grease.stn0 should be checked.

Tsoil:  OK. Tsoil.2.5cm.a.sage still looks like it may be exposed to
air.
I'm just ignoring this, since we should have adequate Tsoil sampling.
All Tsoils.tower(grass) have a bit noise from the radiometer fans, but
this is
small enough that I'm ignoring it too.

Qsoil:  Qsoil.c.10cm lake sensor still down.  It might also a cable cut
(like the Gsoil.10cm.a problem found at lake), but will require more
digging
up snow to check.  Currently, I'm ignoring this as well since there
probably
is enough redundancy in the Qsoil measurements.

Gsoil: Gsoil.c.10cm sage became bad as Tony and I were working at sage
on
12/18.  One of us probably cut a cable.  This should be fixed next
visit.

Soil Thermal properties: All of these signals look bad, despite "fixing"
the
wiring problem at tower (grass).  I've expected that it will take a
while to
get good data from these, since there was a small air gap around the
probes
after installation; however, the data look even worse.  In particular,
each
"event" on Vheat should look like a square wave toggling between 0 and 1
V.
The "Vpile" signal at tower looks close to the signal expected for
Vheat, but
at the wrong amplitude.

Wind direction profile: OK, though there probably are biases of 1-2
degrees
(despite aligning the booms by eye up and down the tower and shooting
boom
angles that were mostly the same).  We'll need to check these angles
again.
- 101: Soil, Site all stns, Tue 07-Jan-2003 13:40:58 MST, testing of thermal properties probes
At sage, 11:59 am, Jan 7, set the thermal properties cycle to 10 minutes
(from 180 minutes) so that Steve/Cody could check the voltages.

At 12:05, did the same at lake.

Steve determined at sage that the variation seen on Vheat is due to the
charging system.


At 1:30 pm, changed sage back to 180 minute cycle.  At 1:32, changed
lake back.

At 1:37pm, changed grass to 10 minutes.
At 3:51pm, changed grass back to 180 minutes.

The TP instructions are numbers 68 and 72

The values for normal 3 hour cycling are:
MODE 01:0000  68\r\n
68:P92  \r\n
01:0000  \r\n
02:0180  \r\n
03:30  \r\n
\r\n
MODE 01:0000  72\r\n
72:P92  \r\n
01:0003  \r\n
02:0180  10\r\n
03:30  \r\n
\r\n


For 10 minute cycling, change the second parameter from 180 to 10.
- 98: Weather, Site all stns, Tue 07-Jan-2003 07:42:15 MST, sunrise
sunrise 2 minutes ago ~7:40
- 97: Weather, Site all stns, Tue 07-Jan-2003 07:40:19 MST, fog
Fog now mostly clear, but was thicker earlier -- especially at low levels.
Still thin wisps at bottom ~3m.  Does this explain our krypton problems?
(but what is happening at 2m.tower?)
- 95: Status, Site all stns, Fri 03-Jan-2003 15:33:48 MST, Daily Status Jan 3
Pam power: OK.

Sonics: OK.

Krytons: OK. No diurnal variation.

H2O-kh2o: 20m still shows a diurnal difference (light leak?).  This didn't
change with cleaning on about 12/17.

Tv and P: tc.2m.sage(2) drops below -8 deg C twice around 1900 MST (1/2/02) while others measure between -2 and -6 deg.  Pressure at tower still has temperature contamination.

Sonic variance 2m: OK

Scalar variance 2m: tc'tc'2m at sage(2) spikes up to 2.8 ~1900 MST (1/2/03) while other sensors measure <.5

Scalar variance: OK

Fluxes at 2m: OK

Flux profiles: OK

CO2: OK.  Has been working since our visit on 12/18.  However, only the
"low-cal" (tty 1) is connected due to a bad regulator. co2mr.2m quickly dropped from ~257 to ~222, jumped back up, then dove to ~231 all within the time frame of about an hour and a half ((0203 - 0400 MST 1/2/03).

CO2 Moments: shows problems with data during same time frame.

TRH: OK, though the RH profiles are not monotonic.

Short wave radiation: OK.

Long Wave Radiation: OK

|Tdome-Tcase|: in.4m.bare has about the same amount of variation  but values are slightly higher.

Tsoil:  OK. Tsoil.2.5cm.a.sage still looks like it may be exposed to air.
I'm just ignoring this, since we should have adequate Tsoil sampling.
All Tsoils.tower(grass) have a bit noise from the radiometer fans, but this is
small enough that I'm ignoring it too.

Qsoil:  Qsoil.c.10cm lake sensor still down.  It might also a cable cut
(like the Gsoil.10cm.a problem found at lake), but will require more digging
up snow to check.  Currently, I'm ignoring this as well since there probably
is enough redundancy in the Qsoil measurements.

Gsoil: Gsoil.c.10cm sage became bad as Tony and I were working at sage on
12/18.  One of us probably cut a cable.  This should be fixed next visit.

Soil Thermal properties: All of these signals look bad, despite "fixing" the
wiring problem at tower (grass).  I've expected that it will take a while to
get good data from these, since there was a small air gap around the probes
after installation; however, the data look even worse.  In particular, each
"event" on Vheat should look like a square wave toggling between 0 and 1 V.
The "Vpile" signal at tower looks close to the signal expected for Vheat, but
at the wrong amplitude.

Wind direction profile: OK, though there probably are biases of 1-2 degrees
(despite aligning the booms by eye up and down the tower and shooting boom
angles that were mostly the same).  We'll need to check these angles again.
- 93: Status, Site all stns, Thu 02-Jan-2003 18:58:44 MST, Daily Status Jan 2
Pam power: OK.

Sonics: OK.

Krytons: Heating of 2m.tower is off.  The heating of other krytons still doesn't seem to be working.

H2O-kh2o: 20m still shows a diurnal difference (light leak?).  This didn't
change with cleaning on about 12/17.

Tv and P: Pressure at tower still has temperature contamination.

Sonic variance 2m: OK

Scalar variance 2m: Doesn't look good. kh2o'kh20'.2m for all sites shoots up to 4+ at various times.

Scalar variance: 10m and 30m seem noisy between 1800 MST on 1/1 and 0000 MST 1/2
Fluxes at 2m: OK

Flux profiles: OK

CO2: OK.  Has been working since our visit on 12/18.  However, only the
"low-cal" (tty 1) is connected due to a bad regulator.  We note that the
pressure drop down the line is almost exactly 10% (P.licor ~660, P ~730),
which is a reasonable value.

TRH: OK, though the RH profiles are not monotonic.

Short wave radiation: OK.

Long Wave Radiation: Rlw.in.4m.bare still looks bad to a greater or lesser
degree.

|Tdome-Tcase|: in.4m.bare all seems likes it's off, it has much greater variation then other sensors.

Tsoil:  OK. Tsoil.2.5cm.a.sage still looks like it may be exposed to air.
I'm just ignoring this, since we should have adequate Tsoil sampling.
All Tsoils.tower(grass) have a bit noise from the radiometer fans, but this is
small enough that I'm ignoring it too.

Qsoil:  Qsoil.c.10cm lake sensor still down.  It might also a cable cut
(like the Gsoil.10cm.a problem found at lake), but will require more digging
up snow to check.  Currently, I'm ignoring this as well since there probably
is enough redundancy in the Qsoil measurements.

Gsoil: Gsoil.c.10cm sage became bad as Tony and I were working at sage on
12/18.  One of us probably cut a cable.  This should be fixed next visit.

Soil Thermal properties: All of these signals look bad, despite "fixing" the
wiring problem at tower (grass).  I've expected that it will take a while to
get good data from these, since there was a small air gap around the probes
after installation; however, the data look even worse.  In particular, each
"event" on Vheat should look like a square wave toggling between 0 and 1 V.
The "Vpile" signal at tower looks close to the signal expected for Vheat, but
at the wrong amplitude.

Wind direction profile: OK, though there probably are biases of 1-2 degrees
(despite aligning the booms by eye up and down the tower and shooting boom
angles that were mostly the same).  We'll need to check these angles again.
- 92: Radiometers, Site all stns, Tue 31-Dec-2002 13:38:02 MST, logger files
Here are all of the coeffient files loaded into the loggers.
(I got these from the cal-lab PC, so Steve S should verify that they
are the correct files.)

25m:
31975	pi1	06	251.193168
31974	po1	07	257.334020
31979	pi2	08	263.157895
31977	po2	09	261.711594
PI1TC-A0	x	10	2500
A1	x	11	3.355702
A2	x	12	.279378
A3	x	13	3.970700
A4	x	14	200.967000
PI1TD-A0	x	15	2500
A1	x	16	3.054151
A2	x	17	.270750
A3	x	18	3.531936
A4	x	19	172.539000
PO1TC-A0	x	20	2500
A1	x	21	3.354452
A2	x	22	.2795544
A3	x	23	3.870320
A4	x	24	213.662200
PO1TD-A0	x	25	2500
A1	x	26	3.053245
A2	x	27	.2706839
A3	x	28	3.462000
A4	x	29	179.035300
PI2TC-A0	x	30	2500
A1	x	31	3.355302
A2	x	32	.2796132
A3	x	33	3.907393
A4	x	34	205.226200
P12TD-A0	x	35	2500
A1	x	36	3.055463
A2	x	37	.271608
A3	x	38	3.538717
A4	x	39	170.026300
PO2TC-A0	x	40	2500
A1	x	41	3.355048
A2	x	42	.2793915
A3	x	43	3.969477
A4	x	44	201.022200
PO2TD-A0	x	45	2500
A1	x	46	3.052511
A2	x	47	.2706538
A3	x	48	3.516783
A4	x	49	176.020500
2018-A0	level-x	50	1.219419589
A1	x	51	10.90459926
A2	x	52	0.098392445
A3	x	53	-0.007021535
A4	x	54	0.000000
A0	level-y	55	-0.3726148
A1	x	56	10.4045871
A2	x	57	-0.1230141
A3	x	58	0.511059
A4	x	59	0.000000


4m:
31981	pi1	06	267.1653754
31980	po1	07	277.0466824
31976	p01m	08	255.102041
PI1TC-A0	x	10	2500
A1	x	11	3.354002
A2	x	12	.27995
A3	x	13	3.89791
A4	x	14	222.6
PI1TD-A0	x	15	2500
A1	x	16	3.050935
A2	x	17	.271316
A3	x	18	3.382922
A4	x	19	190.3757
PO1TC-A0	x	20	2500
A1	x	21	3.354756
A2	x	22	.279427
A3	x	23	3.948847
A4	x	24	215.9851
PO1TD-A0	x	25	2500
A1	x	26	3.052869
A2	x	27	.271025
A3	x	28	3.449757
A4	x	29	189.982
PO1mTC-A0	x	30	2500
A1	x	31	3.354748
A2	x	32	.279406
A3	x	33	3.926898
A4	x	34	202.8886
PO1mTD-A0	x	35	2500
A1	x	36	3.053435
A2	x	37	.270616
A3	x	38	3.557806
A4	x	39	167.4648

Grass (tower):
Q7-97069	NET(A+)	00	9.27
x	A-	01	11.48
P26416	x	02	290.866783
P29260	x	03	308.261406
K940181	x	04	82.3723229
K970379	x	05	45.51661356
H993563	x	06	38.9
H993562	x	07	37.3
H87034	x	08	36.8
Tc-A0	x	10	2500
A1	x	11	3.354472
A2	x	12	.2797812
A3	x	13	3.912974
A4	x	14	215.5208
Tdin-A0	x	15	2500
A1	x	16	3.052399
A2	x	17	.270981
A3	x	18	3.408667
A4	x	19	188.8687
Tcot-A0	x	20	2500
A1	x	21	3.353832
A2	x	22	.278595
A3	x	23	4.02801
A4	x	24	180.4266
Tdot-A0	x	25	2500
A1	x	26	3.053253
A2	x	27	.2706527
A3	x	28	3.530291
A4	x	29	166.282
HUX	x	50	180
baud	x	99	0

Greasewood:
31978	pygout	00	283.527077
PINTC-A0	x	10	2500
A1	x	11	3.354223
A2	x	12	.27981
A3	x	13	3.963779
A4	x	14	206.898
PINTD-A0	x	15	2500
A1	x	16	3.052301
A2	x	17	.270621
A3	x	18	3.499677
A4	x	19	177.414

Lake:
Q7-94197	NET(A+)	00	9.0
x	A-	01	11.22
P29137	x	02	240.211386
P29136	x	03	234.741784
K970377	x	04	43.55400697
K940186	x	05	82.71298594
H983213	x	06	38.2
H983211 x	07	36.4
H943149	x	08	39.7
Tc-A0	x	10	2500
A1	x	11	3.350057
A2	x	12	.279229
A3	x	13	3.147866
A4	x	14	-193.854
Tdin-A0	x	15	2500
A1	x	16	3.354167
A2	x	17	.278817
A3	x	18	3.653292
A4	x	19	222.2646
Tcot-A0	x	20	2500
A1	x	21	3.354344
A2	x	22	.278532
A3	x	23	3.845153
A4	x	24	185.129
Tdot-A0	x	25	2500
A1	x	26	3.354233
A2	x	27	.278537
A3	x	28	3.802989
A4	x	29	184.2122
HUX	x	50	180
baud	x	99	1

Sage:
Q7-94916	NET(A+)	00	9.21
x	A-	01	11.54
P26417	x	02	212.68
P27907	x	03	286.53
K970378	x	04	50.02501251
K940187	x	05	101.4198783
H983212	x	06	38.4
H993560	x	07	37.7
H943147	x	08	42.1
Tc-A0	x	10	2500
A1	x	11	3.355204
A2	x	12	.2795166
A3	x	13	3.950246
A4	x	14	209.3092
Tdin-A0	x	15	2500
A1	x	16	3.354969
A2	x	17	.2793838
A3	x	18	3.85506
A4	x	19	212.913
Tcot-A0	x	20	2500
A1	x	21	3.353713
A2	x	22	.2787871
A3	x	23	3.778048
A4	x	24	177.421
Tdot-A0	x	25	2500
A1	x	26	3.354732
A2	x	27	.2787514
A3	x	28	3.651471
A4	x	29	190.8095
HUX	x	50	180
baud	x	99	1
- 91: Sonics, Site all stns, Sun 29-Dec-2002 22:05:31 MST, sonic tilts
- Previous -
Next -
Index
| Graphic: | 
| Graphic: | 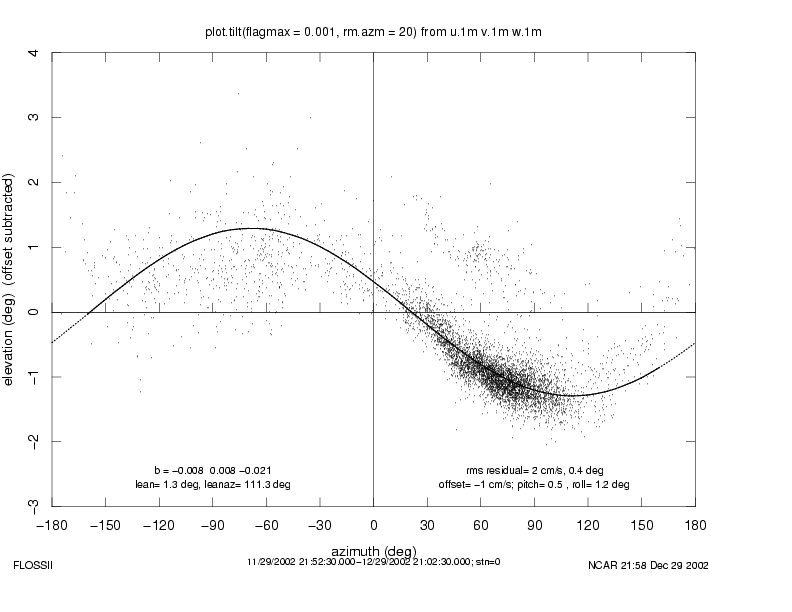
| Graphic: | 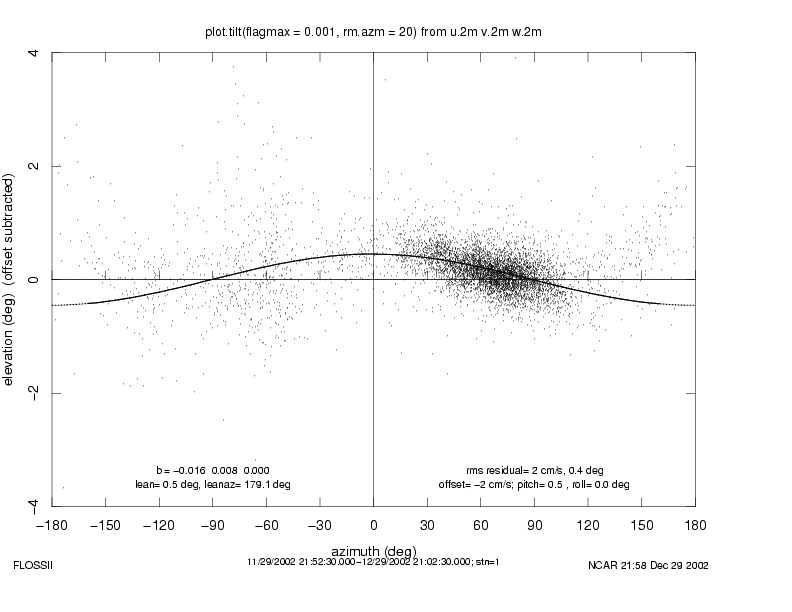
| Graphic: | 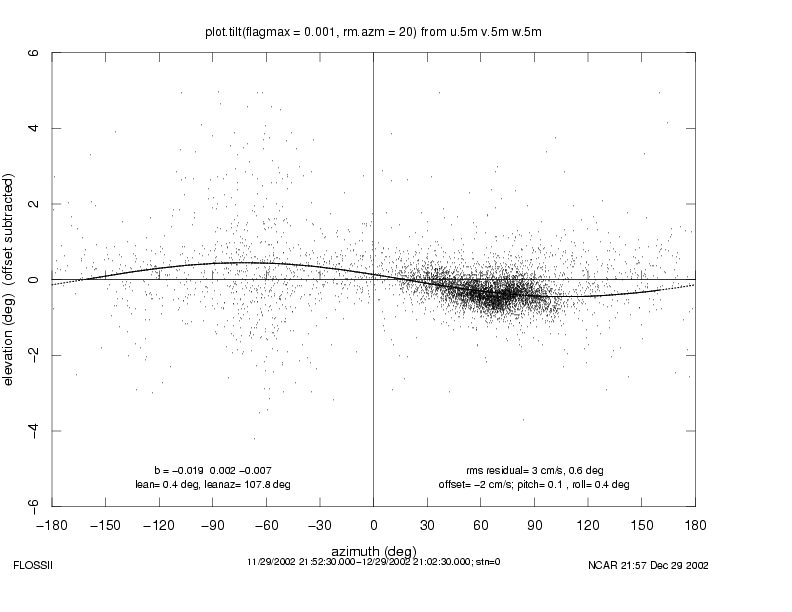
| Graphic: | 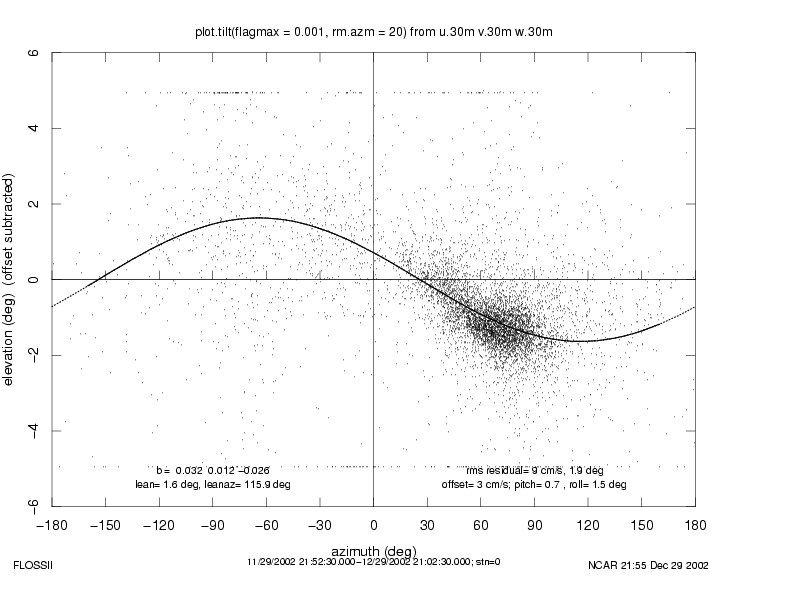
| Graphic: | 
| Graphic: | 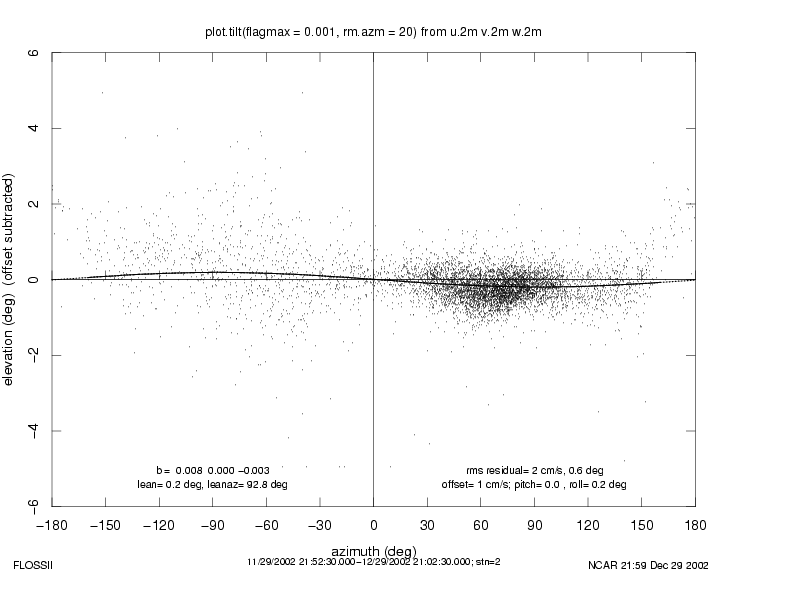
| Graphic: | 
| Graphic: | 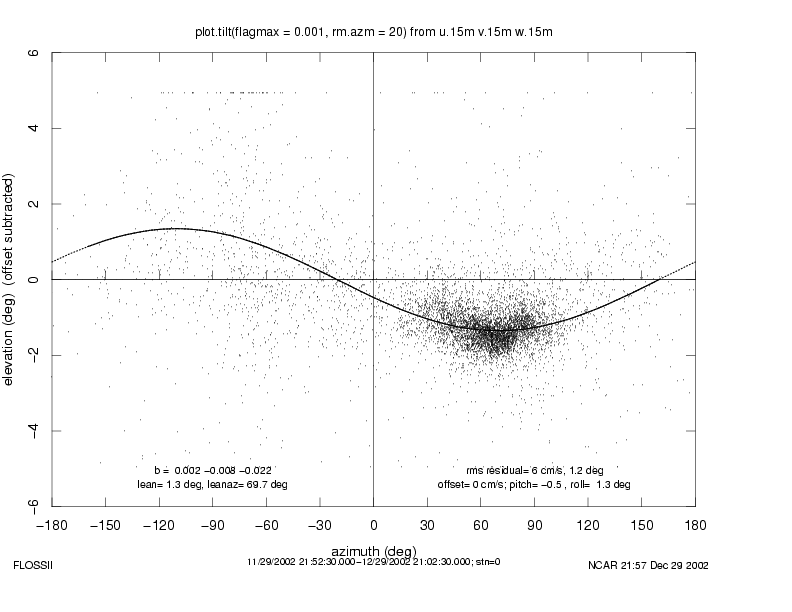
Attached are tilt plots over the last month.  All show small biases (3cm max?),
and reasonable angles (1.3deg max?).  There are some bad periods (icing?) in
the upper sonics.  More serious is that the 10m level had a bias shift sometime.
I'll have to investigate this more.
- 88: Status, Site all stns, Fri 27-Dec-2002 15:53:27 MST, Daily Status Dec 27
None of us have been systematically looking at data over X-mas, but here are
the things Gordon and I have observed:

--------------------------------

Pam power: OK.  The (new) lake wind generator is producing enough to keep
the batteries happy, especially with the high winds we have been getting.
Iload still is different between lake and sage -- cause still unknown.

Sonics: OK!

Krytons: Heating of 2m.tower is now off.  The heating didn't seem to be as
effective as it should have (perhaps the tubes became misaligned?) and Gordon
may have melted it by now by overheating to compensate.

H2O-kh2o: 20m still shows a diurnal difference (light leak?).  This didn't
change with cleaning on about 12/17.

Tv and P: Pressure at tower still has temperature contamination.

Sonic variance 2m: OK

Scalar variance: 10m and 30m seem noisy.  2m tower has a low level of noise
(non-zero variance).

Fluxes at 2m: OK

Flux profiles: OK

CO2: OK.  Has been working since our visit on 12/18.  However, only the
"low-cal" (tty 1) is connected due to a bad regulator.  We note that the
pressure drop down the line is almost exactly 10% (P.licor ~660, P ~730),
which is a reasonable value.

TRH: OK, though the RH profiles are not monotonic.  This could be fetch
related, but it is more likely that there are up to 2% biases in the sensors.
I'm also not completely convinced that there aren't some small biases on
the T values, though the data have looked pretty good lately.

Short wave radiation: OK.  We've noticed a sharp drop in incoming in the
evenings.  We suspect that this is caused by the elevated horizon of the
mountains, though it could also be effected by a lee-wave cloud caused by
the mountains.  It would be fun to plot the horizon (using the sun_angle from
the various days).  More effective probably would be to log the conditions
and time when the sun disappears during the next visit.

Long Wave Radiation: Rlw.in.4m.bare still looks bad to a greater or lesser
degree.  I've thought this was snow build-up due to a weak fan, but may be
wrong.  Grease is still not installed (but now ready to go on the next trip).

|Tdome-Tcase|:  25m.in.a, 25m.out.b, and bare in.4m.bare all seem worse than
they should be (up to 0.5C).

Tsoil:  OK. Tsoil.2.5cm.a.sage still looks like it may be exposed to air.
I'm just ignoring this, since we should have adequate Tsoil sampling.
All Tsoils.tower(grass) have a bit noise from the radiometer fans, but this is
small enough that I'm ignoring it too.

Qsoil:  Qsoil.c.10cm lake sensor still down.  It might also a cable cut
(like the Gsoil.10cm.a problem found at lake), but will require more digging
up snow to check.  Currently, I'm ignoring this as well since there probably
is enough redundancy in the Qsoil measurements.

Gsoil: Gsoil.c.10cm sage became bad as Tony and I were working at sage on
12/18.  One of us probably cut a cable.  This should be fixed next visit.

Soil Thermal properties: All of these signals look bad, despite "fixing" the
wiring problem at tower (grass).  I've expected that it will take a while to
get good data from these, since there was a small air gap around the probes
after installation; however, the data look even worse.  In particular, each
"event" on Vheat should look like a square wave toggling between 0 and 1 V.
The "Vpile" signal at tower looks close to the signal expected for Vheat, but
at the wrong amplitude.

Wind direction profile: OK, though there probably are biases of 1-2 degrees
(despite aligning the booms by eye up and down the tower and shooting boom
angles that were mostly the same).  We'll need to check these angles again.
- 85: Status, Site all stns, Thu 19-Dec-2002 14:10:16 MST, Daily Status Dec 19
 Pam power:
  Vbatt: lake down to ~12.2 V overnight.

Sonics: OK.

Krytons: spike of kh20.30m 20m and 10m at 0500 MST.

H2O-kh2o: spike in the data (basically all sensors, but largest at 30m (-2.7)) at  0500 MST

Tv and P: Pressure at tower is bad.

Sonic variance 2m: OK

Scalar variance: OK

Fluxes at 2m: OK

Flux profiles: OK

TRH: OK

Long Wave Radiation: Rlw.in.4m.bare stn0 still looks bad. Should be checked.

|Tdome-Tcase| : Sensors at bare in.4m.bare stn0 and out.grease stn0 are misbehaving.

Tsoil:  Sensor error at soil.2.5cm.  Others look good.

Qsoil:  Qsoil.c.10cm lake sensor still down.  Need to check.

Gsoil: Gsoil.c.10cm sage(2) isn't acting right. Need to check.
- 82: Status, Site all stns, Thu 19-Dec-2002 11:51:40 MST, Daily Status Dec 18
 Pam power:
  Vbatt: lake down to ~12.2 V overnight.

Sonics: The 2m sonic QC (last plot) and the Profile sonic QC (last plot)
look different than I've seen before.  Values are below 100% and there
appear to be a few data gaps.  Please take a look at.

Krytons: OK.

H2O-kh2o: sensor at 2m.lake is OK, others may not be.  Between 0900 and
1100 MST there were downward spikes and then they suddenly jumped up ~2
g/m3 (or more)

Tv and P: Pressure at tower is bad.

Sonic variance 2m: Large spike (~5.8 (m/s)2) in u'u.2m lake on Dec 17
at 2050 MST

Scalar variance: kh20'kh20'.2m lake had spikes of 2.7 and 3.8 at about
Dec 17 0100 MST.  kh20'kh20'.2m tower had spikes of  2 and 3.9 close to
1300 MST.

Fluxes at 2m: OK

Flux profiles: OK

TRH: OK

Long Wave Radiation: Rlw.in.4m.bare stn0 looks bad on three spots. It
drops significantly on Dec 17, 0300MST and again between Dec 17 2300-Dec
18 0200.

|Tdome-Tcase| : OK. Sensors at bare and grease, I assume, are still be
worked on.

Tsoil:  Sensor error at soil.2.5cm.  Others look good.

Qsoil:  Qsoil.c.10cm lake sensor still down.  Need to check.

Gsoil: Gsoil.c.10cm sage(2) and Gsoil.a.10cm lake(3) aren't acting
right. Need to check.
- 81: Status, Site all stns, Thu 19-Dec-2002 11:51:08 MST, Daily status Dec 17
Pam power:
  Vbatt: lake down to ~12.5 V overnight.

Sonics: data missing from tower site between 1300-1500 - ASTER reboot

Krytons: Heaters appear to be working well.   kh2o.2m lake had unusually
large spike (~11.5 g/m3) at  1300 MST.

H2O-kh2o: sensor at 2m.lake is acting up. It's reading more moist than
the other sensors, and has a few spikes.  One in particular reaches
about -7.6 g/m3.  Might want to check out.

Tv and P: Pressure at tower is bad.

Scalar variance: OK

Fluxes at 2m: OK

Flux profiles: OK

TRH: OK

Radiation: Rlw.in at sage and lake the same.

|Tdome-Tcase| : OK

Tsoil:  Sensor error at soil.2.5cm.  Others look good.

Qsoil:  Qsoil.c.10cm lake sensor still down.  Need to check.

Gsoil: OK
- 80: Soil, Site all stns, Wed 18-Dec-2002 14:13:04 MST, Soil gravimetric/bulk density
The Sage, Lake and Grass C soil samples were not treated the same as were
the A and B. Rather, the cores were extracted in toto and will be used for
bulk density determination. Because of the limitation of the balance the cores
were broken in two. The core portions were put into larger Al container, were
weighed and then left to dry until the next visit.
In all cases the ~20 cm of snow was removed and the ice crust atop the soil
surface was broken and removed. At Grass dead grass stalks were also removed.

Sage C            Tare               Fresh(18 Dec)           Dry(1/7/03)
0 - 8cm  ZI        8.0               143.2		     122.0
         ZII       8.0               149.0		     115.2

Lake C            Tare               Fresh(18 Dec)           Dry(1/7/03)
0 - 8 cm ZIII      8.0               120.5		     87.0
         ZIV       8.0               168.8		     127.2

Grass C           Tare               Fresh(18 Dec)           Dry(1/7/03)
0 - 8 cm ZV        8.0                76.2  top 4 cm peaty   34.3
         ZVI       8.0               136.1  bottom 4 cm      106.4
- 76: Snow_Precip, Site all stns, Tue 17-Dec-2002 17:36:16 MST, snowing today
About 2 today, it started snowing.  I would guess that we got at least 5cm by
5pm.
- 70: Soil, Site all stns, Tue 17-Dec-2002 16:21:07 MST, Gravimetric soil samples
Weighed the soil samples collected on Mon 16 Dec (see log entry 67)

11:40 Sage site. .At B, dug away 10 cm of snow. There was a 2 -3 cm ice crust
on the soil surface. Very hard going to sink the core as the ground was frozen.
Although the snow was completely removed from the surface before coring the ice
incorporated in the soil melted in the base to yield mud.
The corer stem broke and had to be replaced with a pice of pipe.

                   Fresh        Dry (18 Dec)
   0-3 cm  AI      25.3         17.6
           AII     20.9         14.7
           AIII    21.9         16.1

   3-8 cm  BI      26.1         21.6
           BII     22.6         18.8
           BIII    22.3         18.8

13:30 Lake site At B dug down through 30 cm of snow and brushed soil surface
clear of snow
                   Fresh        Dry (18 Dec)
  0-3 cm  CI       13.3         11.5
          CII      16.6         14.4
          CIII     14.6         12.5

  3-8 cm  DI       13.9         11.3
          DII      15.7         12.7
          DIII     19.1         15.3

14:00 Grass site. At B 25 - 30 cm of snow. Dug down and then broke up crust
incorporating dead grass stems and ice. Cleaned this away and started core
at peaty surface.
                   Fresh       Dry (18 Dec)
  0-3 cm  EI        8.2         2.5
          EII       7.4         2.4
          EIII      6.7         2.4

  3-8 cm  FI       15.9        12.3
          FII      17.3        12.7
          FIII     19.7        15.3
- 67: Soil, Site all stns, Mon 16-Dec-2002 17:55:08 MST, Gravimetric soil samples
Gravimetric soil samples are to be:
                                   top  3 cm
                                   next 5 cm
The plan is to do Sage A, Lake A and Grass A on Mon, 16 Dec, dry overnight
 ......................B.......B           B    Tue  17..................
.......................C ......C.......... C....Wed..18    leave in oven

Also to take total cores from three sites for bulk density and leave in oven

11:20 Sage site. Approx 10 cm of snow between bushes with almost no snow under some bushes.At A, under a bush with no snow cover, core sample.

                   Fresh        Dry (17 Dec)
   0-3 cm  AI      16.6         11.7
           AII     12.4          8.5
           AIII    13.1          8.8

   3-8 cm  BI      22.7         20.6
           BII     23.7         21.6
           BIII    24.2         21.9

12:00 Lake site Fairly uniform 20 -25 cm snow. Couldnt locate A so went approx
the correct distance from box. Dug down through snow to soil and brushed the surface clear.
                   Fresh        Dry (17 Dec)
  0-3 cm  CI       15.6         11.0
          CII      14.5         10.4
          CIII     17.1         12.5

  3-8 cm  DI       23.4         21.5
          DII      25.8         23.8
          DIII     25.4         23.2

12:40 Grass site. Grass sticking out of 0-8 cm snow.
Note that the top 1 cm was grass stalks. I discarded this and separated the dirtr component from the next 3 cm. The lower 5 cm was mostly dirt.
                   Fresh       Dry (17 Dec)
  0-3 cm  EI       5.5          2.9
          EII      4.6          2.4
          EIII     5.0          2.7

  3-8 cm  FI       9.5          6.8
          FII     11.3          8.3
          FIII    12.7          9.2
- 59: Status, Site all stns, Mon 16-Dec-2002 14:40:53 MST, Daily status, Dec 16
Pam Power:
  Vbatt: lake down to ~12.3 V overnight.

Sonics: OK.

krytons: air at 30m sensor more moist then at other levels by ~.5 g/m^3. Power glitch apparent where data is missing.

H2O-kh2o: H2O-kh2o.20m has drastic changes compared with other measurements.

Tv and P: Pressure is incorrect at tower.

Scalar variance: OK.

Fluxes a 2m : OK.

Flux profiles: OK.

TRH: OK

Radiation: Rlw.in at sage and lake the same.


|Tdome-Tcase|: OK.(Tdome-Tcase) at lake temporarily removed.

Tsoil:  other than soil.2.5cm sensor problems, looks good.

Qsoil: Qsoil.c.10cm lake sensor still down. Need to check on next trip to site.

Gsoil:  spikes and glitches in Gsoil.c.10cm.lake
- 56: Status, Site all stns, Fri 13-Dec-2002 14:10:10 MST, Daily status, Dec 13
Pam Power:
  Vbatt: lake down to ~12.1 V overnight.

Sonics: OK. v'v'2m spiked to almost 6 m/s^2 at 2230 MST on Dec 12.

krytons: air at 30m sensor more moist then at other levels by ~1 g/m^3.

Tv and P: Pressure is incorrect at tower.

Scalar variance: OK.

Fluxes a 2m : w'tc'.2m went bad just after 0300 MST, but came back around 0430 MST. w'h2o'.2m spiked to .09 a little after 0400 MST.

Flux profiles: OK.

TRH: OK

Radiation: No Rlw.in at sage?


|Tdome-Tcase|: OK.(Tdome-Tcase).in lake still bad.

Tsoil:  other than soil.2.5cm sensor problems, looks good.

Qsoil: Qsoil.c.10cm lake sensor still down. Need to check on next trip to site.

Gsoil:  spikes and glitches in Gsoil.c.10cm.lake
- 53: Status, Site all stns, Thu 12-Dec-2002 14:13:44 MST, Daily status, Dec 12
Pam Power:
  Vbatt: lake down to ~12.1 V overnight.

Sonics: w.2m spiked to -.9 at about 0330 MST.  Judging from 2m sonic, Profile Sonic QC, and Sonic Anemometer uvw plots anemometer may be having a bit of trouble in cold temperatures.

krytons: for all sensors, except a 30m, voltage dropped to almost 0 over night.

Tv and P: Pressure is incorrect at tower.

Scalar variance: kh2o'kh2o' tower went a bit crazy between 0300 and 0700 to.

Fluxes a 2m : w'tc'.2m went bad just after 0300 MST, but came back around 0430 MST. w'h2o'.2m spiked to .09 a little after 0400 MST.

Flux profiles: OK.

TRH: OK

Radiation: Looks like Rlw.in.tower(1) and Rlw.out.tower(1) are missing a couple chunks of data.


|Tdome-Tcase|: missing chunk of data from tower between 1500 and 1700 MST in Dec 11.  Gordon was fixing things which caused the data gap.


Tsoil:  other than soil.2.5cm sensor problems, looks good.

Qsoil: Qsoil.c.10cm lake sensor still down. Need to check on next trip to site.

Gsoil:  spikes and glitches in Gsoil.c.10cm.lake
- 52: Status, Site all stns, Wed 11-Dec-2002 14:44:12 MST, Daily status, Dec 11
Pam Power:
  Vbatt: lake down to ~12.1 V overnight.

Sonics: OK

krytons: OK

Tv and P: Pressure is off at tower.

Scalar variance: kh2o'kh2o' lake spiked to .24 (g/m^3)^2. Krytons show lake site had the most moisture over night.

Fluxes a 2m : OK

Flux profiles: Spike in w'h2o'.10 m stn0 of .18 a little after 0700 MST.

TRH: OK

Radiation:
     Absence of pergeometer at lake site causes spikes, and missing values. It affects Rsum lake and the long wave incoming lake site trace.

|Tdome-Tcase|: lake plot also affected by removal of pergeometer.


Tsoil:  Sensors at the tower are noisy because fans are running but problem should be fixed (see "Modified grass logger Tsoil sampling" log entry).  soil.2.5cm sage still having problems.

Qsoil: Qsoil.c.10cm lake sensor still down. Need to check on next trip to site.

Gsoil:  spikes and glitches in Gsoil.c.10cm.lake
- 50: Status, Site all stns, Tue 10-Dec-2002 14:58:17 MST, Daily status, Dec 10
Pam Power:
  Vbatt: lake down to ~12.1 V overnight.
  Wind speeds at sage (lwind) still have not been high enough to trigger the current. Steve recommends checking/adjusting the pot on next visit.


Sonics: OK
MST.

krytons: Noraml diurnal variation in all sensors except those at 20 and 30 m.

Tv and P: Pressure is off at tower.

Scalar variance: kh2o'kh20'.2m tower shot up to 4 (g/m^3)^2 at 0700 MST.  It recovered at 0900 MST. Most likely a result of frost in the kryton.

Fluxes a 2m : spikes in the data were seen for both w'kh2o (.058) and w'tc (.28)
 at 0330 MST.

Flux profiles: OK

TRH: OK

Radiation:
     Absence of pergeometer at lake site causes spikes, and missing values. It affects Rsum lake and the long wave incoming lake site trace.

|Tdome-Tcase|: lake plot also affected by removal of pergeometer.


Tsoil:  Sensors at the tower are noisy because fans are running (they need to be turned off). Tsoil.2.5cm sage still having problems.

Qsoil: Qsoil.c.10cm lake sensor still down. Need to check on next trip to site.

Gsoil:  spikes and glitches in Gsoil.c.10cm.lake
- 49: Status, Site all stns, Mon 09-Dec-2002 10:15:41 MST, Daily status, Dec 9
Pam Power:
  Vbatt: lake down to ~12.2 V overnight.
  lwind sage dropped off after 2200 MST Dec 6, and has not been seen since. Wind  speeds have not been high enough to trigger the current. Steve recommends
  checking/adjusting the pot on next visit.


Sonics:  small glitch in w.2m at sage, dropped to -.20 at little after 5:00 am
MST.

krytons: voltage of sensor at kh2o.2m tower recorded negative values between about 0500-0900 MST 12/8, and after 2200 MST 12/8 until 0900 MST the morning of the 9th. Heaters?

Tv and P: Pressure is off at tower.

Scalar variance: kh2o'kh20'.2m tower shot up to 4 (g/m^3)^2 after 2000 MST 12/8.  It recovered at about 0900 MST 12/9. Probabley frost in the kryton.

Flux profiles: w'kh2o.30m stn0 spiked to .24 at 0800 MST.

TRH: OK

Radiation:
     Absence of pergeometer at lake site causes spikes, and missing values. It affects Rsum lake and the long wave incoming lake site trace.

|Tdome-Tcase|: lake plot also affected by removal of pergeometer.


Tsoil:  Sensors at the tower are noisy because fans are running (they need to be turned off). Tsoil.2.5cm sage still having problems.

Qsoil: Qsoil.c.10cm lake sensor still down. Need to check on next trip to site.

Gsoil:  spikes and glitches in Gsoil.c.10cm.lake

RH: For first two plots, second sensor above ground, between 1:00-12:00, reads more moist (~5%) than the other in all but two of the profiles.
- 43: Status, Site all stns, Fri 06-Dec-2002 13:43:50 MST, Daily status, Dec 6
Pam Power:
  Vbatt: lake down to 12.2 V overnight


Sonics:  OK

krytons: No diurnal variation. kh20.30m is again reading more moist than the other sensors, by about 1 g/m^3.

Scalar variance: OK.

TRH: OK

Radiation:
     Absence of pergeometer at lake site causes spikes, and missing values. It affects Rsum lake and the long wave incoming trace.

|Tdome-Tcase|: lake plot also affected by removal of pergeometer.


Tsoil:  Sensors at the tower are noisy because fans are running (they need to be turned off). Tsoil.2.5cm sage still having problems.

Qsoil: Qsoil.c.10cm lake sensor still down. Need to check on next trip to site.

Gsoil:  spikes and glitches in Gsoil.c.10cm.lake
- 42: Status, Site all stns, Thu 05-Dec-2002 13:15:31 MST, Daily status, Dec 5
Pam Power:
  Vbatt: lake down to 12.2 V overnight


Sonics:  OK

krytons: All sensors show diurnal variation, but to a smaller degree than shown
in previous nights with variation. kh20.30m is reading slightly more moist than the other sensors.

Scalar variance: tc'tc'.2mlake shot up to 1.9 (degC)^2 at about 9 am.

TRH: OK

Radiation:
     Instrument (pergeometer?) was removed caused spikes in places, and missing values in others. It affected net radiation plot and the long wave incoming trace.

|Tdome-Tcase|: also affected by removal of instrument from lake site.


Tsoil:  Sensors at the tower site are up and running. They are noisy because fans are running (they need to be turned off).

Qsoil: Qsoil.c.10cm lake sensor died. Need to check on next trip to site.
       Sensors at tower are up and running.

Gsoil:  spikes and glitches in Gsoil.c.10cm.lake
- 41: Status, Site all stns, Thu 05-Dec-2002 09:32:59 MST, Daily status, Dec 4
Pam Power:
  Vbatt: lake down to 12.3 V overnight


Sonics:  OK

krytons: sensors at 10, 20, and 30 m showed no diurnal variation over night.  The moisture at 2 m dropped significantly at around midnight.

Scalar variance: OK.

TRH: 2m sensor was replaced.

Radiation:
     |Tdome-Tcase| problem at lake should be fixed as of today.


Tsoil:  Sensor at 2.5 cm may be exposed, tracking T-air rather than T-soil.
Gsoil:  spikes and glitches in Gsoil.c.10cm.lake

1/2 hr ave. w'tc': small variations at 15 m (.007), and at 20m (~.14) at 1:00 MST noted.
- 40: Status, Site all stns, Tue 03-Dec-2002 14:24:34 MST, Daily status, Dec 3
Pam Power:
  Vbatt: lake down to 12.4 V overnight


Sonics:  OK

krytons: kh20V 2m tower voltage dropped below 0.  Other sensors read at 0 as a resulst of frost/condensation in the sensor, this is the first time I've seen negative voltage values.  It recovered at around 9 am.

Scalar variance: kh20'kh2o' 2m tower shot up to four over night as a result of the kryton getting wet, or the presence of frost.

TRH: 2m on tower is an outlier.  Should be replaced. New 5 minute T profile
shows sensor error very well.

Radiation:
  Rlw.in.lake is bad. Tdome-Tcase.in.lake averaged 3 degC all night.
  |Tdome-Tcase| for other radiometers is less than 0.5 degC at night.


Tsoil:  Sensor at 2.5 cm may be exposed, tracking T-air rather than T-soil.
Gsoil:  spikes and glitches in Gsoil.c.10cm.lake
- 39: Status, Site all stns, Mon 02-Dec-2002 15:37:21 MST, Daily status, Dec 2
Pam Power:
  Vbatt: lake down to 12.2 V overnight


Sonics:  OK
krytons: OK. Plot of kh20 at 30m was added. Is reading a little high (~4.5-5.0) compared with others (~3.5-4.0). I will keep an eye on it.

Scalar variance: tc'tc'.2m sage was acting up a bit after 9am, Gordon says it appears to be ok.

TRH: 2m on tower is an outlier.  Should be replaced.

Radiation:
  Rlw.in.lake is bad. Tdome-Tcase.in.lake averaged 3 degC all night.
  |Tdome-Tcase| for other radiometers is less than 0.4 degC at night.


Tsoil:  Sensor at 2.5 cm may be exposed, tracking T-air rather than T-soil.
Gsoil:  spikes and glitches in Gsoil.c.10cm.lake

Gordon added profiles of T, Q, Wind spd, w'tc', w'kh20', and u*, to the web site.
- 35: Status, Site all stns, Tue 26-Nov-2002 16:35:36 MST, Daily status, Nov 26
Pam Power:
  Vbatt: lake down to 12.2 V overnight


Sonics:  OK
krytons: OK, presence of frost at night obvious.

TRH: 2m on tower is an outlier.  Should be replaced.

Radiation:
  Rlw.in.lake is still bad, caused by bad Tdome-Tcase.in.lake
  Tdome-Tcase.in.lake averaged 2 degC all night.
  |Tdome-Tcase| for other radiometers is less than 0.4 degC at night.


Tsoil:  Sensor at 2.5 cm may be exposed, tracking T-air rather than T-soil.
Gsoil:  spikes and glitches in Gsoil.c.10cm.lake
- 33: Status, Site all stns, Mon 25-Nov-2002 11:28:32 MST, Daily status, Nov 25
Pam Power:
  Vbatt: lake down to 12.2 V overnight


Sonics:  OK
krytons: OK

TRH: 2m on tower is an outlier.  Should be replaced.

Radiation:
  Rlw.in.lake is bad, probably caused by bad Tdome-Tcase.in.lake
  Tdome-Tcase.in.lake was around 2 degC all night.
  |Tdome-Tcase| for other radiometers is less than 0.4 degC at night.


Gsoil:  spikes in Gsoil.c.10cm.lake
- 27: Kryptons, Site all stns, Thu 21-Nov-2002 10:04:49 MST, Krypton Placement
11/21/02
Krypton placement with respect to CSAT:
Horizontal orientation on all installations:

		From center of CSAT array:
Stn2 (sage)	26cm back	20cm below
Stn3 (lake)	26cm back	20cm below


Tower:
2m   27cm
10m  24cm
20m  24cm
30m  24cm
- 26: Status, Site all stns, Thu 21-Nov-2002 09:56:35 MST, Stn2 / Stn3 Rad Fans / Icing
11/20/02
Turned off fans at Lake:  Noise on Tsoil data eliminated through
			morning.

11/21/02-am
Lake 9:20 local. (no fans)
	Fairly heavy ice/rime on 2 up looking rads and rnet
	A few crystals also on csat but the Krypton appeared clean.
Sage 9:30 local (with fans)
	Heavy ice/rime on rsw.in and rnet.  The rsw.in appeared more crusty
	than at Lake, which may be perhaps worse than simple crystals.
	The rlw.in appeared clean.
	The rsw/rlw.out had a small amount of crystals forming on them.
	Csat had quite a bit of crystals on lower transducers.  Gordon reports
	minimal flagging of the data and it overall looks good.
- 20: Status, Site all stns, Mon 18-Nov-2002 21:10:33 MST, November setup
Nov 18:
  SteveS, Kurt, John, Kyle and Gordon on site.

  PAM stations (sage, lake) reconfigured to send fast data
  over freewaves, and no slow data over GOES.

  Base up, with GPS, UPS, and PPP to Earthlink configured.
  Copying IP address, logbook and netcdf files to Boulder.

  Power laid to main tower, bottom two sonic booms on.

Nov 19:
  Pam stations in good shape - need notes from John.

  Tower:
    Adams up, breezecom's working.
    All TRHs on main tower, but 50Ys covered and without aspiration horns
    Sonics at 1 and 2m, krypton at 2m
    Other sonic booms on tower.
    no radiation
    no snow depth
    webcam operational
- 16: Radiometers, Site all stns, Fri 15-Nov-2002 13:49:33 MST, Grass, Lake, and Sage CR10X code
NOTE: comments in this code may not be up to date
;{CR10}
; PROGRAM: FLOSS02 PLATFORM
; This program is specific to the FLOSS02 platforms. Additional
; sensors have been added to the data collection. A soil profile
; consisting of 3 sets of 2 levels with 2 sensors at each level has been added.
; These new data are multiplexed thru a AM16/32 unit.
; Refer to the information below on wiring.
; NOTE: An additional tsoil has been added to each soil profile
; CR10 CHANNEL ASSIGNMENTS
; ANALOG CHANNELS
; 1H - comm 1H of AM416
; 1L - comm 1L of AM416
; 2H - comm 2H of AM416
; 2L - comm 2L of AM416
;
; 3H - comm 1L of AM16/32 profile 1
; 3L - comm 2L of AM16/32 profile 1
;
; 4H + TP01, Hukseflux sensor
; 4L -
;
; 5H + TP01 heater voltage
; 5L -
;
; PULSE CHANNELS
; P1 - tipping bucket rain input
;
; EXCITATION CHANNELS
; E1 - excitation for T107 probes (H1 comm)
; E2 - excitation for ECHO probes (H2 comm)
; E3 - excitation for T soil probe
; NOTE: E1 and E2 get wired to H1 comm and H2 comm of the AM16/32 units
; CONTROL PORTS
; C1 - reset signal to AM416
; C2 - clock to AM416
; C3 - control to soil moisture CS-615
; C4 - reset signal to all AM16/32
;
; AM416 MULTIPLEXER CHANNELS
; 1-1H + Q7 net radiation
; 1-1L -
;
; 1-2H + LICOR 200-SA
; 1-2L -
;
; 2-1H + PYG_IN thermopile
; 2-1L -
;
; 3-1H + PYG_OUT thermopile
; 3-1L -
;
; 4-1H + PYR_IN (KIP)
; 4-1L -
;
; 5-1H + PYR_OUT (KIP)
; 5-1L -
;
; 2-2H + PYG_IN T_case
; 2-2L -
;
; 3-2H + PYG_IN T_dome
; 3-2L -
;
; 4-2H + PYG_OUT T_case
; 4-2L -
;
; 5-2H + PYG_OUT T_dome
; 5-2L -
;
; 6-1H + level sensor, X
; 6-1L -
;
; 6-2H + level sensor, Y
; 6-2L -
;
; 7-1H + HFT
; 7-1L -
;
; 8-1H Tsoil, refer to CR10X manual
; 8-1L
; 8-2H
; 8-2L
; AM16/32 MULTIPLEXER CHANNELS
; 1-1H T107-1 excitation
; 1-1L T107-1 signal
; 1-2H ECHO-1 excitation
; 1-2L ECHO-1 signal
;
; 2-1H T107-2 excitation
; 2-1L T107-2 signal
; 2-2H ECHO-2 excitation
; 2-2L ECHO-2 signal
;
; 3-1H T107-3 excitation
; 3-1L T107-3 signal
; 3-2H ECHO-3 excitation
; 3-2L ECHO-3 signal
;
; 4-1H T107-4 excitation
; 4-1L T107-4 signal
; 4-2H ECHO-4 excitation
; 4-2L ECHO-4 signal
;
; 5-1H T107-5 excitation
; 5-1L T107-5 signal
; 5-2H ECHO-5 excitation
; 5-2L ECHO-5 signal
;
; 6-1H T107-6 excitation
; 6-1L T107-6 signal
; 6-2H ECHO-6 excitation
; 6-2L ECHO-6 signal
;
; 7-1H T107-Tref excitation
; 7-1L T107-Tref signal
;
; 8-1l + HFT 1
; 8-2L -
;
; 9-1L + HFT 2
; 9-2L -
;
; 10-1L + HFT 3
; 10-2L -
;
; 11-1H T107-7 excitation
; 11-1L T107-7 signal
;
; 12-1H T107-8 excitation
; 12-1L T107-8 signal
;
; 13-1H T107-9 excitation
; 13-1L T107-9 signal
; FLOSS-II OUTPUT MESSAGE FORMAT
; LOGGER ID
; rain (tips per 10 second period)
; Q7
; PYG_IN
; PYG_OUT
; PYR_IN
; PYR_OUT
; PYG_IN Tcase
; PYG_IN Tdome
; PYG_OUT Tcase
; PYG_OUT Tdome
; T107 - 1
; T107 - 2
; T107 - 3
; T107 - 4
; T107 - 5
; T107 - 6
; T107 - 7
; T107 - 8
; T107 - 9
; ECHO - 1
; ECHO - 2
; ECHO - 3
; ECHO - 4
; EHCO - 5
; ECHO - 6
; HFT1
; HFT2
; HFT3
; TP01 senosr
; TP01 heater
; TP01 time 63%
;
; EEROM SPACE USED FOR CALIBRATION COEFFICIENTS
;location value Serial Number description
; 0 0.00 xxxxxx Q7 positive output W/m^2/mV
; 1 0.00 negative output
; 2 xxxxxx PYG in
; 3 xxxxxx PYG out
; 4 xxxxxx PSP in
; 5 xxxxxx PSP out
; 6 35.6 Hxxxxx REBS Heat Flux Transducer, W/m^2/mV
; 7 35.6 Hxxxxx REBS Heat Flux Transducer, W/m^2/mV
; 8 35.6 Hxxxxx REBS Heat Flux Transducer, W/m^2/mV
; 9 xxxx xxxxxx LICOR quantum sensor
; 10 A0 pygin_Tc
; 11 A1
; 12 A2
; 13 A3
; 14 A4
; 15 A0 pygin_Td
; 16 A1
; 17 A2
; 18 A3
; 19 A4
; 20 A0 pygout_Tc
; 21 A1
; 22 A2
; 23 A3
; 24 A4
; 25 A0 pygout_Td
; 26 A1
; 27 A2
; 28 A3
; 29 A4
; SUBROUTINES
;
; sub 1 : Q7 calibration
;
; sub 2 : stienhart equation
;
; sub 3 : stienhart equation
;
; sub 8 : step mulitplexer for soil profile array
; NOTE: the calibation for the ECHO probe is embedded in the
; data collection code, instruction # 12
*Table 1 Program
01: 10 Execution Interval (seconds)
1: Z=F (P30)
1: 1 F
2: 00 Exponent of 10
3: 10 Z Loc [ LoggerID ]
2: Pulse (P3)
1: 1 Reps
2: 1 Pulse Input Channel
3: 2 Switch Closure, All Counts
4: 11 Loc [ rain ]
5: 1.0 Mult
6: 0.0 Offset
; loop thru 416mux to get radiation data
3: Do (P86)
1: 41 Set Port 1 High
4: Do (P86)
1: 9 Call Subroutine 9
5: Volt (Diff) (P2)
1: 1 Reps
2: 4 � 250 mV Slow Range
3: 1 DIFF Channel
4: 12 Loc [ Q7 ]
5: 1.0 Mult
6: 0.0 Offset
6: Beginning of Loop (P87)
1: 0 Delay
2: 4 Loop Count
7: Do (P86)
1: 9 Call Subroutine 9
; get pyg and pyr radiation data
8: Volt (Diff) (P2)
1: 1 Reps
2: 3 � 25 mV Slow Range
3: 1 DIFF Channel
4: 5 -- Loc [ pygi_raw ]
5: 1.0 Mult
6: 0.0 Offset
; get Epply temperature data
9: Volt (Diff) (P2)
1: 1 Reps
2: 5 � 2500 mV Slow Range
3: 2 DIFF Channel
4: 17 -- Loc [ pygin_Tc ]
5: 1.0 Mult
6: 0.0 Offset
10: End (P95)
; end mutliplexer data collection
11: Do (P86)
1: 51 Set Port 1 Low
; convert raw data to calibrated information
; Q7 convert
12: Do (P86)
1: 1 Call Subroutine 1
; convert PYG and PYR data
13: Block Move (P54)
1: 4 No. of Values
2: 5 First Source Loc [ pygi_raw ]
3: 1 Source Step
4: 13 First Destination Loc [ pygin ]
5: 1 Destination Step
14: Scaling Array (A*Loc+B) (P53)
1: 13 Start Loc [ pygin ]
2: 0.0 A1 @@2
3: 0.0 B1
4: 0.0 A2 @@3
5: 0.0 B2
6: 0.0 A3 @@4
7: 0.0 B3
8: 0.0 A4 @@5
9: 0.0 B4
; now convert pyg temps
; convert raw PYGIN Tcase
15: Z=F (P30)
1: 0 F @@10
2: 00 Exponent of 10
3: 50 Z Loc [ V_Vx ]
16: Z=X/Y (P38)
1: 50 X Loc [ V_Vx ]
2: 17 Y Loc [ pygin_Tc ]
3: 50 Z Loc [ V_Vx ]
17: Do (P86)
1: 2 Call Subroutine 2
18: Polynomial (P55)
1: 1 Reps
2: 50 X Loc [ V_Vx ]
3: 50 F(X) Loc [ V_Vx ]
4: 0.0 C0
5: 0 C1 @@12
6: 0 C2 @@13
7: 0 C3 @@14
8: 0.0 C4
9: 0.0 C5
19: Z=F (P30)
1: 0.0 F @@11
2: -3 Exponent of 10
3: 51 Z Loc [ B0 ]
20: Z=X+Y (P33)
1: 50 X Loc [ V_Vx ]
2: 51 Y Loc [ B0 ]
3: 50 Z Loc [ V_Vx ]
21: Do (P86)
1: 3 Call Subroutine 3
22: Z=X (P31)
1: 50 X Loc [ V_Vx ]
2: 17 Z Loc [ pygin_Tc ]
; convert raw PYGIN Tdome
23: Z=F (P30)
1: 0 F @@15
2: 00 Exponent of 10
3: 50 Z Loc [ V_Vx ]
24: Z=X/Y (P38)
1: 50 X Loc [ V_Vx ]
2: 18 Y Loc [ pygin_Td ]
3: 50 Z Loc [ V_Vx ]
25: Do (P86)
1: 2 Call Subroutine 2
26: Polynomial (P55)
1: 1 Reps
2: 50 X Loc [ V_Vx ]
3: 50 F(X) Loc [ V_Vx ]
4: 0.0 C0
5: 0 C1 @@17
6: 0 C2 @@18
7: 0 C3 @@19
8: 0.0 C4
9: 0.0 C5
27: Z=F (P30)
1: 0.0 F @@16
2: -3 Exponent of 10
3: 51 Z Loc [ B0 ]
28: Z=X+Y (P33)
1: 50 X Loc [ V_Vx ]
2: 51 Y Loc [ B0 ]
3: 50 Z Loc [ V_Vx ]
29: Do (P86)
1: 3 Call Subroutine 3
30: Z=X (P31)
1: 50 X Loc [ V_Vx ]
2: 18 Z Loc [ pygin_Td ]
; convert raw PYGOUT Tcase
31: Z=F (P30)
1: 0 F @@20
2: 00 Exponent of 10
3: 50 Z Loc [ V_Vx ]
32: Z=X/Y (P38)
1: 50 X Loc [ V_Vx ]
2: 19 Y Loc [ pygout_Tc ]
3: 50 Z Loc [ V_Vx ]
33: Do (P86)
1: 2 Call Subroutine 2
34: Polynomial (P55)
1: 1 Reps
2: 50 X Loc [ V_Vx ]
3: 50 F(X) Loc [ V_Vx ]
4: 0.0 C0
5: 0 C1 @@22
6: 0 C2 @@23
7: 0 C3 @@24
8: 0.0 C4
9: 0.0 C5
35: Z=F (P30)
1: 0.0 F @@21
2: -3 Exponent of 10
3: 51 Z Loc [ B0 ]
36: Z=X+Y (P33)
1: 50 X Loc [ V_Vx ]
2: 51 Y Loc [ B0 ]
3: 50 Z Loc [ V_Vx ]
37: Do (P86)
1: 3 Call Subroutine 3
38: Z=X (P31)
1: 50 X Loc [ V_Vx ]
2: 19 Z Loc [ pygout_Tc ]
; convert raw PYGOUT Tdome
39: Z=F (P30)
1: 0 F @@25
2: 00 Exponent of 10
3: 50 Z Loc [ V_Vx ]
40: Z=X/Y (P38)
1: 50 X Loc [ V_Vx ]
2: 20 Y Loc [ pygout_Td ]
3: 50 Z Loc [ V_Vx ]
41: Do (P86)
1: 2 Call Subroutine 2
42: Polynomial (P55)
1: 1 Reps
2: 50 X Loc [ V_Vx ]
3: 50 F(X) Loc [ V_Vx ]
4: 0.0 C0
5: 0 C1 @@27
6: 0 C2 @@28
7: 0 C3 @@29
8: 0.0 C4
9: 0.0 C5
43: Z=F (P30)
1: 0.0 F @@26
2: -3 Exponent of 10
3: 51 Z Loc [ B0 ]
44: Z=X+Y (P33)
1: 50 X Loc [ V_Vx ]
2: 51 Y Loc [ B0 ]
3: 50 Z Loc [ V_Vx ]
45: Do (P86)
1: 3 Call Subroutine 3
46: Z=X (P31)
1: 50 X Loc [ V_Vx ]
2: 20 Z Loc [ pygout_Td ]
; here is the new code for the profile stuff
47: Do (P86)
1: 44 Set Port 4 High
; Loop to collect T107 and ECH2O
48: Beginning of Loop (P87)
1: 0000 Delay
2: 6 Loop Count
49: Do (P86)
1: 8 Call Subroutine 8
50: Temp (107) (P11)
1: 1 Reps
2: 5 SE Channel
3: 1 Excite all reps w/E1
4: 21 -- Loc [ T107_1 ]
5: 1.0 Mult
6: 0.0 Offset
; Echo calibration is applied at this instruction
51: Excite-Delay (SE) (P4)
1: 1 Reps
2: 5 2500 mV Slow Range
3: 6 SE Channel
4: 2 Excite all reps w/Exchan 2
5: 1 Delay (units 0.01 sec)
6: 2500 mV Excitation
7: 30 -- Loc [ ECHO_1 ]
8: .0695 Mult
9: -29.0 Offset
52: End (P95)
; pulse AM16/32 forward to HFT stuff, skip Tref
53: Do (P86)
1: 8 Call Subroutine 8
; Loop to collect T107 and ECH2O
54: Beginning of Loop (P87)
1: 0000 Delay
2: 3 Loop Count
55: Do (P86)
1: 8 Call Subroutine 8
56: Volt (Diff) (P2)
1: 1 Reps
2: 3 25 mV Slow Range
3: 3 DIFF Channel
4: 36 -- Loc [ HFT1 ]
5: 1.0 Mult
6: 0.0 Offset
57: End (P95)
; Loop to collect 3 more T107 probes
58: Beginning of Loop (P87)
1: 0000 Delay
2: 3 Loop Count
59: Do (P86)
1: 8 Call Subroutine 8
60: Temp (107) (P11)
1: 1 Reps
2: 5 SE Channel
3: 1 Excite all reps w/E1
4: 27 -- Loc [ T107_7 ]
5: 1.0 Mult
6: 0.0 Offset
61: End (P95)
; turn off AM16/32
62: Do (P86)
1: 54 Set Port 4 Low
; convert HFT data to engineering units
; HFT1
63: Z=X*F (P37)
1: 36 X Loc [ HFT1 ]
2: 0.0 F @@6
3: 36 Z Loc [ HFT1 ]
; HFT2
64: Z=X*F (P37)
1: 37 X Loc [ HFT2 ]
2: 0.0 F @@7
3: 37 Z Loc [ HFT2 ]
; HFT3
65: Z=X*F (P37)
1: 38 X Loc [ HFT3 ]
2: 0.0 F @@8
3: 38 Z Loc [ HFT3 ]
;xxxxxxxxxxxxxxxxxxxxxxxxxxxxxxxxxxxxxxxxxxxxxxxxxxxxxxxxxxxxxxxxxxxxxxxxxxxxxxxxxxx
; now add the code for the Hukseflux TP01 sensor
; Measures the TP01 sensor output, parameter U in manual.
66: Volt (Diff) (P2)
1: 1 Reps
2: 3 25 mV Slow Range
3: 4 DIFF Channel
4: 39 Loc [ U_sen ]
5: 1.0 Mult
6: 0.0 Offset
; Measures the heater voltage, called U_heat in the manual.
; Multiplication by 0.001 to convert to Volts
67: Volt (Diff) (P2)
1: 1 Reps
2: 5 2500 mV Slow Range
3: 5 DIFF Channel
4: 40 Loc [ U_heat ]
5: 0.001 Mult
6: 0.0 Offset
; xxxxxxxxxxxxxxxxxxxxxxxxxxxxxxxxxxxxxxxxxxxxxxxxxxxxxxxxxxxxxxxxxxxxxxxxxxxxxxxxxxxxxxx
; ENTER the calibration interval
; Recommended: every 180 minutes (= 3 hours) start a measurement
; of thermal conductivity and diffusivity
68: If time is (P92)
1: 0 Minutes (Seconds --) into a
2: 180 Interval (same units as above)
3: 30 Then Do
; Copy the reading of the TP01 differential temperature sensor
69: Z=X (P31)
1: 39 X Loc [ U_sen ]
2: 55 Z Loc [ U_sen0 ]
; Put the heater on, control via port 7 and CR10X 12V switch
70: Do (P86)
1: 47 Set Port 7 High
71: End (P95)
; xxxxxxxxxxxxxxxxxxxxxxxxxxxxxxxxxxxxxxxxxxxxxxxxxxxxxxxxxxxxxxxxxxxxxxxxxxxxxxxxxxxxxxx
; 3 minutes (180 seconds) after the heating started,
; the sensor output will be stable, and another measurement is taken.
72: If time is (P92)
1: 3 Minutes (Seconds --) into a
2: 180 Interval (same units as above)
3: 30 Then Do
; Take the sensor output.
73: Z=X (P31)
1: 39 X Loc [ U_sen ]
2: 56 Z Loc [ U_senmax ]
74: Z=X (P31)
1: 40 X Loc [ U_heat ]
2: 57 Z Loc [ U_heatmax ]
; Take the voltage over the heater.
75: Z=X*Y (P36)
1: 57 X Loc [ U_heatmax ]
2: 57 Y Loc [ U_heatmax ]
3: 58 Z Loc [ U_heat_sq ]
; Calculate the mV difference caused due to the heater
76: Z=X-Y (P35)
1: 56 X Loc [ U_senmax ]
2: 55 Y Loc [ U_sen0 ]
3: 59 Z Loc [ U_senamp ]
; Determination of 63% of the signal amplitude.
77: Z=X*F (P37)
1: 59 X Loc [ U_senamp ] ;
2: 0.63 F
3: 60 Z Loc [ U_sen90 ]
; The value to compare with is U_comp.
78: Z=X-Y (P35)
1: 56 X Loc [ U_senmax ]
2: 60 Y Loc [ U_sen90 ]
3: 61 Z Loc [ U_comp ]
; The absolute value to avoid problems with polarity
79: Z=ABS(X) (P43)
1: 61 X Loc [ U_comp ]
2: 61 Z Loc [ U_comp ]
; Turn off the heater, the signal now starts settling down.
80: Do (P86)
1: 57 Set Port 7 Low
; Set the timer for the thermal diffusivity measurement to zero
81: Z=F (P30)
1: 1 F
2: 00 Exponent of 10
3: 62 Z Loc [ timer ]
; This activates the table 2 measurement of thermal diffusivity.
82: Do (P86)
1: 12 Set Flag 2 High
83: End (P95)
; check to see if 63% timer data is available
84: If Flag/Port (P91)
1: 23 Do if Flag 3 is Low
2: 30 Then Do
; set timer data to -9999
85: Z=F (P30)
1: -9999 F
2: 00 Exponent of 10
3: 41 Z Loc [ td_time ]
86: Else (P94)
; clear flag 3 and leave timer data alone
87: Do (P86)
1: 23 Set Flag 3 Low
88: End (P95)
; end of Hukseflux code
;xxxxxxxxxxxxxxxxxxxxxxxxxxxxxxxxxxxxxxxxxxxxxxxxxxxxxxxxxxxxxxxxxxxxxxxxxxxxxx
89: Do (P86)
1: 10 Set Output Flag High
90: Sample (P70)
1: 1 Reps
2: 10 Loc [ LoggerID ]
91: Totalize (P72)
1: 1 Reps
2: 11 Loc [ rain ]
92: Resolution (P78)
1: 1 High Resolution
93: Average (P71)
1: 30 Reps
2: 12 Loc [ Q7 ]
94: Z=F (P30)
1: 0.0 F @@99
2: 00 Exponent of 10
3: 52 Z Loc [ BAUD ]
95: If (X<=>F) (P89)
1: 52 X Loc [ BAUD ]
2: 1 =
3: 1 F
4: 30 Then Do
; PAM at 1200 baud
96: Serial Out (P96)
1: 51 Printer Comma/1200 Baud
97: Else (P94)
; ASTER at 9600 baud
98: Serial Out (P96)
1: 52 Printer Comma/9600 Baud
99: End (P95)
;xxxxxxxxxxxxxxxxxxxxxxxxxxxxxxxxxxxxxxxxxxxxxxxxxxxxxxxxxxxxxxxxxxxxxxxxxxxxx
*Table 2 Program
02: 1 Execution Interval (seconds)
; Every 1 second is needed to get sufficient accuracy for the thermal diffusivity
; measurement.
; Only executed when the heater is has just been switched off.
1: If Flag/Port (P91)
1: 12 Do if Flag 2 is High
2: 30 Then Do
; timer one second incremented
2: Z=Z+1 (P32)
1: 62 Z Loc [ timer ]
; Measures the TP01 sensor output .
3: Volt (Diff) (P2)
1: 1 Reps
2: 3 25 mV Slow Range
3: 4 DIFF Channel
4: 63 Loc [ U_sen_ab ]
5: 1.0 Mult
6: 0.0 Offset
4: Z=ABS(X) (P43)
1: 63 X Loc [ U_sen_ab ]
2: 63 Z Loc [ U_sen_ab ]
; Compare the sensor output to the 37% value
5: If (X<=>Y) (P88)
1: 61 X Loc [ U_comp ]
2: 3 >=
3: 63 Y Loc [ U_sen_ab ]
4: 30 Then Do
; The timer information is stored in td_time
; Now we know how much time it took to resettle.
6: Z=X (P31)
1: 62 X Loc [ timer ]
2: 41 Z Loc [ td_time ]
; ready again for new measurement instruction.
7: Do (P86)
1: 22 Set Flag 2 Low
; set flag to trigger output signal in program 1
8: Do (P86)
1: 13 Set Flag 3 High
9: End (P95)
10: If (X<=>F) (P89)
1: 62 X Loc [ timer ]
2: 3 >=
3: 0.0 F @@50
4: 30 Then Do
; The thermal diffusivity is set to zero, because too much time has passed
; before return to the original value.
11: Z=F (P30)
1: 0 F
2: 00 Exponent of 10
3: 41 Z Loc [ td_time ]
; Ready again for new measurement instruction
12: Do (P86)
1: 22 Set Flag 2 Low
; set flag to trigger output signal in program 1
13: Do (P86)
1: 13 Set Flag 3 High
14: End (P95)
15: End (P95)
;xxxxxxxxxxxxxxxxxxxxxxxxxxxxxxxxxxxxxxxxxxxxxxxxxxxxxxxxxxxxxxxxxxxxxxxxxxxxx
*Table 3 Subroutines
1: Beginning of Subroutine (P85)
1: 1 Subroutine 1
; calibrate value of net rad based on sign
2: IF (X<=>F) (P89)
1: 12 X Loc [ Q7 ]
2: 4 <
3: 0 F
4: 30 Then Do
3: Z=X*F (P37)
1: 12 X Loc [ Q7 ]
2: 0 F @@1
3: 12 Z Loc [ Q7 ]
4: Else (P94)
5: Z=X*F (P37)
1: 12 X Loc [ Q7 ]
2: 0 F @@0
3: 12 Z Loc [ Q7 ]
6: End (P95)
7: End (P95)
8: Beginning of Subroutine (P85)
1: 2 Subroutine 2
; compute x = ln[(V/Vx) - 1] / 1000
9: Z=X+F (P34)
1: 50 X Loc [ V_Vx ]
2: -1 F
3: 50 Z Loc [ V_Vx ]
10: Z=LN(X) (P40)
1: 50 X Loc [ V_Vx ]
2: 50 Z Loc [ V_Vx ]
11: Z=X*F (P37)
1: 50 X Loc [ V_Vx ]
2: .001 F
3: 50 Z Loc [ V_Vx ]
12: End (P95)
13: Beginning of Subroutine (P85)
1: 3 Subroutine 3
; finish T (case/dome) computation
14: Z=1/X (P42)
1: 50 X Loc [ V_Vx ]
2: 50 Z Loc [ V_Vx ]
15: Z=X+F (P34)
1: 50 X Loc [ V_Vx ]
2: -273.15 F
3: 50 Z Loc [ V_Vx ]
16: End (P95)
17: Beginning of Subroutine (P85)
1: 8 Subroutine 8
18: Do (P86)
1: 75 Pulse Port 5
19: Excitation with Delay (P22)
1: 1 Ex Channel
2: 0000 Delay W/Ex (units = 0.01 sec)
3: 1 Delay After Ex (units = 0.01 sec)
4: 0000 mV Excitation
20: End (P95)
21: Beginning of Subroutine (P85)
1: 9 Subroutine 9
; pulse the AM416 multiplexer to the next bank of channels
22: Do (P86)
1: 72 Pulse Port 2
23: Excitation with Delay (P22)
1: 1 Ex Channel
2: 0 Delay W/Ex (units = 0.01 sec)
3: 1 Delay After Ex (units = 0.01 sec)
4: 0 mV Excitation
24: End (P95)
End Program
-Input Locations-
1 ACTIVE 1 0 0
2 TimeHack 1 0 0
3 Tref 1 0 0
4 _________ 1 0 0
5 pygi_raw 1 6 1
6 pygo_raw 1 5 0
7 pyri_raw 1 5 0
8 pyro_raw 1 5 0
9 _________ 1 0 0
10 LoggerID 1 1 1
11 rain 1 1 1
12 Q7 5 9 6
13 pygin 15 1 2
14 pygout 11 1 2
15 pyrin 11 1 2
16 pyrout 27 1 2
17 pygin_Tc 9 1 2
18 pygin_Td 9 1 1
19 pygout_Tc 9 1 1
20 pygout_Td 9 1 1
21 T107_1 9 2 1
22 T107_2 9 2 0
23 T107_3 9 2 0
24 T107_4 9 2 0
25 T107_5 9 2 0
26 T107_6 9 2 0
27 T107_7 15 1 1
28 T107_8 11 1 0
29 T107_9 27 1 0
30 ECHO_1 25 2 1
31 ECHO_2 9 1 0
32 ECHO_3 9 1 0
33 ECHO_4 9 1 0
34 ECHO_5 9 1 0
35 ECHO_6 31 1 0
36 HFT1 9 1 2
37 HFT2 25 1 1
38 HFT3 9 0 1
39 U_sen 1 2 1
40 U_heat 1 1 1
41 td_time 1 0 3
42 _________ 0 0 0
43 _________ 0 0 0
44 _________ 0 0 0
45 _________ 0 0 0
46 _________ 0 0 0
47 _________ 0 0 0
48 _________ 0 0 0
49 _________ 0 0 0
50 V_Vx 1 21 21
51 B0 1 4 4
52 BAUD 1 1 1
53 _________ 0 0 0
54 _________ 0 0 0
55 U_sen0 1 1 1
56 U_senmax 1 2 1
57 U_heatmax 1 2 1
58 U_heat_sq 1 0 1
59 U_senamp 1 1 1
60 U_sen90 1 1 1
61 U_comp 1 2 2
62 timer 1 2 2
63 U_sen_ab 1 2 2
-Program Security-
0000
0000
0000
-Mode 4-
0
1
2
3
4
5
6
7
8
10
11
12
13
14
15
16
17
18
19
20
21
22
23
24
25
26
27
28
29
50
99
-Final Storage Area 2-
0
- 11: Kryptons, Site all stns, Mon 11-Nov-2002 09:36:00 MST, Krypton Cals
krypton		path		V0		Kw

1101		2.6		-0.1270443	666.8774800

1389		2.6		-0.1457689	753.3314535

1391		2.6		-0.1414481	1078.4729713

1392		2.6		-0.1370274	502.1903044

1394		2.6		-0.1395649 	1036.5063415

1395		2.6		-0.1418386	1262.7934824

1397		2.6		-0.134113	590.245198
- 7: Soil, Site all stns, Mon 14-Oct-2002 10:02:32 MDT, FLOSS02 soil sensors
On Thurs, 10 Oct''02 Tony and John visited the FLOSS site
The Echo soil sensors at Sage, Lake and Grass were reinstalled.
They had been installed horizontally the previous week and had been watered
to help them meld into the soil. This melding was apparently sucessful at
Sage and Lake, where the soil was suitable, but not so sucessful at Grass,
where the soil was actually peat.

The Echo probes were reinstalled vertically, with their midlines at the
designated depths of 5 cm and 10 cm. They were positions at right angles
to each other with ~12cm between their cabled ends.


Sage  A 1 @  5cm
      A 2 @ 10cm
Sage  B 3 @  5cm
      B 4 @ 10cm
Sage  C 5 @  5cm
      C 6 @ 10cm
Each set of Echo probes waterd with 1 gallon


Lake  A 1 @  5cm
      A 2 @ 10cm
Lake  B 3 @  5cm
      B 4 @ 10cm
Lake  C 5 @  5cm
      C 6 @ 10cm
Each set of Echo probes watered with 1 gallon


Grass A 1 @  5cm (It is possible that A1 is actually at 10cm)
      A 2 @ 10cm (It is possible that A2 is actually at  5cm)
Grass B 3 @  5cm
      B 4 @ 10cm
Grass C 5 @  5cm
      C 6 @ 10cm
Each set of Echo probes watered with 2 gallons
- 3: Soil, Site all stns, Fri 11-Oct-2002 14:48:08 MDT, Soil Echo Probes Rotated to Vertical
10/10/02

Soil Echo Probes Rotated:
from Horizontal to Vertical orientation at Sage/Lake/Grass.
Water was dumped on to help bed the sensors in.  Tony said they already
were looking good in that respect.

The logger cable was added to the Lake site.  Both Sage/Lake are now reporting
data through goes.
- 1: Soil, Site all stns, Tue 08-Oct-2002 08:48:09 MDT, Installation of soil sensors
On 2 Oct''02 the locations for the soil sensors for Grass, Sage and Lake
 soil sensor arrays were chosen by Tony, Steve O and Jielun.
Tony installed the sensors at Grass and Sge on 2 Oct and installed the
sensors at Lake on the 3 Oct. After installation the sensors were wetted down
with approximately 6 liters of water to "bed them in". It is anticipated that
given another month of warm weather the local soil moisture will come to
equilibrium before the start of the program in December.
For the schematic of the placement see
| | | | | | | | |
|
|
|