The Graphics Window
Graphics windows are used to display data. The ISS has a pre-configured set of displays which can be chosen from the menu under the DISPLAY icon. The menu choices provide a preset combination of data displays; these entries should be self-explanatory. A typical graphics window, in this case displaying radiation measurements from the surface met station, looks like that shown in Figure 1-4.
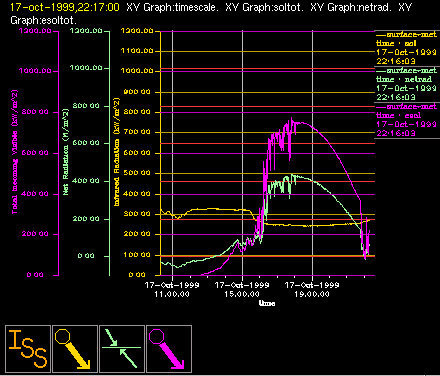
All of the graphics windows have similar icons in the lower left corner. The icon labelled ISS is used to control those things which apply to the complete window, such as a vertical scale or a time scale. The ISS menu also contains choices which allow you to add new data fields to the graph. Often the choices in this menu will be marked with an arrow, indicating the presence of a submenu.
Each data field (such as temperature or relative humidity) being displayed in a graphics window will also show an icon in the lower left corner of the graphics window, with the symbol representing the type of data to which it corresponds. The color of this data icon will also be same as the color of the plot trace on the graph. Usually you will have two menu choices in each data icon:
- Left Mouse Button
Allows you to change data scales, the symbol plotted, and other plot characteristics. Some choices cause a box to pop up with fields into which you can enter numbers.
- Right Mouse Button
This menu presents a list of older data that can be plotted. Highlight the data that you want to see and it will be plotted in the window. This causes the window to go into history mode. Notice that the time in the upper left corner of the window has turned yellow. When in this mode, the graph will not change when new data arrive. To put the window back into real time mode, pop up the right button menu from the icon and choose real time mode. The time in the upper left corner will become white, indicating the graphics window is in real-time mode and new data will be plotted as they arrive.

Leave graphics windows in real time mode so that new data are plotted as they are received by the ISS. Also, if you are not actively viewing data, you can keep the display from becoming too crowded by selecting the blank display from the top of the Iconbar DISPLAY menu.