Zdr is the difference between the two co-polar reflectivities (Zdr = dBZH - dBZV). Since each of the two co-polar reflectivites is known only to (optimistically) the nearest half dB, there is a potential for a large bias in Zdr. The bias is determined through measuring Zdr in light rain while the radar is pointed vertically. Under such conditions, all rain or snow should appear spherical, and the Zdr values measured should also be zero (note: the antenna is rotated while pointing vertically to remove any effects due to particle alignment or non-zero canting angles). Note that this technique implicitly presumes a cross-beam uniformity in hydrometeors, and will not provide any insight to beam mis-match between polarizations, or any other information about beam patterns.
Any bias observed in the measured Zdr is removed in real-time using a constant bias correction. For DYNAMO, a uniform Zdr bias of -0.285 was added to all originally measured Zdr values. This bias value was used for the duration of the project, although there is some potential for re-evalutation and recomputation for generation of the final data set.
Note also that removal of bias does nothing to remove statistical noise in the determination of Zdr. Individual Zdr values may still be somewhat innacurate, limited by sampling error.
Alternative techniques exist for determining or monitoring Zdr bias. Hubbert, et al. (2003) report on use of a Cross-Polar Power technique for estimating Zdr bias (such determinations were made in DYNAMO, but results were less consistent than the vertical pointing technique, and will need refinement). Solar calibrations may be used to monitor bias drift.
Date Time ngates mean mode median std_dev Dixon
Determination
20110928 093614 454 0.291 -0.007 0.266 0.58
20110928 094003 915 0.287 0.376 0.269 0.47
20110930 054807 10877 0.219 0.192 0.219 0.16
20110930 055155 34702 0.240 0.230 0.240 0.11
20110930 055546 34185 0.236 0.216 0.237 0.11
20110930 055934 34008 0.237 0.251 0.240 0.12
Polarization switch changed-out, 10/2
20111004 114447 7098 0.278 0.232 0.277 0.28 0.284 *
20111004 114836 748 0.290 0.270 0.270 0.32
20111010 094820 7280 0.276 0.268 0.271 0.18 0.291 *
20111016 061043 91932 0.291 0.323 0.291 0.20 0.302 *
20111016 061432 5944 0.277 0.252 0.278 0.20
20111021 134120 2 n.g.
20111023 105359 124 n.g.
20111023 105748 0 n.g.
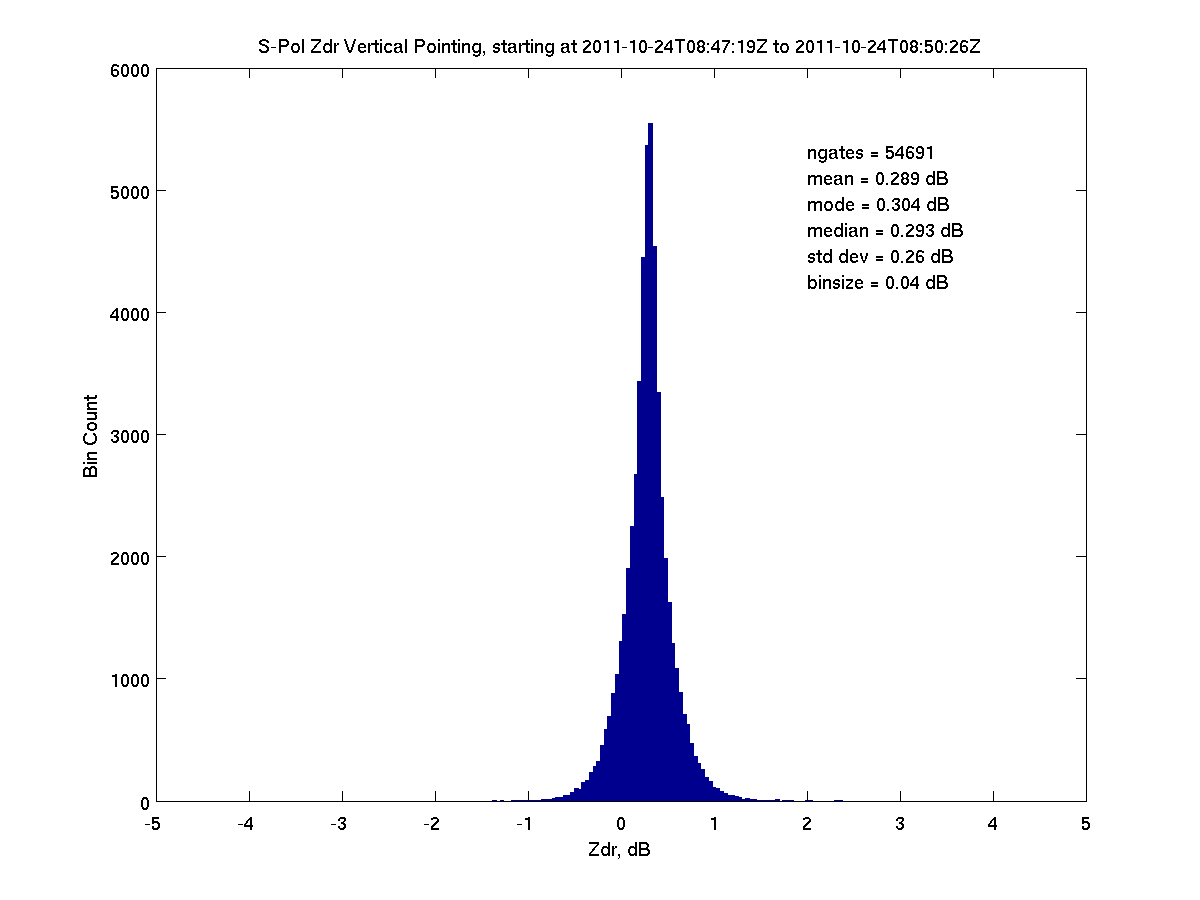
20111024 084719 54691 0.289 0.304 0.293 0.26 0.306 *
20111102 112801 814 0.362 0.050 0.345 1.02 0.282 poor
20111111 055014 6064 0.303 0.126 0.284 0.41 0.288 bad mode value
20111111 055403 545 0.332 0.260 0.299 0.49
20111111 060954 94 n.g.
20111114 064525 33032 0.275 0.310 0.277 0.25 0.291 *
20111114 064913 7517 0.275 0.298 0.273 0.24
20111202 092435 30601 0.289 0.306 0.290 0.14 0.321 *
20111202 092824 7903 0.296 0.280 0.297 0.14
20111208 130024 25862 0.289 0.298 0.289 0.32 0.314 *
20111208 130413 25863 0.290 0.300 0.285 0.33
20111208 130801 24887 0.292 0.299 0.294 0.34
20111208 131150 16066 0.287 0.305 0.286 0.36
20111209 130138 14667 0.280 0.293 0.276 0.24
20111209 130526 28659 0.268 0.264 0.272 0.15 0.278 *
20111209 130915 29950 0.268 0.291 0.269 0.14
20111209 131304 10627 0.269 0.279 0.271 0.14
20111226 114205 17 n.g.
Polarization switch replaced
20111226 114338 17 n.g.
20120115 002204 81413 0.305 0.321 0.310 0.22 0.327 *
20120115 002552 83976 0.305 0.333 0.311 0.23
20120115 002941 5195 0.311 0.310 0.310 0.26
Mean of selected values: 0.2844 0.3016
Std dev, selected vals: 0.0112 0.0169
Max - Min, selected val: 0.0370 0.0490
* indicates row data that were used as selected values.
There are multiple techniques within EOL/RSF for computing Zdr bias from vertical pointing. Each technique may use a slightly different data stream, or apply different screening criteria to the input data. All techniques produce results that are within a few hundredths of a dB of each other. Shown in the table, above, are the results by both Rilling and Dixon. The Dixon computation referenced in the table uses a reprocessing of the vertical pointing time series data, and (perhaps) incorporates too much data near the radar; LDR thresholds are fairly restrictive. Full results for the Dixon work are available here.
The Rilling results use the following criteria:
Within the table provided, above, a given set of results was ingored if there were too few points used in the computation, or if the distribution was highly skewed (the mode was not approximately the same as the mean). Only one determination was used from a given set of runs, to avoid biasing results toward a sequence that had many repeat attempts.
Zdr histograms were generated using Matlab code. The code reads uncorrected field data directly from disk, applies appropriate spatial and gross signal quality filtering, and generates plots.
The zdr_bias_dynamo.m routine is
available here.
Subroutines may be found in this directory.
Histograms for almost all vertical pointing attempts may be found here.
