Despite everyone's best attempts at radar system calibration, there often remain differences in computed reflectivity between any two radars. This is certainly true of the radars fielded for DYNAMO. Some of these differences are undoubtedly due to sampling differences, while others may be due to uncertainties in calibration. Inter-radar calibration allows us to characterize these differences, but does not allow determination of which radar might be "right", unless there is an inter-comparison standard.
Here, two types of comparison between SMART-R and S-Pol will be detailed, and (currently) unsupported notes from a TRMM-PR/S-Pol (S-band) comparison is made available.
The following are considered relavant factors when doing a reflectivity comparison between S-Pol and SMART-R:
It was desired to do as careful a comparison between S-Pol and SMART-R as possible. Processing of the data streams was limited to the minimum required, and scans were selected to be as well-matched as possible. In consideration of the SMART-R platform tilt, it was found that the SMART-R 1-degree elevation scan very closely matched the S-Pol 1.5 degree elevation scan for a particular eastern sector (the unblocked sector over the ocean). Analysis of scan timing showed that these two scans agreed to within 45 seconds of each other, but only for the volume scans that started at approximately 30 minutes after each hour. For the two types of comparisons performed, the various areas of consideration are shown in the following figure:
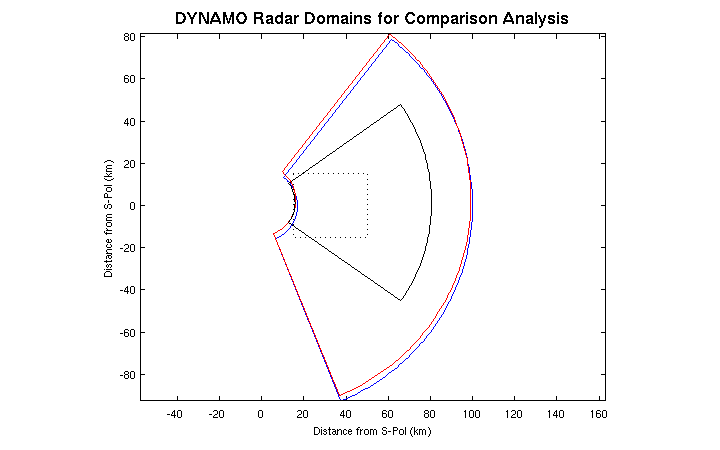
Within the figure,
For the small sector, radar elevation angle varied from about 1.4 deg to 1.7 deg for SMART-R (the tilt-corrected elevation angle), and was very constant at 1.5 degrees (+/- .02) for S-Pol.
The area-weighted average rain rate over the larger eastern sectors was computed for each radar as a function of time. These rain rates were based on reflectivity, only, using the MISMO relationship. An example for a UTC day with significant precipitation is shown:
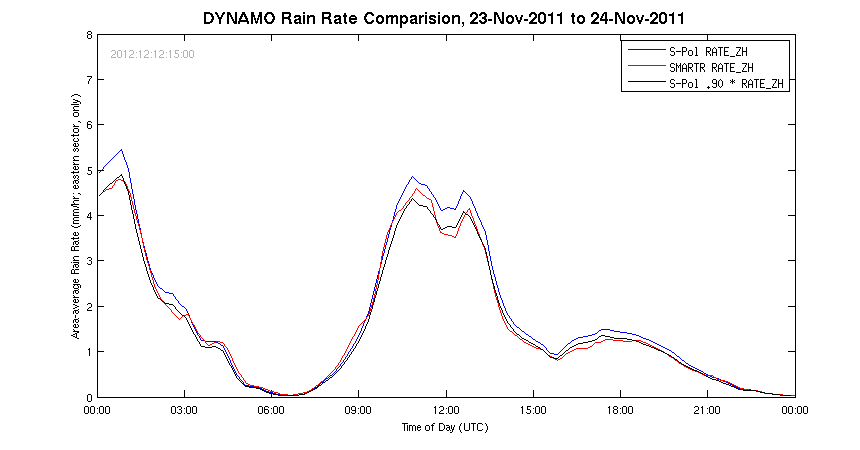
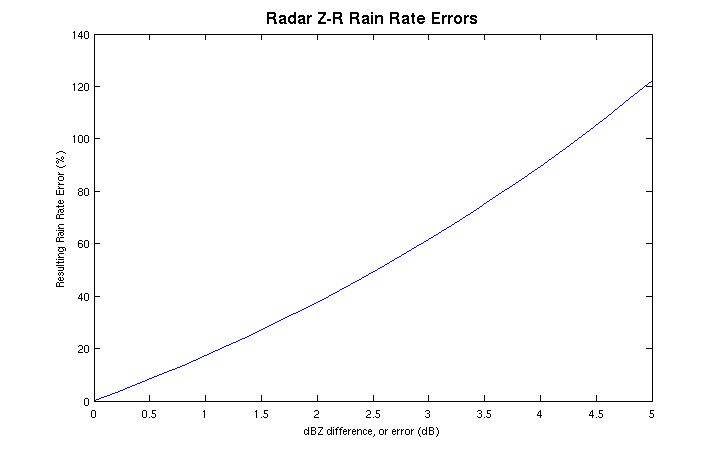
The comparison shows that SMART-R compares very well with an adjusted value of the S-Pol rate. An adjustment of 10% to S-Pol produces an almost exact match to SMART-R. Review of comparisons for other days shows that S-Pol precip rates are generally about 5 to 10% higher than SMART-R. There are also periods where SMART-R precip rate is greater than S-Pol's, and short periods when SMART-R is considerably below S-Pol, possibly reflecting issues associated with SMART-R attenuation correction. A 5% difference in precip rates corresponds to a 0.3 dB offset in reflectivities; a 10% difference is a 0.6 dB offset (see last section on this page for details). Using area integrated precip rates as a proxy, it can be concluded that the calibrations of the two radars differ, on average, by only a small amount.
A full set of figures is available for DYNAMO from 02-Oct-2011 through 31-Dec-2011 (there was very little precip in January, and January is not inlcuded). The figures are organized with a structured viewer, and are available here.
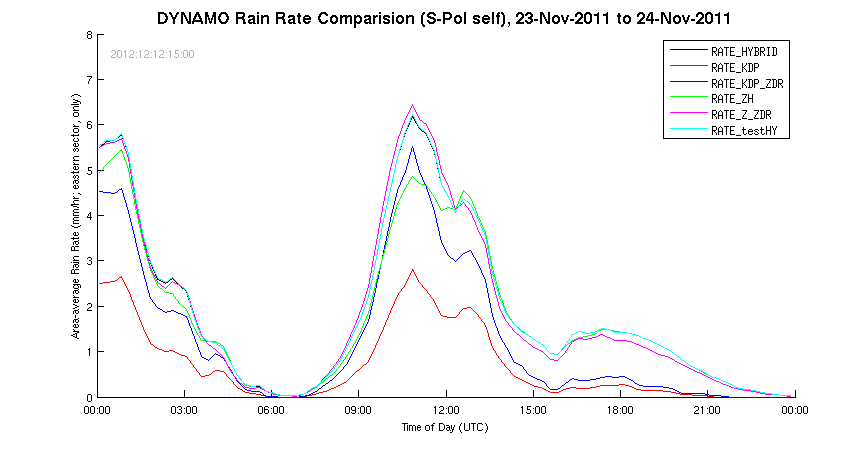
Multiple precip rate estimates are available from S-Pol. These rates are computed not just from radar reflectivity, but from polarimetric variables, or combinations of variables. A full list is provided in the section on Radar Rain Rates. The various S-Pol estimates of rain rate can differ considerably from each other, and there is uncertainty concerning which estimate might be the "best" estimate under what conditions (e.g., stratiform vs convective regimes, very high or very low rain rates, etc.). Additional work needs to be done on this topic.
The time history of the various S-Pol rain rates is shown for the same period as the preceeding figure:
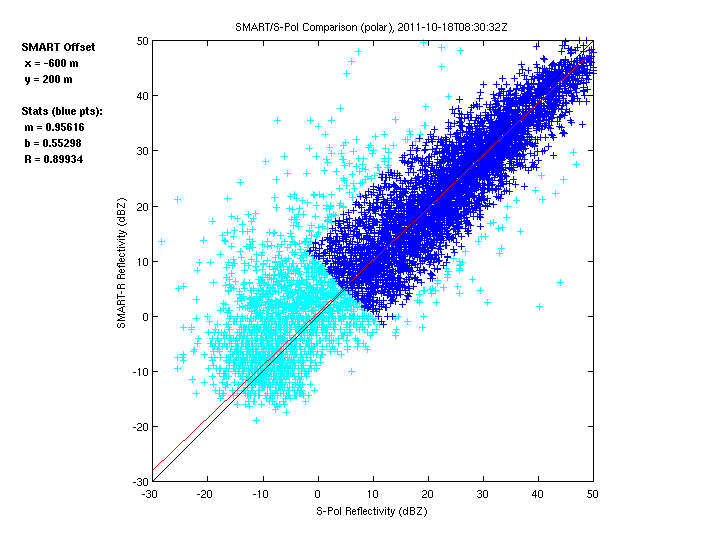
SMART-R and S-Pol reflectivities have been compared through the traditional method of generating scatter plots. Individual comparisons were made for very carefully selected, single radar scans over a moderately extensive geographic area (see small sector in first figure, outlined in black). Advection corrections were made to each set of scans to account for echo motion. Results are reasonable, but do vary somewhat on a period-by-period basis. See notes, below, concerning issues that might make scatter plot analysis somewhat inappropriate.
For a case where reflectivity values are somewhat equally occuring throughout the geographic domain, we have scatterplots similar to this:
A full collection of the polar-coordinate scatter plots is available (unstructured information). Note that a full evaluation and analysis will be forthcoming over the next few months.
The best-fit line to the scattered data were found using the following restrictions:
Note that the scatter plots include all paired points, but that the statistics and the line of best fit were produced for the filtered data. The points used to compute the line of best fit are shown in dark blue; cyan points are those points that were eliminated by one of the filter tests, noted above.
Analyses for the various dates/times of comparison are available in dated subdirectories (or, on dated sub-pages). The information is structured using JavaScript; summaries may be found linked to the times in this table:
The following sets of scatter plots are available:
There is currently nothing but preliminary information created by "Frank" in the field. See the directory.
It is obviously incorrect to analyze reflectivity scatterplots to determine differences in radar calibration. Radar calibration considers the response of the radar receiver to input or received power, but reflectivity adds a range-correction to a power value. A given reflectivity for one radar may be derived from many different power values, range-adjusted differently to give that same reflectivity value. Logically, if there is a calibration error, there should be increased scatter in our data points due to this effect. The proper way to do a reflectivity comparison over a large areal domain, would be to first un-do the range correction to the reflectivity values, then do a pseudo-reflectivity comparison. However, this can only work if the radars are co-located (and therefore, the range correction to each comparison point is the same for each radar).
The SMART-R and S-Pol radars were fairly close together for DYNAMO, making it worthwhile to investigate comparison of non-range corrected pseudo reflectivities. An analysis performed for a few of the chosen time periods shows some improvement in correlation, but the improvement is not considered significant in most cases (few differences were found either in slope or adjusted offset). This likely is an indication of the statistical nature of the "noise" introduced by using range-corrected reflectivity, and the fact that the reflectivity comparison data are noisy enough to begin with. There should be more consideration given to this issue.
Using the MISMO relationship, a simple calculation is used to produce the following figure; using the graph, rainrate differences can be converted into likely reflectivity calibration offsets (and vice-versa). See the Matlab code rainrate_zr.m for details.
Matlab code for these analyses is available in this directory. Code is "as is", and is generally unsupported.
