It is desired to estimate the reflectivity sensitivity of the Ka-band radar with changes in radar range. The sensitivity is easily calculated from calibration quantities of the system, particularly the radar constant and the system minimum detectible signal (MDS). In the case of the Ka wavelength, we also require an estimate of atmospheric attenuation with range. Verification of the sensitivity can be made through analysis of actual received low-power signals using SNR thresholding.
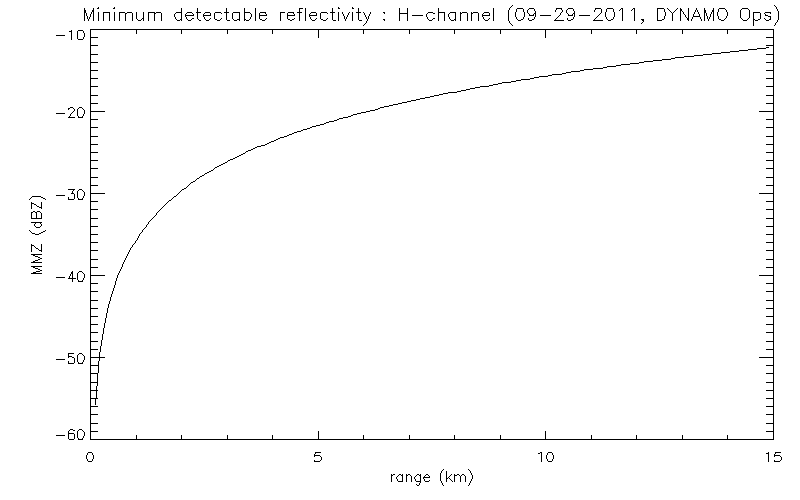
Since the Ka calibration changed over the course of the DYNAMO project, there were also small changes in the Ka sensitivity. Please review the table of calibration parameters.
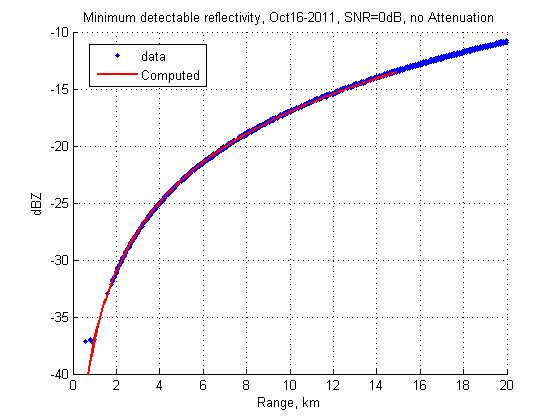
This first plot is system sensitivity vs range without regard to attenuation. Results are considered representative of the "ops" set of calibration parameters shown in the calibration table (see previous link, first table column).
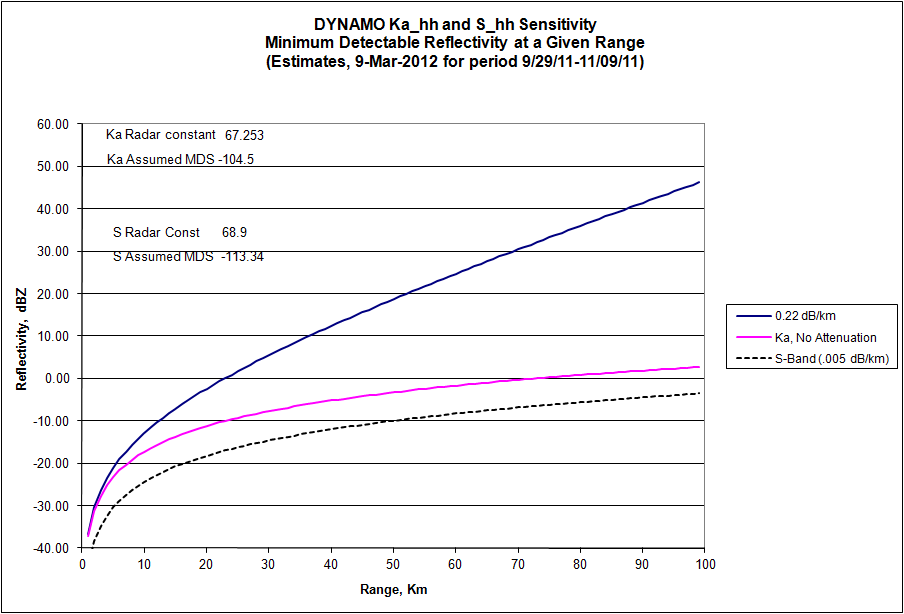
A somewhat less accurate plot of sensitivity is shown, below. This graph goes further out in range, and also includes a line that incorporates a rough estimate of atmospheric attenuation for the Ka band. The S-band sensitivity is also shown for comparision. This plot was generated using MicroSoft Excel spreadsheet, with the xlsx available, here. (A pdf document of data for this plot is also available.)
A comparision plot of Ka values thresholded on SNR of -0.1 to +0.1 is also provided. This plot compares the engineer estimated sensitivity to what was actually observed for a set of scans during the project.