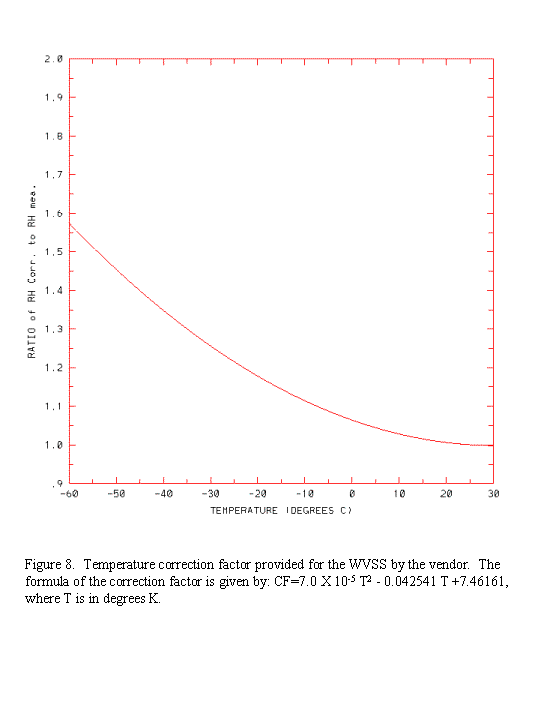
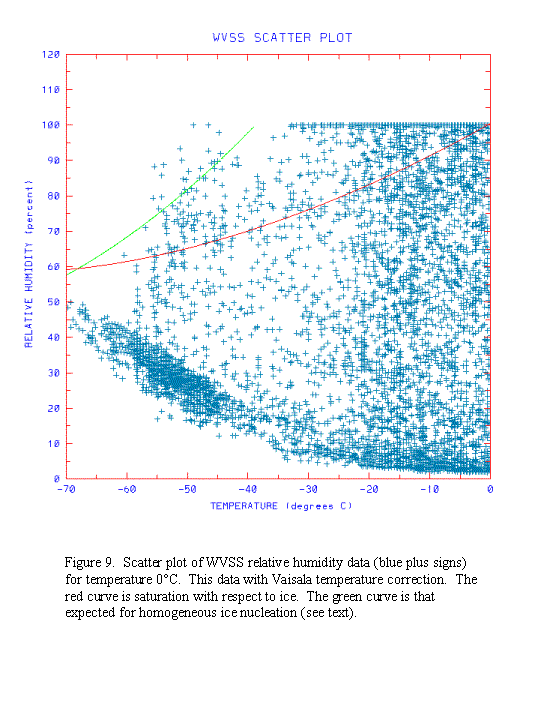
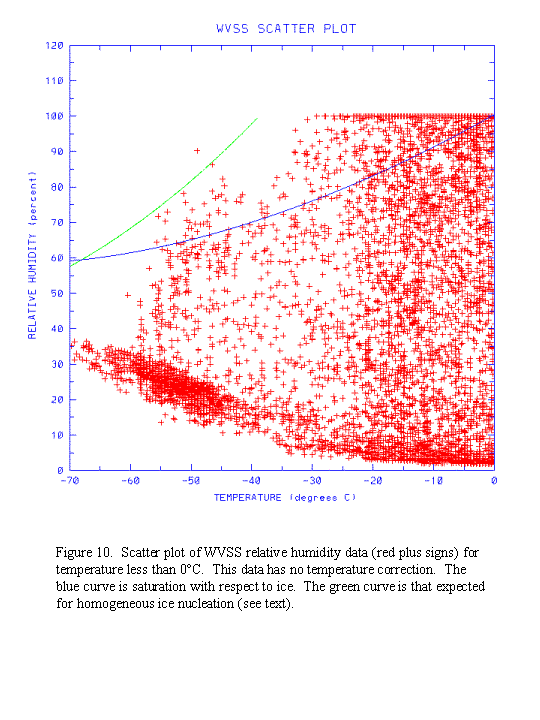
The Vaisala temperature correction shown in Figure 8 was applied to the measured RH in the heated probe. The effect was small but clearly made the results too wet. Figure 9 shows a histogram of results in 11 604 values obtained in February and March of 1998. Figure 10 shows the same histogram with Vaisala temperature correction removed. We clearly see that the temperature correction removal was necessary. The temperature correction is not required on the aircraft. Figure 9 has many points substantially higher than would be expected [compare the green curve, which represents a theoretical limit for values of RH at such cold temperatures, as suggested by Heymsfield and Miloshevich (1995)].
The Vaisala radiosonde software automatically reduces the RH to 100% if it is greater than 100% (due to sensor wetting, voltage spike, temperature correction, etc.) The WVSS-I software does the same. With the Vaisala temperature correction included, the number of RH values at 100% was 2780 (of the 11 604). Now most of this data was in the lowest saturated layers, but this number is too high. The number of values of RH=100% with temperature correction removed was about 10% less. The overall effect of removing the temperature correction was to reduce the average RH of all samples from 57.52% to 55.00%. The average mixing ratio reduction was from 2.62 × 10⁻³g/kg to 2.38 × 10⁻³g/kg (about a 9% reduction).
The removal of the temperature correction effect has to be performed on the ground because it was imbedded in the AlliedSignal DFDAU software. Equations to remove this effect were provided by the lead author to the Forecast Systems Laboratory at NOAA. All data obtained from the Internet after 5 May 1999 is considered good data (subject to further evaluation). Data obtained from the Internet before this date will be too wet by a factor of 10% of signal, and may also have dewpoints greater than temperature because RH was not limited to 100% as in the Vaisala software.