Precipitation
Cloud ice and small precipitation particles were imaged with a PMS optical array probe (OAP) providing two-dimensional shadow images of particles with a vertical window height of 0.8 mm (2D-C). This probe produces shadow images of precipitation-size particles with 0.2 mm resolution.
(Please click on the thumbnails of the pictures to view a full resolution image. You should be able to use your "Back" button to bring you back to this page.)
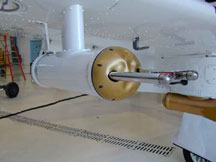
Figure 8. PMS OAP-2D-C probe under right wing.
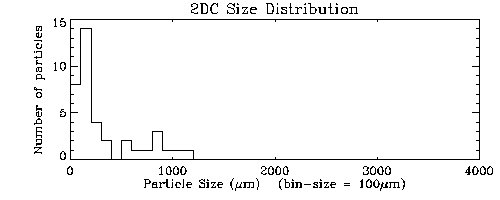
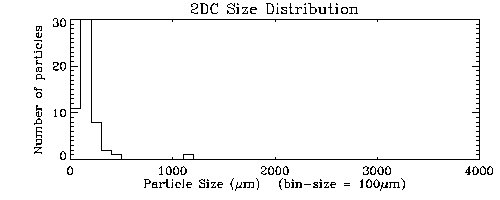
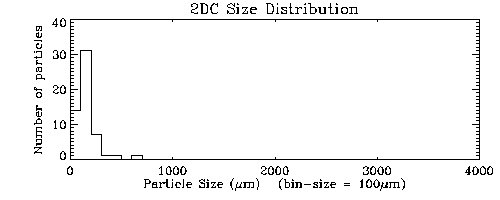
A brief discussion of the probe is given in Detwiler and Hartman (1991). This probe performed very well during the project. An example of the recordings for the flight on June 29, 2000, is shown in Figure 1, and the particle size distribution for each shown buffer is displayed in Figure 2 (a, b, c, d).
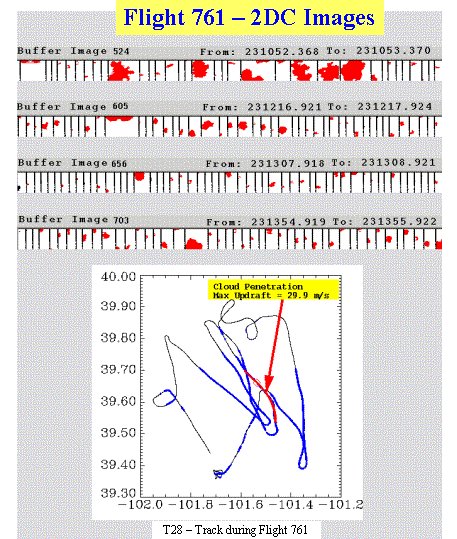
Figure 9: 2DC images recorded during flight 761 (June 29, 2000). The red arrow shows the portion of the T-28 flight track where these 2DC images were collected.
(a) Buffer 524
(b) Buffer 605

(c ) Buffer 656
(d) Buffer 703
Figure 10: Particle size distribution for the buffers shown in Figure 9.
Larger precipitation particles were imaged and counted by the custom-built Optical Array Hail Spectrometer, sensitive to particles between 0.9 mm and 12 cm in diameter. Automated counting and sizing circuitry includes only particles in the size range 4.5 mm to 4.5 cm. The probe performed well during the project, except during descent. It is not de-iced, and descent from cooler to warmer layers of the atmosphere caused condensation on the windows and loss of data. An example of HVPS images during Flight 761 is shown in Figure 12 below.
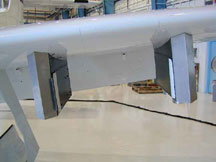
Figure 11: Optical array hail spectrometer.

Figure 12: Sample image records from the hail spectrometer.
Additional information on large particles can be inferred from the flight videotape from a camera mounted under the right wing of the airplane. One of the two audio channels records output of a microphone mounted on the front windscreen. Mushy hailstones produce muffled sounds, while hard hailstones sound almost like a hammer hitting the windscreen.
The High-Volume Particle Sampler (HVPS) instrument was acquired just prior to STEPS and installed on the T-28 under the right wing. It was specially modified by attaching 2 segmented plates between the main arms of the probe. Signals from these plates can be used to estimate electric charge on hydrometeor.
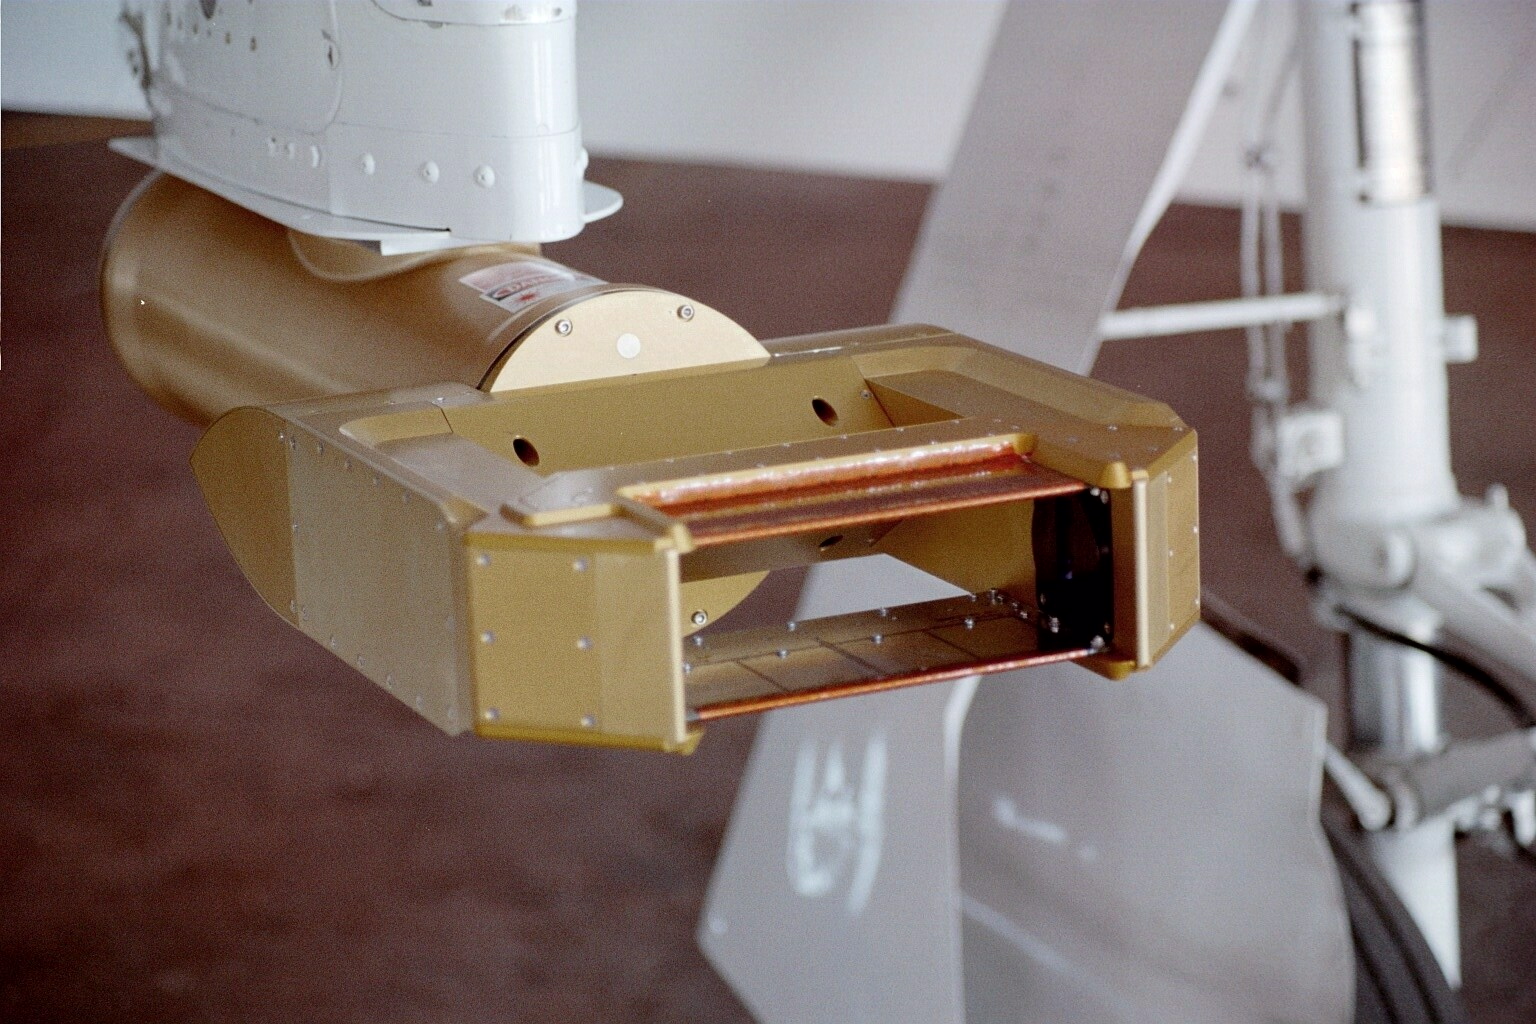
Figure 13: SPEC HVPS
The HVPS images precipitation size particles. It operates by taking a two-dimensional shadow digital picture of the particles that pass through a 4.5 x 20.3 cm laser light plane that is normal to the direction of aircraft flight. The sheet of light is imaged onto a linear array of 256 photo-elements. The HVPS has 200 mm pixel resolution when measured across the array. In order to keep the pixel resolution along the flight path constant, the system clock frequency is adjusted according to the detected True Air Speed (TAS) by the data system itself. Due to limitations on the rate at which data from the array can be scanned and recorded, image pixels are 800 mm along the direction of flight.
In addition to particle image recording, the HVPS recorded charge on the segmented plates. The charge probe has 8 charge amplifiers that are each sampled six times as a particle passes through the arms producing six charge readings per particle per plate segment. From these readings it is possible to estimate charge on the particle. An example of data obtained with the HVPS instrument is presented below.
Figure 14: An example of T-28 HVPS data from 29 June, 2000, showing a shadow image and partial charge plate signal for each particle in two consecutive image buffers, the flight track for the entire flight with a red diamond at the location where the images were obtained, and the signals from all 8 charge plates for the one selected particle indicated in the top panel.
Detwiler, A. G., and K. R. Hartman, 1991. IAS Method for 2D Data Analysis on PCs. Bulletin 91-5, Institute of Atmospheric Sciences, South Dakota School of Mines and Technology, 501 East St. Jospeh Street, Rapid City, SD 57701-3995, 37 pp. + appendices.