Precipitation
Cloud
ice and small precipitation particles were imaged with a PMS optical array
probe (OAP) providing two-dimensional shadow images of particles with a
vertical window height of 0.8 mm (2D-C).
This probe produces shadow images of precipitation-size particles with
0.2 mm resolution.
A
brief discussion of the probe is given in Detwiler and Hartman (1991). This
probe performed very well during the project.
An example of the recordings for the flight 803 on
Flight 803 – 2DC Images
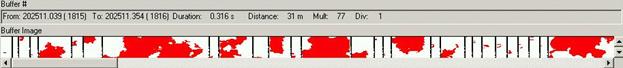
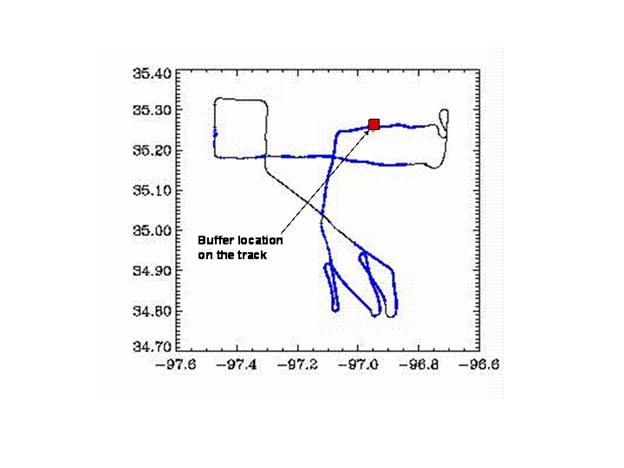
Figure 1: 2DC images recorded during flight 803 (
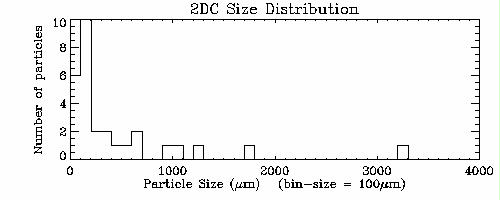
Figure 2: Particle size distribution for the buffers shown in figure 1.
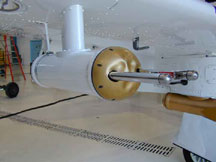
Larger
precipitation particles were imaged and counted by the custom-built Optical
Array Hail Spectrometer, sensitive to particles between 0.9 mm and 12 cm in
diameter. The automated counting and
sizing circuitry includes only particles in the size range 4.5 mm to 4.5
cm. The probe performed well during the
project, except during descent. It is
not de-iced, and descent from cooler to warmer layers of the atmosphere caused
condensation on the windows and loss of data.
Additional
information on large particles can be inferred from the recorded videotape with
the camera mounted under the right wing of the airplane. If the video camera housing window is not
iced-over, the video can be used to view precipitation particle impacts and
some judgement can be made about the character of the
precipitation (liquid, soft ice, hard ice, etc.). In addition, the windscreen
microphone, recorded on one of the two audio tracks, can be used to verify when
hail is striking the windscreen. Mushy hailstones produce muffled sounds, while
hard hailstones sound almost like a hammer hitting the windscreen.
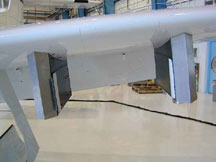
The
High-Volume Particle Sampler (HVPS) instrument collects shadow images of
hydrometeors with sizes ranging between 0.2 and 4.5 mm, with 0.2 mm
resolution. It was specially modified by
attaching 2 segmented plates between the main arms of the probe. Signals from these plates can be used to
estimate electric charge on hydrometeor, but for this project charge
information recording was disabled.
The maximum clock frequency for the HVPS is 240 kHz. The HVPS data recorded during this project
has 400 mm
resolution along the flight path. A
picture of the data obtained with the HVPS instrument is presented below
(Flight 803
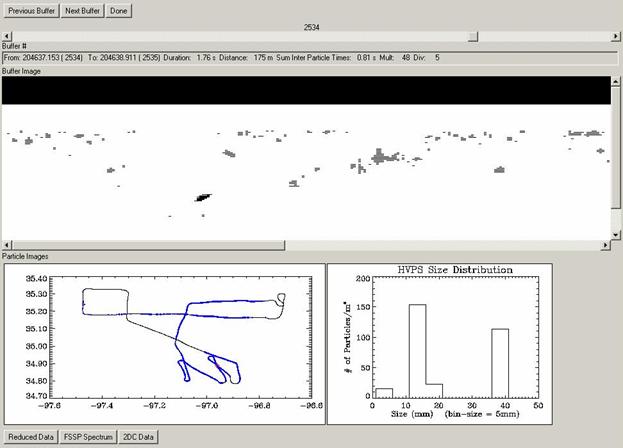
The above figure
shows a typical display of the software developed in IDL to display the T-28 HVPS data for each
flight. On the lower write corner, you
can see a display of the particle vertical size distribution, while on the
lower left corner the track of the T28 and the position of the buffer displayed
above are shown.