| |
Click on the maps for larger image |
| |
|
| Regional Surface Meteorological Networks |
| |
|
| WCAU SchoolNet - WCAU-TV in
Philadelphia, Pennsylvania operates this network of 230 stations located at
schools throughout Pennsylvania and surrounding states (122 in Pennsylvania). The network provides up to 1-minute
observations of air temperature, relative humidity, wind speed, wind direction,
precipitation, and barometric pressure. For further information visit the
WCAU network page. |
No map yet. |
| |
|
| WPXI SchoolNet - WPXI-TV in
Pittsburgh, Pennsylvania operates this network of 63 stations located at
schools throughout Pennsylvania and surrounding states (60 in Pennsylvania). The network provides up to 1-minute
observations of air temperature, relative humidity, wind speed, wind direction,
precipitation, and barometric pressure. For further information visit the
WPXI network page. |
No map yet. |
| |
|
| WMAR WeatherNet
- WMAR-TV in Baltimore, Maryland operates this network of 131 stations located
primarily at schools throughout Maryland, eastern Pennsylvania, and Delaware
(3 in Pennsylvia). The
network provides up to 1-minute observations of air temperature, relative
humidity, wind speed, wind direction, precipitation, and barometric pressure.
For further information visit the
WMAR
network page. |
No map yet. |
| WIVB WeatherNet
- WIVB-TV in Buffalo, New York this network of 90 stations located
primarily at schools throughout New York and Pennsylvania (3 in Pennsylvania). The
network provides up to 1-minute observations of air temperature, relative
humidity, wind speed, wind direction, precipitation, and barometric pressure.
For further information visit the
WIVB network page. |
No map yet. |
| |
|
| WBRE WeatherNet
- WBRE-TV in Honolulu, Hawaii operates this network of 63 stations located
primarily at schools throughout Pennsylvania and 1 in New York. The
network provides up to 1-minute observations of air temperature, relative
humidity, wind speed, wind direction, precipitation, and barometric pressure.
For further information visit the
WBRE network page. |
No map yet. |
| |
|
| WNBC WeatherNet
- WNBC-TV in New York, New York this network of 485 stations located
primarily at schools throughout New York, New Jersey and Connecticut (1 in Pennsylvania). The
network provides up to 1-minute observations of air temperature, relative
humidity, wind speed, wind direction, precipitation, and barometric pressure.
For further information visit the
WNBC network page. |
No map yet. |
| |
|
| State and Local Surface Meteorological Networks |
| |
|
| Pennsylvania Hourly Mesonet - The
Pennsylvania State Climatologist maintains and archive of hourly weather observations
for stations within Pennsylvania. This network includes stations from the NWS ASOS,
the Pennsylvania Department of Transportation Roadway Weather Information System (RWIS)
the Pennsylvania Department of Environmental Protection Commonwealth of Pennsylvania
Air Monitoring System, and the NWS Buoy Networks. For further information visit the
Pennsylvania
Hourly Mesonet home page. |
Map |
| |
|
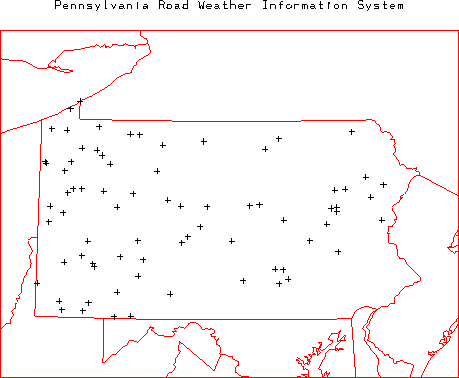
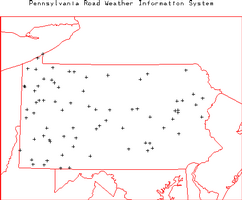
| Pennsylvania Department of Transportation
(DOT) Road Weather Information System (RWIS) Network - The Pennsylvania DOT
operates this network of 75 stations with locations along highways throughout the
state of Pennsylvania. The network provides variable (hourly or higher) resolution
observations of air temperature, dew point, relative humidity, and wind speed.
Hourly data from this network is included in the
Pennsylvania Hourly
Mesonet operated by the Pennsylvania State Climatologist. For further information visit the
Pennsylvania DOT RIWS page. |
 |
| |
|
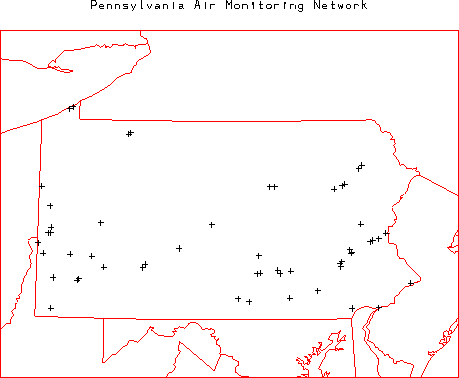
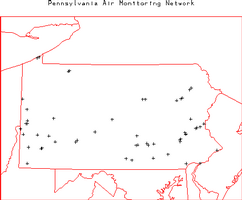
| Pennsylvania Air Monitoring Network
- The Pennsylvania Department of Environmental Protection Bureau of Air Quality
operates this network of 55 stations with locations throughout the state of
Pennsylvania. The network provides hourly observations of air temperature, solar
radiation, wind speed, and wind direction. Hourly data from this network is included in the
Pennsylvania Hourly
Mesonet operated by the Pennsylvania State Climatologist. For further information visit the
Bureau of Air Quality page. |
 |
| WHTM WeatherNet
- WHTM-TV in Harrisburg, Pennsylvania operates this network of 58 stations located
primarily at schools throughout Pennsylvania. The
network provides up to 1-minute observations of air temperature, relative
humidity, wind speed, wind direction, precipitation, and barometric pressure.
For further information visit the
WHTM network page. |
No map yet. |
| |
|
| Precipitation and Radar Networks |
|
|
| Community Collaborative Rain, Hail and Snow Network (CoCoRaHS) - The Colorado
Climate Center at Colorado State University overseas this cooperative network of observers
located throughout Pennsylvania. The network provides daily observations of
precipitation, snowfall, and snow depth. Hailpad observations are also made at many
locations. For further information visit the
CoCoRaHS home page. |
No map. |
| |
|
| NOAA/National Centers for Environmental
Prediction (NCEP) Hourly Precipitation Data - NOAA/NCEP routinely develops
a National Multi-sensor Hourly Precipitation Analysis (Stage II) data set from
hourly radar precipitation estimates and from hourly gage reports. The gage data
includes hourly observations from ~4000 gages across the US (191 in Pennsylvania)
collected by the NOAA River Forecast Centers and sent to NCEP. Further information
on these data is available at:
http://wwwt.emc.ncep.noaa.gov/mmb/ylin/pcpanl/. |
 |
| |
|
| NOAA/NWS Cooperative Observer 15-minute Precipitation Network - The NOAA/NWS
routinely collects 15-minute observations of precipitation from Fisher-Porter and Universal
rain gages operated by 2777 cooperative observers located throughout the US (165 in Pennsylvania).
These data are archived at NOAA/NCDC as data set TD 3260. For further information visit the
NOAA/NCDC TD3260 page. |
 |
| |
|
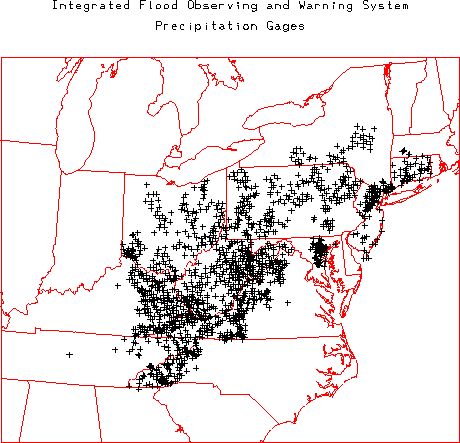
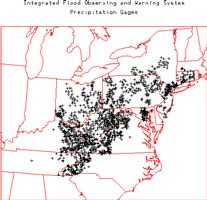
| Integrated FLood Observing and Warning System
(IFLOWS) Precipitation Network - The IFLOWS precipitation network is a collection
of various state operated Automated Flood Warning System (AFWS) networks throughout
the mid-Atlantic and northeastern portions of the United States. The network is
comprised of 1530 precipitation stations that provide 15-minute observations of
precipitation (216 in Pennsylvania). These precipitation data are included as part of the NCEP
Precipitation data set described above. For further information visit the
AFWS home page. |
 |
| |
|
| Weather Surveillance Radar 1988 Doppler (WSR-88D)
Network - The NOAA/NWS and the Department of Defence operate this network
of 143 WSR-88D radars across the continguous US (2 in Pennsylvania). The Level II
data are the three meteorological base data quantities (reflectivitiy, mean radial
velocity, and spectrum width) and are recorded at all NWS and most DOD sites.
Level II data are then processed in order to create a number of meteorological analysis
products known as Level III data. Level III data are recorded at the NWS sites. The
Level III products included base reflectivity, base spectrum width, base velocity,
composite reflectivity, echo tops, velocity azimuth display (VAD) wind profile,
vertically integrated liquid (VIL), 1-hour precipitation, storm total precipitation,
hail index overlay, mesocyclone overlay, severe weather probability overlay, storm
structure, storm tracking information overlay, and tornadic vortex signature overlay.
All Level II and III data are archived at NOAA/NCDC. For further information visit
the NOAA/NCDC Radar Resources page at:
http://www.ncdc.noaa.gov/oa/radar/radarresources.html or the NOAA Radar
Operations Center at:
http://www.roc.noaa.gov/. |
 |
| |
|
| Radiation and Flux Networks |
| |
|
| Surface Radiation (SURFRAD) Budget Network - The SURFRAD network
is operated by the NOAA/Air Resources Laboratory (ARL)/Surface Radiation Research
Branch (SRRB). The primary parameters measured by each station include upwelling
and downwelling solar and infrared radiation. Ancillary observations include
direct and diffuse solar radiation, photosynthetically active radiation, UVB,
spectral solar, air temperature, relative humidity, wind speed, wind direction, and
barometric pressure. The temporal resolution of all observations is 3 minutes.
There are 6 SURFRAD sites currently located across the US (1 in Pennsylvania), with 2
additional sites planned (Sioux Falls, SD and Canaan Valley, WV). For further
information visit the SURFRAD home page at:
http://www.srrb.noaa.gov/surfrad/. |
 |
| |
|
| Soil Networks |
| |
|
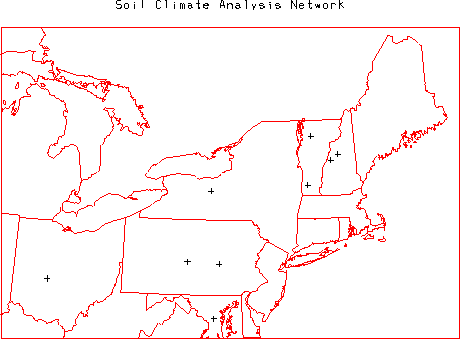
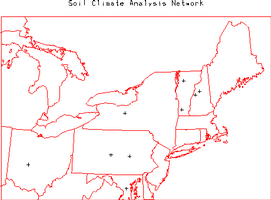
| Soil Climate Analysis Network (SCAN) - The SCAN is operated by the United
States Department of Agriculture (USDA) Natural Resources Conservation Service (NRCS). The
network provides hourly observations of air temperature, relative humidity, wind speed,
wind direction, solar radiation, precipitation, barometric pressure, snow water content,
snow depth, soil temperature (at 2, 4, 8, 20, and 40 cm depths), and soil moisture (at 2, 4,
8, 20 and 40 cm depths). The 80 SCAN stations are located across the US in primarily
agricultural regions (2 in Pennsylvania). For further information visit the
SCAN home page. |
 |
| |
|
| Hydrology Networks |
| |
|
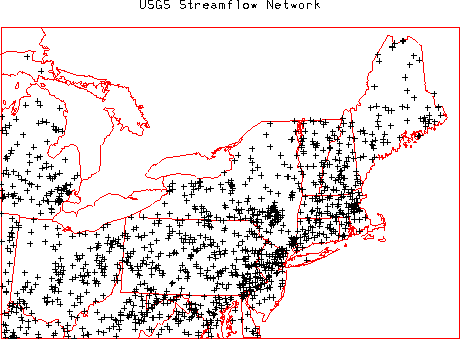
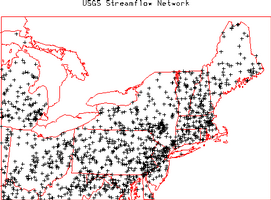
| United States Geological Survey (USGS) Streamflow
Network - The USGS (part of the US Department of the Interior) operates this
network of 7237 streamflow gages (239 in Pennsylvania) at locations throughout the US.
The network provides hourly or more frequent observations of stage (water level) from
which discharge (flow) is comuputed using a stage-discharge rating relation. The
rating is defined by occasional direct current-meter measurements of discharge. All
data are available through the USGS and the district offices in each state. Many of
these gages provide realtime data
relayed via the GOES satellite data collection system. The realtime data are
provisional data that have not been reviewed or edited. These realtime data
may be subject to significant change and are not citeable until reviewed and approved
by the USGS. Realtime data may be changed after review because the stage-discharge
relationship may have been affected by: 1) backwater from ice or debris; 2) algal and
aquatic growth in the stream; 3) sediment movement; and 4) malfunction of recording
equipment. Each station record is considered provisional until the data are
published. The data are usually published with 6 months of the end of the water year
(1 October to 30 September). Data users are cautioned to consider carefully the
provisional nature of the information before using it. For further information on the
USGS stremflow network visit the
USGS Water Resources of the United
States page or the
USGS Pennsylvania District Office
home page. |
 |
| |
|
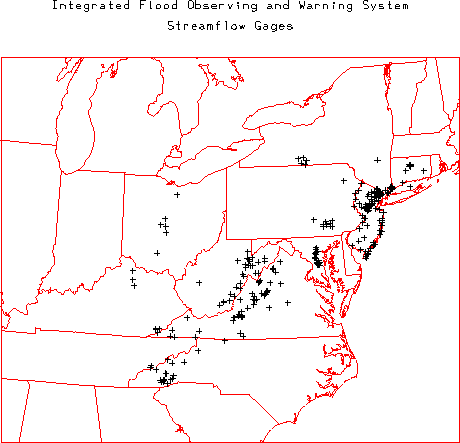
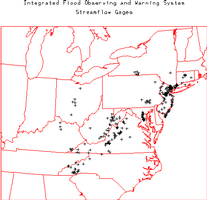
| Integrated FLood Observing and Warning System
(IFLOWS) Streamflow Network - The IFLOWS network is a collection of various
state operated Automated Flood Warning System (AFWS) networks throughout the mid-Atlantic
and northeastern portions of the United States. The network is comprised of 275
streamflow gages that provide 15-min stage observations (10 in Pennsylvania). For
further information visit the
AFWS home page. |
 |
| |
|
| USDA/ARS Watershed Research - The USDA/ARS operates a number of
research watersheds throughout the US. Some of the best instrumented include the
Reynolds Creek in Idaho, the Walnut Gulch in Arizona, the Southern Plains
Experimental Range in Oklahoma, the Little Washita River in Oklahoma, the Blackland
Prairie in Texas, the Goodwater Creek in Missouri, the Walnut Creek in Iowa,
Goodwin Creek in Mississippi, the Little River in Georgia, the Oconee River in
Georgia, the North Appalachian Watershed in Ohio, the National Agriculture Research
Center in Maryland, and the Mahantango Creek in Pennsylvania. Most of these have at
least one surface meteorological station and a precipitation gage network. For
further information visit the USDA/ARS Watershed Research home page at:
http:/www.nwrc.ars.usda.gov/watershed/. |
 |
| |
|
| Upper Air Networks |
| |
|
| NOAA/NWS Radiosonde Network Low Vertical Resolution Data - The NOAA/NWS
typically releases radiosondes twice per day at 0000 and 1200 UTC at 69 locations throughout
the US (1 in Pennsylvania). During special weather situations the NWS can request to release
additional radiosondes at off-times (e.g. 1800 UTC). The low resolution data is sent out
over the Global Telecommunications System (GTS) and provides mandatory and significant level
observations of pressure, altitude, temperature, dew point, wind speed, and wind direction.
There are 3 types of radiosondes utilized within the US network, Vaisala, VIZ (or Sippican),
and Microsonde. These data are archived by NOAA/NCDC and other organizations. For further
information on the NWS Radiosonde network visit the
NWS Upper-air Observations Program
home page. A several year archive of GTS upper air data is available at the
NOAA/FSL Radiosonde Database. |
 |
| |
|
| NOAA/NWS Radiosonde Network High Vertical Resolution Data - The same
radiosonde locations mentioned in the previous data set also provide a 6-second vertical
resolution data set that provides observations of pressure, temperature, altitude,
relative humidity, and azimuth and elevation angles. UCAR/JOSS has developed software
to derive 6-second vertical resolution winds from the angle data. These data are
archived by NCDC and UCAR/JOSS. |
|
| |
|
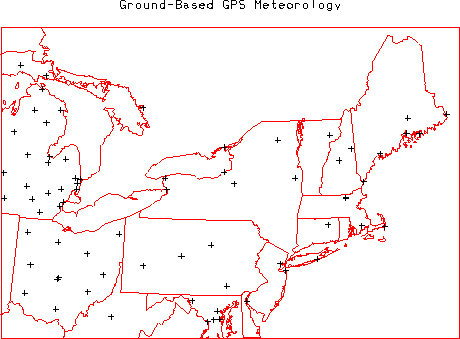
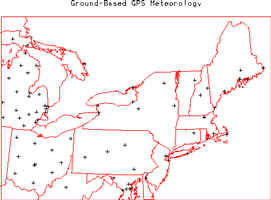
| Ground Based Global Positioning System (GPS) Meteorology Demonstration Network
(GPS-MET) - The NOAA/FSL ingests data from 323 GPS locations around the US
operated by many different agencies (4 in Pennsylvania). Typically each location provides
30-minute observations of integrated precipitatable water along with a number of surface
meteorology parameters (air temperature, relative humidity, barometric pressure, etc).
For further information visit the
GPS-MET home page. |
 |
| |
|
| Aerosol Networks |
| |
|
| Regional East Atmospheric Lidar Mesonet - The Regional East Atmospheric Lidar Mesonet
(REALM) is a proposal by a number of lidar researchers and is designed to monitor air quality in the
vertical from multiple locations on the east coast. For further information visit the
REALM web site. |
Map at web site. |
| |
| Coastal Networks |
| |
|
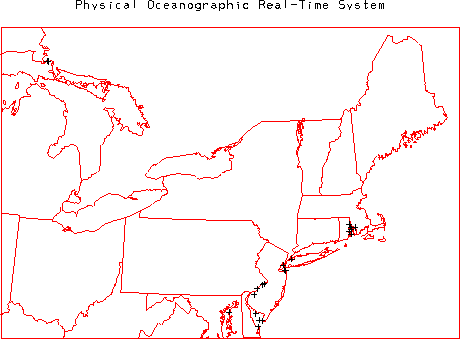
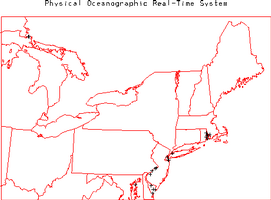
| Physical Oceanographic Real-Time System (PORTS)
- The National Ocean Service (NOS) operates this network of 51 weather stations with
locations within bays and harbors along the Atlantic and Gulf of Mexico coastlines
(2 in Pennsylvania). The network provides 15-minute observations of air temperature,
wind speed, wind direction, barometric pressure, water temperature, and water level.
For further information visit the
PORTS home page
. |
 |