| |
Click on the maps for larger image |
| |
|
| National Surface Meteorological Networks |
| |
|
| Automated Surface Observing System
(ASOS) - The National Weather Service (NWS),
Federal Aviation Administration (FAA) and Department of Defense operate this network of 967
stations located throughout the United States (26 in Ohio). The data generally available
from ASOS stations includes hourly (and special) observations of air temperature, dew point, wind
speed, wind direction, cloud cover, visibility, present weather, and precipitation. Via modem
data can be obtained every minute (typically the most recent ~8 hours of observations are kept at
the stations). For further information on the ASOS network visit the
NWS ASOS home page or the
FAA Automated Sensors home page. |
 |
| |
|
| Automated Weather Observing System (AWOS) - The FAA and various state agencies
(particularly Aviation Divisions of state Departments of Transportation) operate this network of
900 stations located throughout the United States (21 in Ohio). While data is generally
available from 552 of these stations (2 in Ohio), the data from the other 348 stations (19 in Ohio) is
currently only available via dialup modem (typically the most recent ~3 weeks of observations
are kept at the stations). These stations typically provide 20-minute observations of air
temperature, dew point, wind speed, wind direction, cloud cover, visibility, altimeter setting,
present weather and precipitation. For further information on the AWOS network visit the
FAA Automated Sensors home page. |
 |
| |
|
| Non-Automated METAR Reports - In addition to the ASOS and AWOS there are still
a number of stations where the observations are taken manually. There are 216 such observation
locations located throughout the United States (2 in Ohio). A large proportion of these
observations are limited in some fashion (e.g. no observations at night or just one or two
observations in a day). The parameters available vary from station to station, but most provide
air temperature, dew point, wind speed, wind direction, cloud cover, and present weather. |
 |
| |
|
| NOAA/NWS Cooperative Observer Program - The
NOAA/National Weather Service
oversees this network with 9765 participating cooperative observers located throughout the
United States (205 in Ohio). This network provides daily observations (7am local time)
of maximum and minimum air temperature, precipitation, snowfall, and snow depth. Some stations
also provide soil temperature, evaporation, and wind run. These data are archived at NOAA/NCDC.
For further information visit the NOAA/NWS Cooperative Observer Program home page at:
http://www.nws.noaa.gov/om/coop/index.htm. |
 |
| |
|
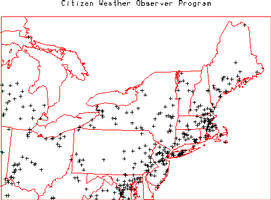
| Citizen Weather Observer Program (CWOP)
- This 'network' is comprised of weather stations operated by the general public and
reported by amateur radio operators around the world. All observations are collected
by the NOAA/Forecast Systems Laboratory (NOAA/FSL) and are included as part of their
Meteorological Assimilation Data Ingest System (MADIS). The network varies greatly in
terms of data quality and completeness. Within the United States there are
1328 reporting stations (31 in Ohio). The parameters reported
vary by station, but typically include air temperature, relative humidity, wind speed,
wind direction, barometric pressure, and precipitation. For further information
visit the
CWOP home page. |
 |
| |
|
| Remote Automated Weather Station (RAWS) Network - The United States Forest
Service oversees this network of stations owned and operated by state and local wildland fire
agencies. The network typically provides hourly values of air temperature, dew point,
relative humidity, wind speed, wind direction, precipitation, fuel temperature, and fuel
moisture. The network consists of 726 stations located throughout the United States (1 in
Ohio), but heavily concentrated in the forested areas of the western mountains. These
data are included within the University of Utah MesoWest and the NOAA/FSL MADIS data sets.
For further information visit the USFS RAWS home page at:
http://www.fs.fed.us/raws/. |
 |
| |
|
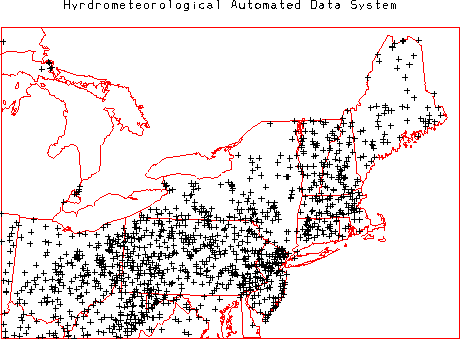
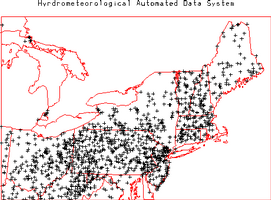
| Hydrometeorological Automated Data System (HADS) - The NOAA Office of
Hydrologic Development operates the HADS real-time data aquisition and data distribution
system. HADS collects data from Data Collection Platforms (DCPs) operated by a number of
federal, state, and local agencies throughout the US and a few nearby countries. The
network currently includes 10079 observation locations (193 in Ohio). The temporal
resolution and parameters collected vary widely by network and station but can include a
variety of meteorological and hydrologic parameters. For further information visit the
NWS HADS page. |
 |
| |
|
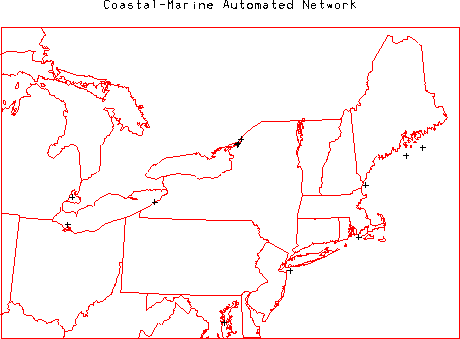
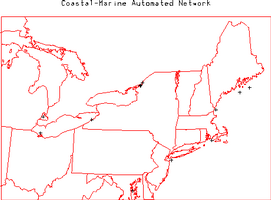
| Coastal-Marine Automated Network (C-MAN) -
The National Data Buoy Center (NDBC) operates this network of 55 C-MAN stations
with locations along coastlines throughout the US (1 in Ohio). The network
typically provides hourly observations of air temperature, barometric pressure,
wind speed, wind direction, and wind gust. Some stations also provide
observations of sea water temperature, water level, waves, relative humidity,
precipitation, and visibility. For further information visit the
NDBC home page. |
 |
| |
|
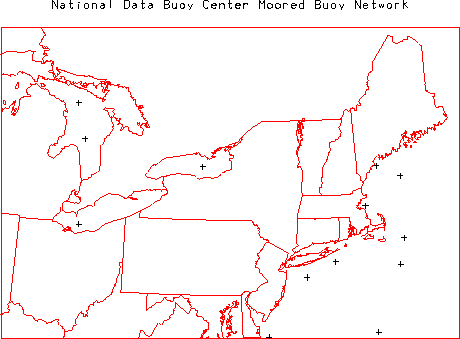
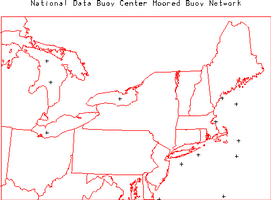
| National Data Buoy Center (NDBC) Moored Buoy
Network - The NDBC operates this network of 77 moored buoys with locations
throughout the US coastal regions (1 off the coast of Ohio). The network typically
provides hourly observations of air temperature, dew point, water temperature,
barometric pressure, wind speed, wind direction, wave height, wave period, and
swell. For further information visit the
NDBC home page. |
 |
| |
|
| Regional Surface Meteorological Networks |
| |
|
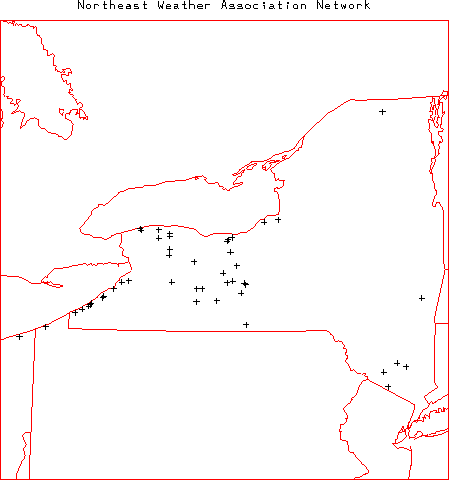
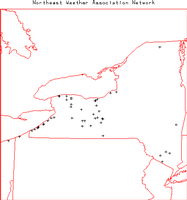
| Northeast Weather Association (NEWA) Network
- The NERA is affiliated with the New York State Integrated Pest
Management Program and operates this network of 46 weather stations primarily in
western New York state (1 in Ohio). The network provides hourly observations of
air temperature, relative humidity, soil temperature, leaf wetness, and precipitation.
Access to data from this network usually requires a subscription although such fees
have been waived in the past (e.g. 2002). For further information visit the
NEWA home page. |
 |
| |
|
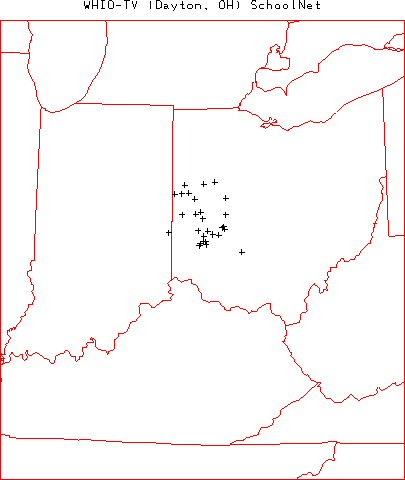
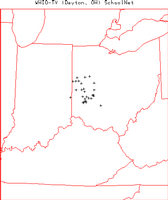
| WHIO WeatherNet
- WHIO-TV in Dayton, Ohio operates this network of 28 stations located
primarily at schools in and around Dayton, Ohio (27 in Ohio). The
network provides up to 1-minute observations of air temperature, relative
humidity, wind speed, wind direction, precipitation, and barometric pressure.
For further information visit the
WHIO
network page. |
 |
| |
|
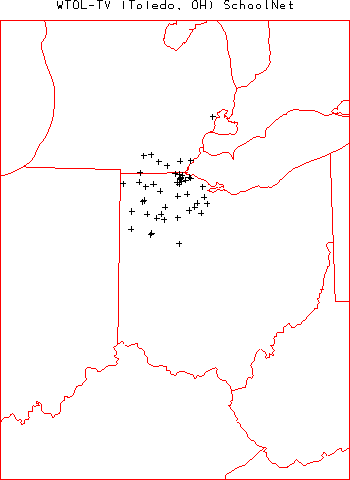
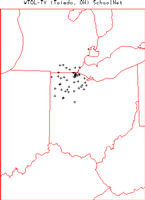
| WTOL WeatherNet
- WTOL-TV in Dayton, Ohio operates this network of 51 stations located
primarily at schools throughout northwestern Ohio and southeastern Michigan
(43 in Ohio). The
network provides up to 1-minute observations of air temperature, relative
humidity, wind speed, wind direction, precipitation, and barometric pressure.
For further information visit the
WTOL
network page. |
 |
| |
|
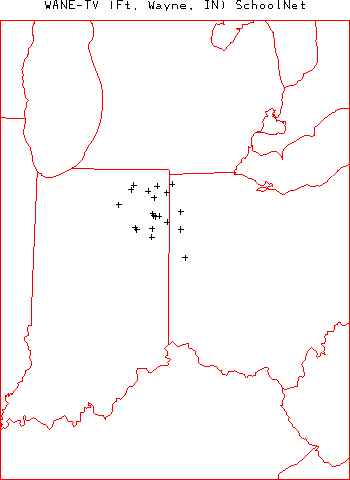
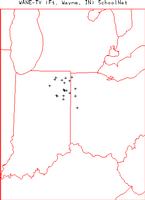
| WANE WeatherNet
- WANE-TV in Ft. Wayne, Indiana operates this network of 20 stations located
primarily at schools throughout northeastern Indiana and northwestern Ohio
(4 in Ohio). The
network provides up to 1-minute observations of air temperature, relative
humidity, wind speed, wind direction, precipitation, and barometric pressure.
For further information visit the
WANE
network page. |
 |
| WYTV WeatherNet
- WYTV-TV in Youngstown, Ohio operates this network of 15 stations located
primarily at schools throughout Ohio and western Pennsylvania (9 in Ohio). The
network provides up to 1-minute observations of air temperature, relative
humidity, wind speed, wind direction, precipitation, and barometric pressure.
For further information visit the
WYTV network page. |
No map yet. |
| |
|
| State and Local Surface Meteorological Networks |
| |
|
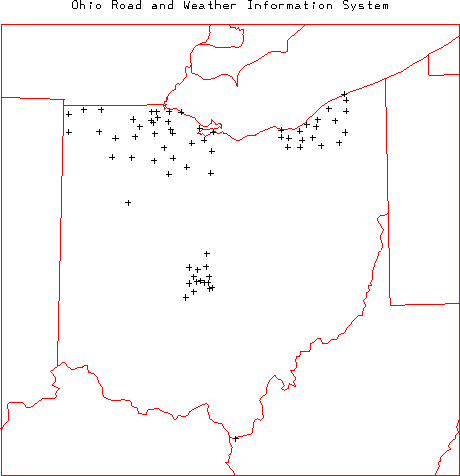
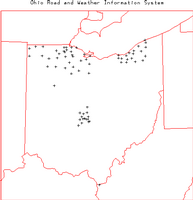
| Ohio Department of Transportation (DOT) Road
and Weather Information System (RWIS) - The Ohio DOT operates this network of
69 weather stations along highways throughout the state of Ohio. The network provides
variable (hourly or higher) resolution observations of air temperature, dew point,
relative humidity, and wind speed. For further information visit the
Ohio DOT RWIS
page or the
Surface Systems, Inc Road
Weather page. |
 |
| |
|
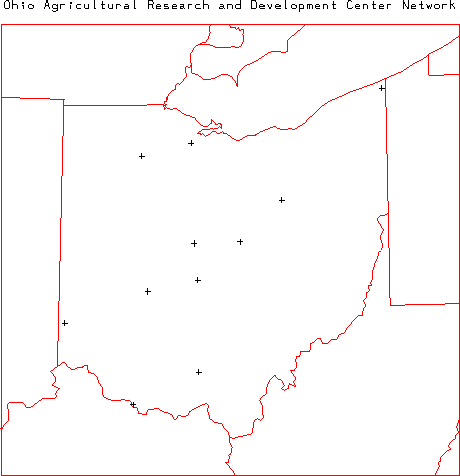
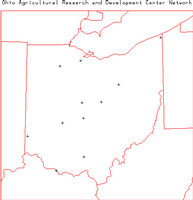
| Ohio Agricultural Research and Development
Center (OARDC) Network - The OARDC and Miami University operate this network
of 12 stations located throughout the state of Ohio. The network provides hourly
observations of air temperature, relative humidity, solar radiation, precipitation,
wind speed, wind direction, and soil temperature at 5 and 10 cm depths. For further
information visit the
OARDC Network home page. |
 |
| |
|
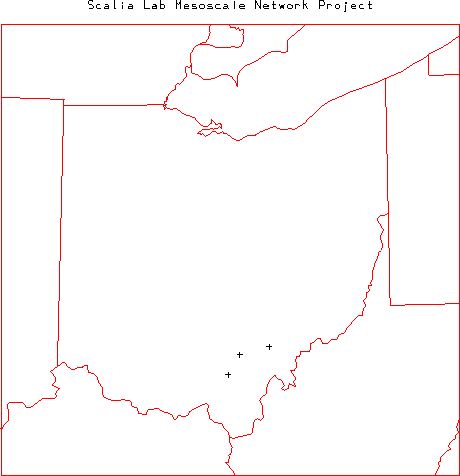
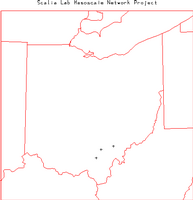
| Scalia Lab Mesoscale Network Project
- The Ohio University Scalia Lab Internet Center operates this network of 3 stations
across southeastern Ohio. More stations are planned. The network provides 5-minute
observations of air temperature, relative humidity, solar radiation, precipitation,
wind speed, and wind direction. For further information visit the
network page. |
 |
| |
|
| Ohio Air Monitoring Network - The
Ohio Environmental Protection Agency Division of Air Pollution Control Air Monitoring
Section operates a network of air quality stations throughout the state of Ohio. It
is not clear how many of these locations have available meteorological parameters.
For further information visit the
Air
Monitoring Section page. |
No map. |
| |
|
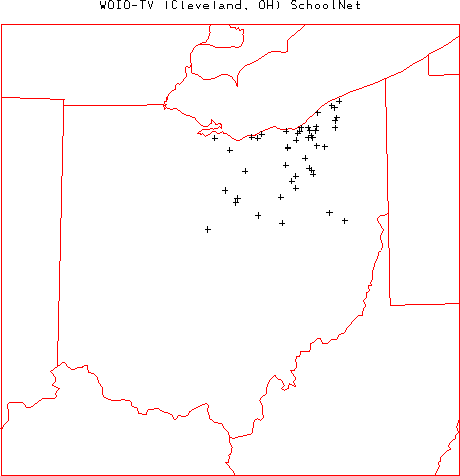
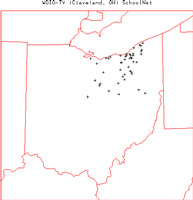
| WOIO WeatherNet
- WOIO-TV in Cleveland, Ohio operates this network of 46 stations located
primarily at schools throughout northern Ohio. The
network provides up to 1-minute observations of air temperature, relative
humidity, wind speed, wind direction, precipitation, and barometric pressure.
For further information visit the
WOIO
network page. |
 |
| |
|
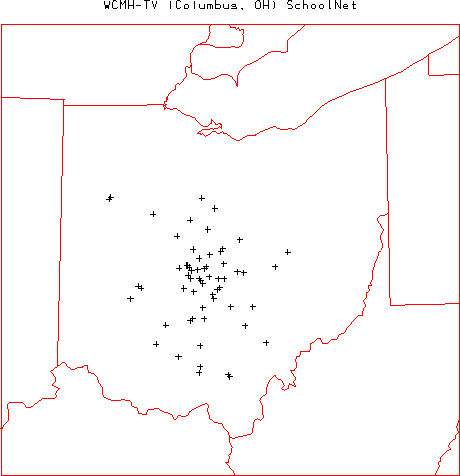
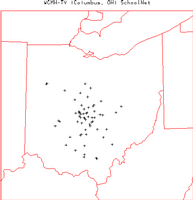
| WCMH WeatherNet
- WCMH-TV in Columbus, Ohio operates this network of 60 stations located
primarily at schools throughout central Ohio. The
network provides up to 1-minute observations of air temperature, relative
humidity, wind speed, wind direction, precipitation, and barometric pressure.
For further information visit the
WCMH
network page. |
 |
| |
|
| Precipitation and Radar Networks |
| |
|
| NOAA/National Centers for Environmental
Prediction (NCEP) Hourly Precipitation Data - NOAA/NCEP routinely develops
a National Multi-sensor Hourly Precipitation Analysis (Stage II) data set from
hourly radar precipitation estimates and from hourly gage reports. The gage data
includes hourly observations from ~4000 gages across the US (126 in Ohio)
collected by the NOAA River Forecast Centers and sent to NCEP. Further information
on these data is available at:
http://wwwt.emc.ncep.noaa.gov/mmb/ylin/pcpanl/. |
 |
| |
|
| NOAA/NWS Cooperative Observer 15-minute Precipitation Network - The NOAA/NWS
routinely collects 15-minute observations of precipitation from Fisher-Porter and Universal
rain gages operated by 2777 cooperative observers located throughout the US (104 in Ohio).
These data are archived at NOAA/NCDC as data set TD 3260. For further information visit the
NOAA/NCDC TD3260 page. |
 |
| |
|
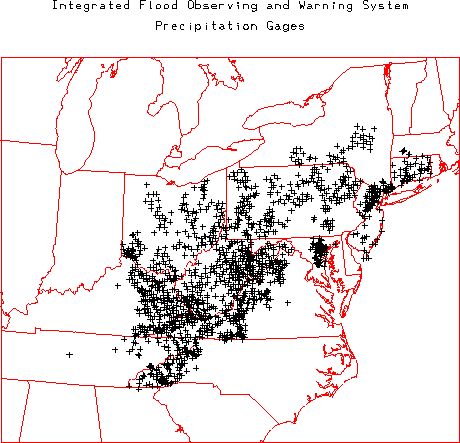
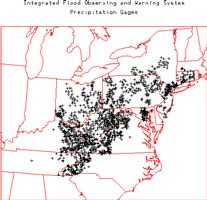
| Integrated FLood Observing and Warning System
(IFLOWS) Precipitation Network - The IFLOWS precipitation network is a collection
of various state operated Automated Flood Warning System (AFWS) networks throughout
the mid-Atlantic and northeastern portions of the United States. The network is
comprised of 1530 precipitation stations that provide 15-minute observations of
precipitation (164 in Ohio). These precipitation data are included as part of the NCEP
Precipitation data set described above. For further information visit the
AFWS home page. |
 |
| |
|
| Weather Surveillance Radar 1988 Doppler (WSR-88D)
Network - The NOAA/NWS and the Department of Defense operate this network
of 143 WSR-88D radars across the contiguous US (2 in Ohio). The Level II
data are the three meteorological base data quantities (reflectivity, mean radial
velocity, and spectrum width) and are recorded at all NWS and most DOD sites.
Level II data are then processed in order to create a number of meteorological analysis
products known as Level III data. Level III data are recorded at the NWS sites. The
Level III products included base reflectivity, base spectrum width, base velocity,
composite reflectivity, echo tops, velocity azimuth display (VAD) wind profile,
vertically integrated liquid (VIL), 1-hour precipitation, storm total precipitation,
hail index overlay, mesocyclone overlay, severe weather probability overlay, storm
structure, storm tracking information overlay, and tornadic vortex signature overlay.
All Level II and III data are archived at NOAA/NCDC. For further information visit
the NOAA/NCDC Radar Resources page at:
http://www.ncdc.noaa.gov/oa/radar/radarresources.html or the NOAA Radar
Operations Center at:
http://www.roc.noaa.gov/. |
 |
| |
|
| Radiation and Flux Networks |
| |
|
| None at present |
|
| |
|
| Soil Networks |
| |
|
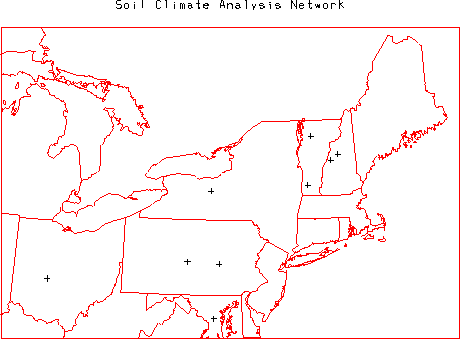
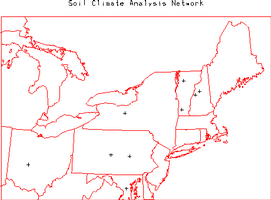
| Soil Climate Analysis Network (SCAN) - The SCAN is operated by the United
States Department of Agriculture (USDA) Natural Resources Conservation Service (NRCS). The
network provides hourly observations of air temperature, relative humidity, wind speed,
wind direction, solar radiation, precipitation, barometric pressure, snow water content,
snow depth, soil temperature (at 2, 4, 8, 20, and 40 cm depths), and soil moisture (at 2, 4,
8, 20 and 40 cm depths). The 80 SCAN stations are located across the US in primarily
agricultural regions (1 in Ohio). For further information visit the
SCAN home page. |
 |
| |
|
| Hydrology Networks |
| |
|
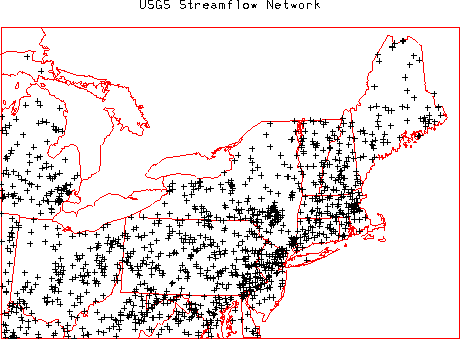
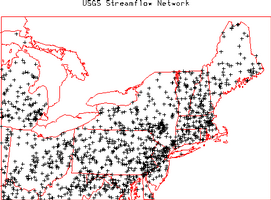
| United States Geological Survey (USGS) Streamflow
Network - The USGS (part of the US Department of the Interior) operates this
network of 7237 streamflow gages (130 in Ohio) at locations throughout the US.
The network provides hourly or more frequent observations of stage (water level) from
which discharge (flow) is computed using a stage-discharge rating relation. The
rating is defined by occasional direct current-meter measurements of discharge. All
data are available through the USGS and the district offices in each state. Many of
these gages provide realtime data
relayed via the GOES satellite data collection system. The realtime data are
provisional data that have not been reviewed or edited. These realtime data
may be subject to significant change and are not citeable until reviewed and approved
by the USGS. Realtime data may be changed after review because the stage-discharge
relationship may have been affected by: 1) backwater from ice or debris; 2) algal and
aquatic growth in the stream; 3) sediment movement; and 4) malfunction of recording
equipment. Each station record is considered provisional until the data are
published. The data are usually published with 6 months of the end of the water year
(1 October to 30 September). Data users are cautioned to consider carefully the
provisional nature of the information before using it. For further information on the
USGS streamflow network visit the
USGS Water Resources of the United
States page or the
USGS Ohio District Office
home page. |
 |
| |
|
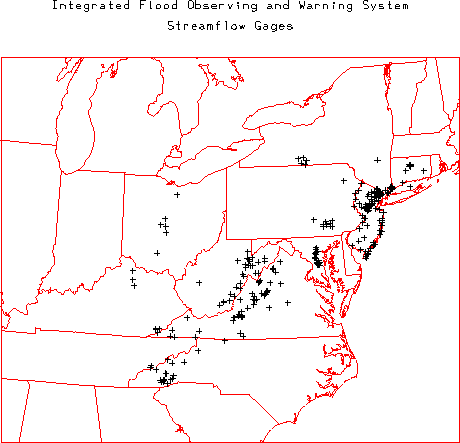
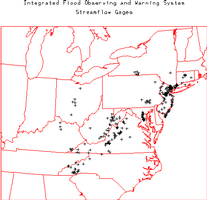
| Integrated FLood Observing and Warning System
(IFLOWS) Streamflow Network - The IFLOWS network is a collection of various
state operated Automated Flood Warning System (AFWS) networks throughout the mid-Atlantic
and northeastern portions of the United States. The network is comprised of 275
streamflow gages that provide 15-min stage observations (6 in Ohio). For
further information visit the
AFWS home page. |
 |
| |
|
| Upper Air Networks |
| |
|
| NOAA/NWS Radiosonde Network Low Vertical Resolution Data - The NOAA/NWS
typically releases radiosondes twice per day at 0000 and 1200 UTC at 69 locations throughout
the US (1 in Ohio). During special weather situations the NWS can request to release
additional radiosondes at off-times (e.g. 1800 UTC). The low resolution data is sent out
over the Global Telecommunications System (GTS) and provides mandatory and significant level
observations of pressure, altitude, temperature, dew point, wind speed, and wind direction.
There are 3 types of radiosondes utilized within the US network, Vaisala, VIZ (or Sippican),
and Microsonde. These data are archived by NOAA/NCDC and other organizations. For further
information on the NWS Radiosonde network visit the
NWS Upper-air Observations Program
home page. A several year archive of GTS upper air data is available at the
NOAA/FSL Radiosonde Database. |
 |
| |
|
| NOAA/NWS Radiosonde Network High Vertical Resolution Data - The same
radiosonde locations mentioned in the previous data set also provide a 6-second vertical
resolution data set that provides observations of pressure, temperature, altitude,
relative humidity, and azimuth and elevation angles. UCAR/JOSS has developed software
to derive 6-second vertical resolution winds from the angle data. These data are
archived by NCDC and UCAR/JOSS. |
|
| |
|
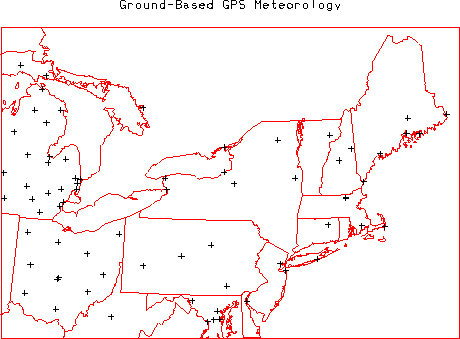
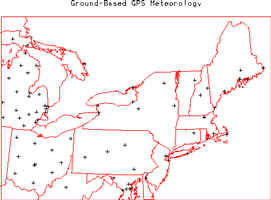
| Ground Based Global Positioning System (GPS) Meteorology Demonstration Network
(GPS-MET) - The NOAA/FSL ingests data from 323 GPS locations around the US
operated by many different agencies (11 in Ohio). Typically each location provides
30-minute observations of integrated precipitatable water along with a number of surface
meteorology parameters (air temperature, relative humidity, barometric pressure, etc).
For further information visit the
GPS-MET home page. |
 |