| |
Click on the maps for larger image |
| |
|
| Regional Surface Meteorological Networks |
| |
|
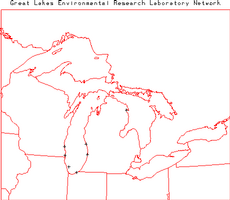
| Great Lakes Environmental Research Laboratory
(GLERL) Real-Time Meteorological Observation Network - The GLERL operates
this network of 7 stations with locations primarily around southern Lake Michigan
(3 in Michigan).
The network provides up to 5-minute observations of air temperature, wind speed,
and wind direction. For further information visit the
GLERL network
home page. |
 |
| |
|
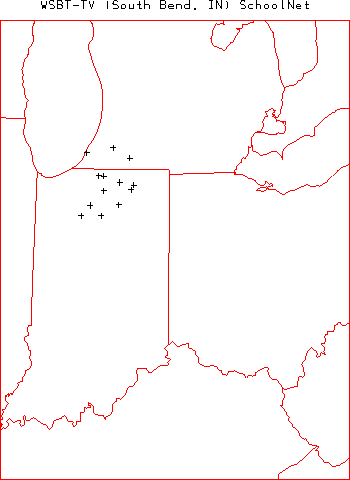
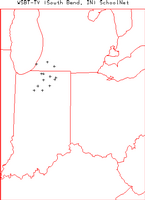
| WSBT WeatherNet
- WSBT-TV in South Bend, Indiana operates this network of 13 stations located
primarily at schools throughout northern Indiana (3 in Michigan). The
network provides up to 1-minute observations of air temperature, relative
humidity, wind speed, wind direction, precipitation, and barometric pressure.
For further information visit the
WSBT
network page. |
 |
| |
|
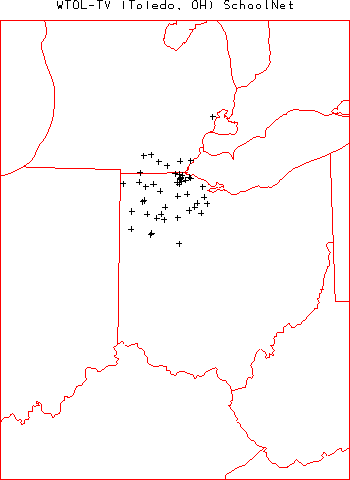
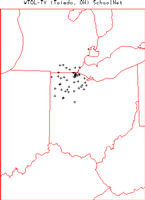
| WTOL WeatherNet
- WTOL-TV in Dayton, Ohio operates this network of 51 stations located
primarily at schools throughout northwestern Ohio and southeastern Michigan
(8 in Michigan). The
network provides up to 1-minute observations of air temperature, relative
humidity, wind speed, wind direction, precipitation, and barometric pressure.
For further information visit the
WTOL
network page. |
 |
| |
|
| State and Local Surface Meteorological Networks |
| |
|
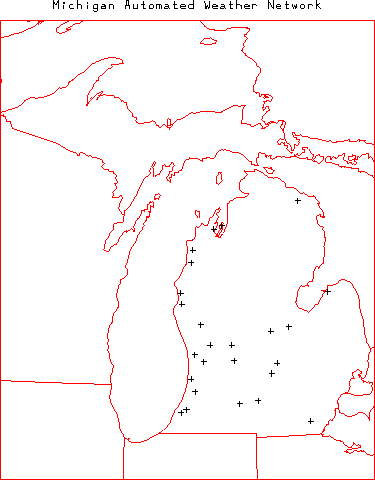
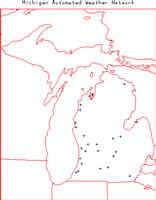
| Michigan Automated Weather Network (MAWN)
- The Michigan State University and Michigan Agricultural Experiment Station
operate this network of 25 stations located throughout the state of Michigan. The
network provides hourly observations of air temperature, relative humidity, soil
temperature (at 4 inch depth), soil moisture, leaf wetness, wind speed, wind
direction, solar radiation, and precipitation. A subset of these parameters is
also available every 5 minutes. For further information visit the
MAWN home page
. |
 |
| |
|
| Road Weather Information System (RWIS) - The Michigan Department
of Transportation (DOT) operates this network of 11 stations located throughout
Indiana. The network provides variable temporal resolution observations of air
temperature, relative humidity, dew point, wind speed, wind direction, visibility, and
precipitation (yes/no). For further information visit the
Surface Systems, Inc Road
Weather page. |
Map at Web Site |
| |
|
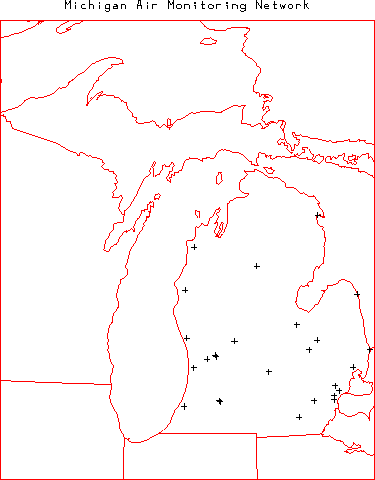
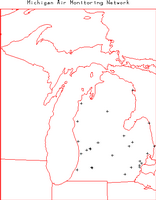
| Michigan Air Monitoring Network - The Michigan
Department of Environmental Quality operates this network of 26 stations located
throughout the state of Michigan. All of the sations provide hourly observations of
air temperature, wind speed, and wind direction. 12 of the stations provide observations
of barometric pressure, 5 provide relative humidity, and 3 provide solar radiation.
For further information visit the
Air Monitoring program home page. |
 |
| |
|
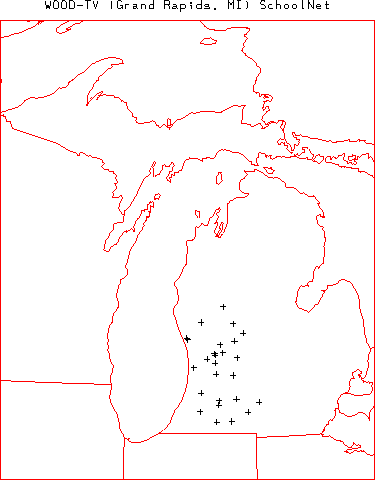
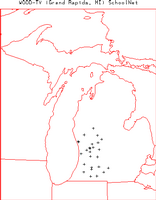
| WOOD WeatherNet
- WOOD-TV in Grand Rapids, Michigan operates this network of 26 stations located
primarily at schools throughout western Michigan. The
network provides up to 1-minute observations of air temperature, relative
humidity, wind speed, wind direction, precipitation, and barometric pressure.
For further information visit the
WOOD
network page. |
 |
| |
|
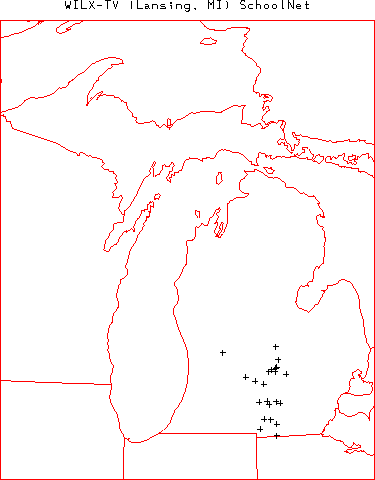
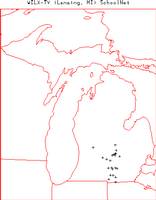
| WILX WeatherNet
- WILX-TV in Lansing, Michigan operates this network of 23 stations located
primarily at schools throughout central Michigan. The
network provides up to 1-minute observations of air temperature, relative
humidity, wind speed, wind direction, precipitation, and barometric pressure.
For further information visit the
WILX
network page. |
 |
| |
|
| Precipitation and Radar Networks |
| |
|
| NOAA/National Centers for Environmental
Prediction (NCEP) Hourly Precipitation Data - NOAA/NCEP routinely develops
a National Multi-sensor Hourly Precipitation Analysis (Stage II) data set from
hourly radar precipitation estimates and from hourly gage reports. The gage data
includes hourly observations from ~4000 gages across the US (22 in Michigan)
collected by the NOAA River Forecast Centers and sent to NCEP. Further information
on these data is available at:
http://wwwt.emc.ncep.noaa.gov/mmb/ylin/pcpanl/. |
 |
| |
|
| NOAA/NWS Cooperative Observer 15-minute Precipitation Network - The NOAA/NWS
routinely collects 15-minute observations of precipitation from Fisher-Porter and Universal
rain gages operated by 2777 cooperative observers located throughout the US (57 in Michigan).
These data are archived at NOAA/NCDC as data set TD 3260. For further information visit the
NOAA/NCDC TD3260 page at:
http://ols.nndc.noaa.gov/plolstore/plsql/olstore.prodspecific?prodnum=C00505-TAP-A0001 |
 |
| |
|
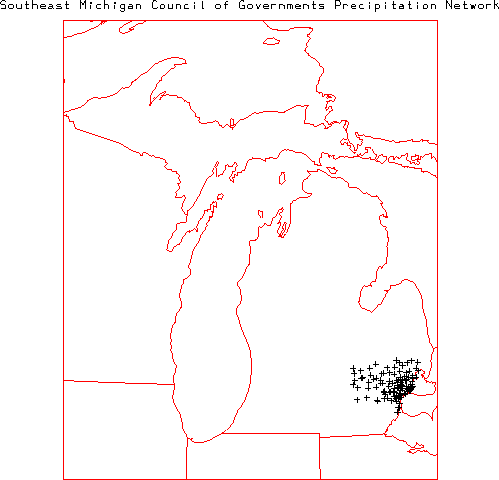
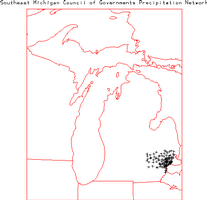
| Southeast Michigan Council of Governments (SEMCOG)
Precipitation Network - The SEMCOG operates this network of 109 gages that
provide hourly and daily observations of precipitation.
For further information visit the
SEMCOG Precipitation Network home page. |
 |
| |
|
| Weather Surveillance Radar 1988 Doppler (WSR-88D)
Network - The NOAA/NWS and the Department of Defense operate this network
of 143 WSR-88D radars across the contiguous US (4 in Michigan). The Level II
data are the three meteorological base data quantities (reflectivity, mean radial
velocity, and spectrum width) and are recorded at all NWS and most DOD sites.
Level II data are then processed in order to create a number of meteorological analysis
products known as Level III data. Level III data are recorded at the NWS sites. The
Level III products included base reflectivity, base spectrum width, base velocity,
composite reflectivity, echo tops, velocity azimuth display (VAD) wind profile,
vertically integrated liquid (VIL), 1-hour precipitation, storm total precipitation,
hail index overlay, mesocyclone overlay, severe weather probability overlay, storm
structure, storm tracking information overlay, and tornadic vortex signature overlay.
All Level II and III data are archived at NOAA/NCDC. For further information visit
the NOAA/NCDC Radar Resources page at:
http://www.ncdc.noaa.gov/oa/radar/radarresources.html or the NOAA Radar
Operations Center at:
http://www.roc.noaa.gov/. |
 |
| |
|
| Radiation and Flux Networks |
| |
|
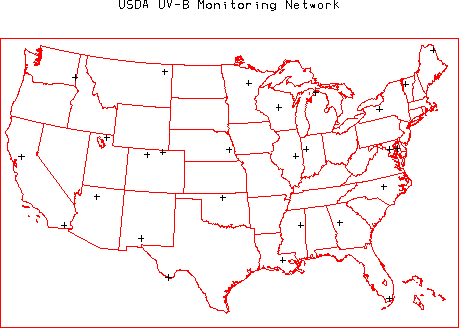
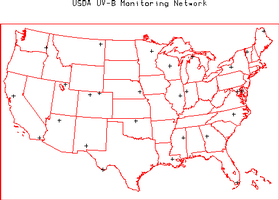
| United States Department of Agriculture (USDA)
UV-B Monitoring Network - The USDA operates this network of 29 stations
with locations throughout the US (1 in Michigan). The network provides
3-minute observations of spectral total/direct/diffuse radiation, air temperature,
relative humidity, solar radiation, barometric pressure, and photosynthetically
active radiation. For further information visit the
USDA UV-B Monitoring page. |
 |
| |
|
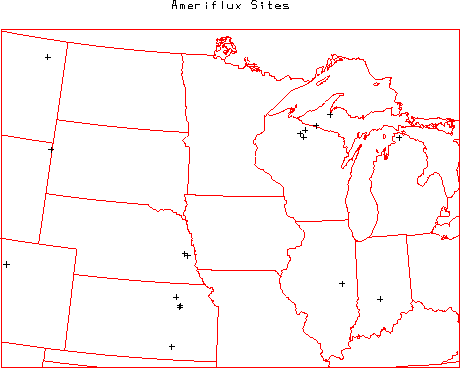
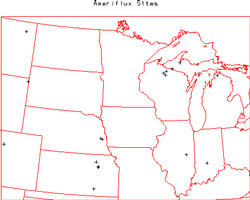
| Ameriflux Network - The Ameriflux network consists of 54 sites conducting
long-term measurements of CO2, water and energy fluxes throughout the US (3 in Michigan).
The typical observational frequency is 30 minutes. The parameters measured at each site
vary, but Ameriflux has defined a core set of parameters that most sites collect, including
fluxes of CO2, energy and water, basic meteorological and radiation parameters, and soil
temperature and moisture. For further information visit the Ameriflux home page at:
http://public.ornl.gov/ameriflux/Participants/Sites/Map/index.cfm. |
 |
| |
|
| Soil Networks |
| |
|
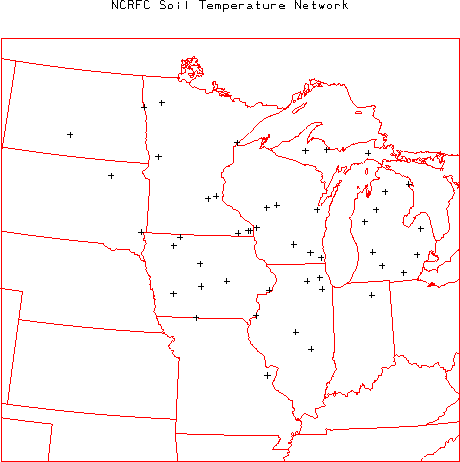
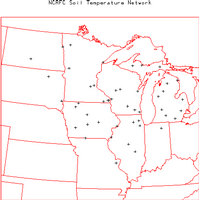
| North Central River Forecast Center (NCRFC) Soil Temperature Network -
The NCRFC operates this network of 47 stations (12 in Michigan) that collect weekly
readings of soil temperature at depths of 2, 4, 8, 20, 40 and 60 in at locations throughout
the north central US. For further information visit the
NCRFC Soil
Temperature Network web page. |
 |
| |
|
| Hydrology Networks |
| |
|
| United States Geological Survey (USGS) Streamflow
Network - The USGS (part of the US Department of the Interior) operates this
network of 7237 streamflow gages (145 in Michigan) at locations throughout the US.
The network provides hourly or more frequent observations of stage (water level) from
which discharge (flow) is computed using a stage-discharge rating relation. The
rating is defined by occasional direct current-meter measurements of discharge. All
data are available through the USGS and the district offices in each state. Many of
these gages provide realtime data
relayed via the GOES satellite data collection system. The realtime data are
provisional data that have not been reviewed or edited. These realtime data
may be subject to significant change and are not citeable until reviewed and approved
by the USGS. Realtime data may be changed after review because the stage-discharge
relationship may have been affected by: 1) backwater from ice or debris; 2) algal and
aquatic growth in the stream; 3) sediment movement; and 4) malfunction of recording
equipment. Each station record is considered provisional until the data are
published. The data are usually published with 6 months of the end of the water year
(1 October to 30 September). Data users are cautioned to consider carefully the
provisional nature of the information before using it. For further information on the
USGS streamflow network visit the
USGS Water Resources of the United States page or the
USGS Michigan District Office
home page. |
 |
| |
|
| Upper Air Networks |
| |
|
| NOAA/NWS Radiosonde Network Low Vertical Resolution Data - The NOAA/NWS
typically releases radiosondes twice per day at 0000 and 1200 UTC at 69 locations throughout
the US (2 in Michigan). During special weather situations the NWS can request to release
additional radiosondes at off-times (e.g. 1800 UTC). The low resolution data is sent out
over the Global Telecommunications System (GTS) and provides mandatory and significant level
observations of pressure, altitude, temperature, dew point, wind speed, and wind direction.
There are 3 types of radiosondes utilized within the US network, Vaisala, VIZ (or Sippican),
and Microsonde. These data are archived by NOAA/NCDC and other organizations. For further
information on the NWS Radiosonde network visit the
NWS Upper-air Observations Program
home page. A several year archive of GTS upper air data is available at the
NOAA/FSL Radiosonde Database. |
 |
| |
|
| NOAA/NWS Radiosonde Network High Vertical Resolution Data - The same
radiosonde locations mentioned in the previous data set also provide a 6-second vertical
resolution data set that provides observations of pressure, temperature, altitude,
relative humidity, and azimuth and elevation angles. UCAR/JOSS has developed software
to derive 6-second vertical resolution winds from the angle data. These data are
archived by NCDC and UCAR/JOSS. |
|
| |
|
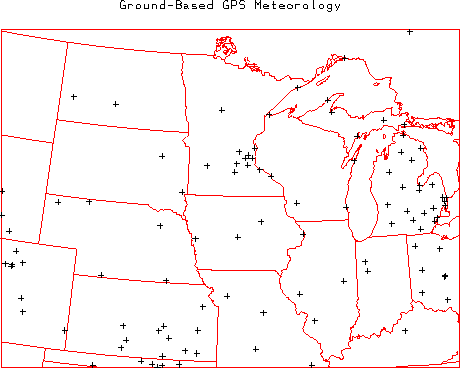
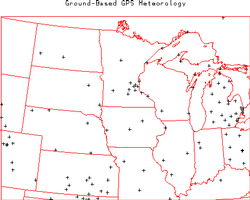
| Ground Based Global Positioning System (GPS) Meteorology Demonstration Network
(GPS-MET) - The NOAA/FSL ingests data from 323 GPS locations around the US
operated by many different agencies (27 in Michigan). Typically each location provides
30-minute observations of integrated precipitatable water along with a number of surface
meteorology parameters (air temperature, relative humidity, barometric pressure, etc).
For further information visit the
GPS-MET home page. |
 |
| |
|
| Aerosol Networks |
| |
|
| Aerosol Robotic Network (AERONET) - AERONET is an optical ground-based aerosol
monitoring network and data archive supported by NASA's Earth Observing System. The network
hardware consists of identical automatic sun-sky scanning spectral radiometers owned by national
agencies and universities. Data from this collaboration provides globally distributed (1 in Michigan)
near real time observations of aerosol spectral optical depths, aerosol size distributions and precipitable
water. For further information visit the
AERONET home page. |
 |
| |
|
| Coastal Networks |
| |
|
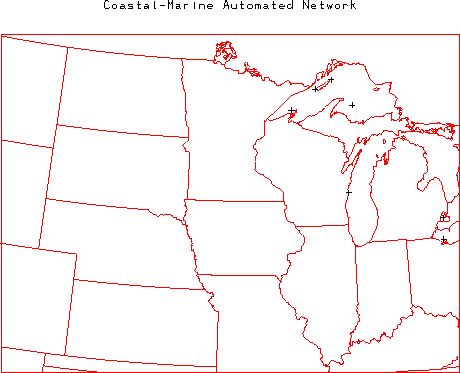
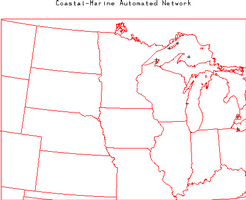
| Coastal-Marine Automated Network (C-MAN) -
The National Data Buoy Center (NDBC) operates this network of 55 C-MAN stations
with locations along coastlines throughout the US (4 in Michigan). The network
typically provides hourly observations of air temperature, barometric pressure,
wind speed, wind direction, and wind gust. Some stations also provide
observations of sea water temperature, water level, waves, relative humidity,
precipitation, and visibility. For further information visit the
NDBC home page. |
 |
| |
|
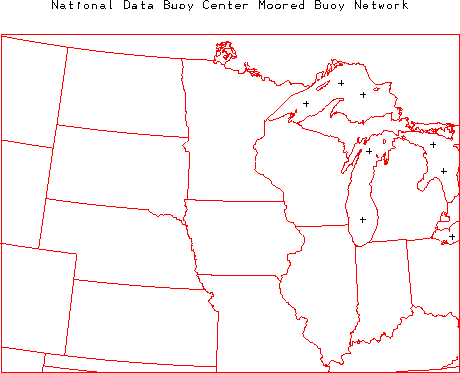
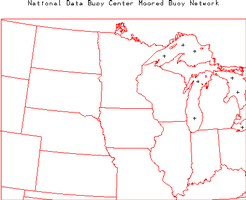
| National Data Buoy Center (NDBC) Moored Buoy
Network - The NDBC operates this network of 77 moored buoys with locations
throughout the US coastal regions (6 off the coast of Michigan). The network typically
provides hourly observations of air temperature, dew point, water temperature,
barometric pressure, wind speed, wind direction, wave height, wave period, and
swell. For further information visit the
NDBC home page. |
 |