| |
Click on the maps for larger image |
| |
|
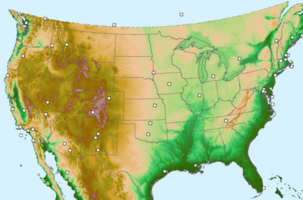
| Regional Surface Meteorological Networks |
| |
|
| United States Bureau of Reclamation (USBR) Agricultural Weather Networks
(AgriMet) - There are two networks included here with similar data collection
efforts. The USBR Great Plains Region operates the Great Plains Cooperative Agricultural
Weather Network that consists of 20 stations located in central and western Montana. The
USBR Pacific Northwest Region operates the Pacific Northwest Cooperative Agricultural
Weather Network that consists of 69 stations located throughout the Pacific Northwest
(primarily Washington, Oregon and Idaho) (1 in California). Both networks provide up to
15-minute observations of air temperature, dew point, relative humidity, precipitation,
solar radiation, wind speed, wind direction and wind gust. Other parameters collected at
some stations include soil temperature (at 1, 2, 4, 8, 20 and/or 40 inch depths),
barometric pressure, leaf wetness, and diffuse solar radiation. This network is included
as part of the University of Utah
MesoWest and NOAA/FSL
MADIS data sets. For further
information visit the
USBR Great
Plains Region AgriMet home page or the
USBR Pacific Northwest
Region AgriMet home page. |
 . . |
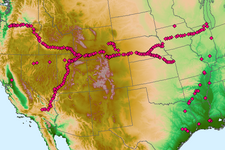
| Union Pacific Railroad Weather Station Network - The Union Pacific Railroad
operates this network of 264 weather stations (7 in California) located in the central and western United
States. Further information on Union Pacific is available on their
home page. This network is included as part of the University of Utah
MesoWest and NOAA/Earth
System Research Laboratory (ESRL) Global Systems Division (GSD)
MADIS data sets. |
 . . |
| KLAS WeatherNet - KLAS-TV in
Las Vegas, Nevada operatesthis network of 94 stations located primarily at
schools throughout Nevada (1 in California). The
network provides up to 1-minute observations of air temperature, relative
humidity, wind speed, wind direction, precipitation, and barometric pressure.
For further information visit the
KLAS
network page. |
No map. |
| |
|
| State and Local Surface Meteorological Networks |
| |
|
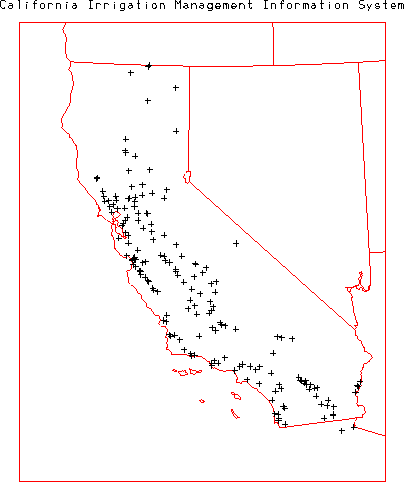
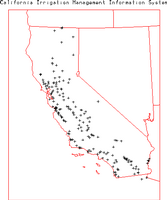
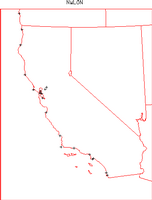
| California Irrigation Management Information
System (CIMIS) Network - The California Department of Water Resources operates
this network of meteorological stations for irrigation management purposes. The
network is comprised of 118 stations throughout the state of California. The network
provides hourly observations of air temperature, relative
humidity, wind speed, wind direction, solar radiation, precipitation, and soil
temperature (15 cm). For further information visit the
CIMIS home page. |
 |
| |
|
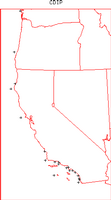
| California Data Exchange Center (CDEC) - The California Department of Water Resources operates
the CDEC which collects data from a number of networks throughout the state of California.
The parameters collected vary by station, but can include surface meteorology, snow, precipitation, river stage/flow, water levels, etc.
For further information visit the CDEC home page. |
|
| |
|
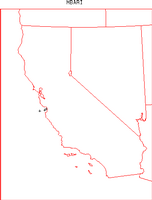
| Road Weather Information System (RWIS) - The California Department
of Transportation (CalTrans) operates this network of 14 stations located in Northern
California. The network provides variable temporal resolution observations of air
temperature, relative humidity, dew point, wind speed, wind direction, visibility, and
precipitation (yes/no). This network is included as part of the University of Utah
MesoWest and NOAA/Earth
System Research Laboratory (ESRL) Global Systems Division (GSD)
MADIS data sets.
For further information visit the
CalTrans RWIS
web page. |
 |
| |
|
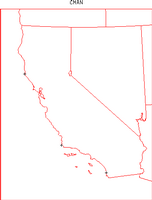
| China Lake Weather Station Network - The China Lake Naval Air Weapons
Stations (NAWS) operates this network 13 weather stations located around the China Lake
NAWS located at the south end of the Owens Valley in central California. Eight of the
stations provide 5 minute observations of wind direction, wind speed, wind gust, temperature,
relative humidity and station pressure. The other 5 stations provide hourly observations
of the same set of parameters as well as precipitation and solar radiation. For further
information visit the
China
Lake NAWS weather page. |
No map. |
| |
|
| Fort Irwin Weather Station Network - The Fort Irwin National Training
Center (NTC) operates this network of 16 weather stations located around the Fort Irwin
NTC located in the mountains between Death Valley and the Mojave Desert in central California.
The stations provide 10 minute observations of temperature, relative humidity, wind direction, wind speed,
wind gust, station pressure, and precipitation. For further information visit the
Fort Irwin
NTC weather page. |
| |
|
| California Air Quality Monitoring Network - The California Air Resources
Board operates this network of 158 stations located throughout the state of California.
The network provides hourly temporal resolution observations of a varying set of parameters
including air temperature, relative humidity, dew point, wind speed, wind direction, and
precipitation. For further information visit the
California Air Quality
Data web page.
This network is included in the University of Utah
MesoWest
and the NOAA/FSL MADIS
data sets. |
No map |
| |
|
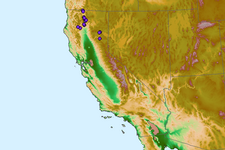
| Mt. Shasta Avalanche Center Network - The USDA Forest Service Mt. Shasta
Avalanche Center and Wilderness Department operates this network of four stations located
around Mt. Shasta in northcentral California. The network provides hourly temporal
resolution observations of temperature, pressure, precipitation and snow depth.
For further information visit the
Mt. Shasta Avalanche Center
web page.
This network is included in the University of Utah
MesoWest
and the NOAA/FSL MADIS
data sets. |
No map |
| |
|
| KPIX WeatherNet
- KPIX-TV in San Francisco, California operates this network of 65 stations located
primarily at schools throughout California. The
network provides up to 1-minute observations of air temperature, relative
humidity, wind speed, wind direction, precipitation, and barometric pressure.
For further information visit the
KPIX network page. |
No map yet. |
| KSBW WeatherNet
- WWBT-TV in Salinas-Monterey, California operates this network of 24 stations located
primarily at schools throughout California. The
network provides up to 1-minute observations of air temperature, relative
humidity, wind speed, wind direction, precipitation, and barometric pressure.
For further information visit the
KSBW network page. |
No map yet. |
| |
|
| KNSD WeatherNet
- KNSD-TV in San Diego, California operates this network of 63 stations located
primarily at schools throughout southern California. The
network provides up to 1-minute observations of air temperature, relative
humidity, wind speed, wind direction, precipitation, and barometric pressure.
For further information visit the
KNSD network page. |
No map yet. |
| |
|
| KNBC WeatherNet
- KNBC-TV in Los Angeles, California operates this network of 191 stations located
primarily at schools throughout California. The
network provides up to 1-minute observations of air temperature, relative
humidity, wind speed, wind direction, precipitation, and barometric pressure.
For further information visit the
KNBC network page. |
No map yet. |
| |
|
| Ventura County Watershed Protection District
ALERT Weather Station Network - The District operates an ALERT network that
includes 18 weather stations located throughout the county. The network provides
hourly observations of air temperature, relative humidity, wind speed, wind direction,
barometric pressure and precipitation. Further information at the
Ventura
County Watershed Protection District ALERT page. |
 |
| |
|
| Napa Valley Rainfall and Stream Level Information System Weather Station
Network - The city of Napa operates this network of four weather stations.
The network provides 15 minute observations of pressure, temperature, relative
humidity, wind speed, wind direction, and precipitation. For further information
visit the
Napa
Valley Rainfall and Stream Level Information System home page. |
No map. |
| |
|
| Monterey County ALERT Weather Station Network - The county of
Monterey operates this network of three weather stations.
The network provides 15 minute observations of pressure, temperature, relative
humidity, wind speed, wind direction, and precipitation. For further information
visit the
Monterey County ALERT home page. |
No map. |
| |
|
| Marin County ALERT Weather Station Network - The county of Marin
operates this network of two weather stations.
The network provides 15 minute observations of pressure, temperature, relative
humidity, wind speed, wind direction, and precipitation. For further information
visit the
Marin County ALERT home page. |
No map. |
| |
|
| Sacramento County ALERT Weather Station
Network - The County of Sacramento operates an ALERT network that includes 8
weather stations throughout the county. The network provides 15-minute observations
of air temperature, relative humidity, wind speed, wind direction, barometric pressure,
and precipitation. Further information at:
http://www.sacflood.org/. |
 |
| |
|
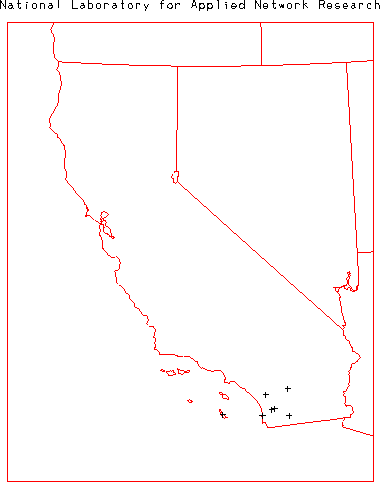
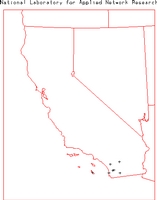
| National Laboratory for Applied Network
Research (NLANR) Network - The NLANR operates this network of 7 stations with
locations in far southwestern California. The network provides 5-minute observations
of air temperature, relative humidity, barometric pressure, wind speed, wind direction,
and precipitation. For futher information visit the
NLANR page. |
 |
| |
|
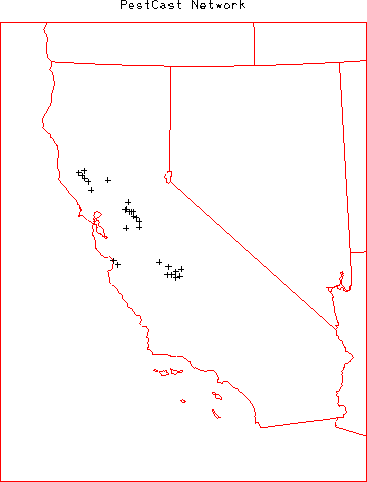
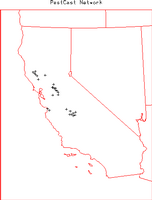
| California PestCast Networks -
The University of California Statewide Integrated Pest Management Program collects
data from a number of special agricultural weather station networks. These networks
include the Fresno County Grape (8 stations), the Lake County Pear and Grape (6
stations), the Coastal Strawberry (2 stations), the San Joaquin WEATHERNET (12
stations), and the California Tomato. All these networks except the Tomato are
operated year-round. The California Tomato network is usually operated from late
March to October and at a varying set of locations in the area west of Sacramento
and around Modesto and Stockton, California (12 stations; not included on the map).
For further information visit the
PestCast page. |
 |
| |
|
| San Bernardino County ALERT Weather Station
Network - San Bernardino County operates this ALERT network that includes 4
weather stations around the county. The network provides 15-min observations of air
temperature, relative humidity, wind speed, wind direction, and barometric pressure.
Further information at:
http://www.co.san-bernardino.ca.us/trnsprtn/pwg/. |
 |
| |
|
| California Weather Network for Schools - Further information at:
http://www.pgjr.alpine.k12.ut.us/science/james/aws-swcal.html
|
| |
|
| Precipitation and Radar Networks |
| |
|
| NOAA/National Centers for Environmental
Prediction (NCEP) Hourly Precipitation Data - NOAA/NCEP routinely develops
a National Multi-sensor Hourly Precipitation Analysis (Stage II) data set from
hourly radar precipitation estimates and from hourly gage reports. The gage data
includes hourly observations from ~4000 gages across the US (388 in California)
collected by the NOAA River Forecast Centers and sent to NCEP. Further information
on these data is available at:
http://wwwt.emc.ncep.noaa.gov/mmb/ylin/pcpanl/. |
 |
| |
|
| NOAA/NWS Cooperative Observer 15-minute Precipitation Network - The
NOAA/NWS
routinely collects 15-minute observations of precipitation from Fisher-Porter and Universal
rain gages operated by 2777 cooperative observers located throughout the US (285 in California).
These data are archived at NOAA/National Climatic Data Center (NCDC) as data set TD 3260.
For further information visit the NOAA/NCDC TD3260 page at:
http://ols.nndc.noaa.gov/plolstore/plsql/olstore.prodspecific?prodnum=C00505-TAP-A0001 |
 |
| |
|
| Snowpack Telemetry (SNOTEL) Network - The United States Department of
Agriculture Natural Resources Conservation Service (NRCS) operates this network of 754
stations with locations throughout the mountainous areas of the western US (28 in
California). The temporal resolution and parameters measured vary by station. Up to hourly
observations of air temperature, precipitation, snow depth, and snow water content are
typically provided. Other parameters that may be available include relative humidity, wind
speed, wind direction, solar radiation, soil moisture, and soil temperature. These data
are archived by the NRCS, Western Regional Climate Center, and other. For further
information visit the
NRCS SNOTEL Data Network
home page or the
Western Regional Climate Center SNOTEL data page or the
US Bureau
of Reclamation SNOTEL page. |
 |
| |
|
| USDA/NRCS Snow Survey Program - The USDA/NRCS Snow Survey Program
provides mountain snow course data at approximately 800 locations throughout the
western US. For further information visit the
USDA/NRCS Snow
Course Data Network page and the
California Cooperative
Snow Surveys page. |
No Map. |
| |
|
| Santa Clara Valley Water District ALERT
Precipitation Network - The District operates an ALERT network that includes
43 precipitation gages in the Santa Clara Valley region of west central California.
The temporal resolution varies.
Further information at:
http://alert.valleywater.org/. |
 |
| |
|
| Napa Valley Rainfall and Stream Level Information System Precipitation
Network - The city of Napa operates this network of 23 precipitation gauges.
The network provides hourly observations of precipitation. For further information
visit the
Napa
Valley Rainfall and Stream Level Information System home page. |
No map. |
| |
|
| Santa Barbara County Precipitation Network - The county of Santa Barbara operates this network of 19 precipitation gauges.
The network provides hourly observations of precipitation. For further information visit the
Santa Barbara County Precipitation Network home page and the
Santa Barbara County Hydrology home page. |
No map. |
| |
|
| Los Angeles County Precipitation Network - The county of Los Angeles operates this network of 62 precipitation gauges.
Additionally, there are 148 manual observations providing daily data and 94 ALERT gages.
For further information visit the
Los Angeles
County Precipitation Network home page. |
No map. |
| |
|
| Orange County ALERT Precipitation
Network - The county of Orange operates this network of about 60 precipitation gauges.
The gages provide observations every 8 to 12 minutes.
For further information visit the
Orange
County Precipitation Network home page. |
No map. |
| |
|
| Monterey County ALERT Precipitation Network - The county of
Monterey operates this network of 34 precipitation gages.
The network provides 15 minute observations of precipitation.
For further information visit the
Monterey County ALERT home page. |
No map. |
| |
|
| Contra Costa County Rainfall Network - The county of Contra Costa
operates this network of 20 precipitation gauges.
The network provides 15 minute observations of precipitation. For further information
visit the
Contra Costa County Rainfall Network home page. |
No map. |
| |
|
| San Joaquin County ALERT Precipitation
Network - The county of San Joaquin operates this network of 19 precipitation gauges.
The network provides hourly observations of precipitation. For further information
visit the
San Joaquin
County ALERT home page. |
No map. |
| |
|
| Marin County ALERT Precipitation Network - The county of Marin
operates this network of five precipitation stations. For further information
visit the
Marin County ALERT home page. |
No map. |
| |
|
| Ventura County Watershed Protection District
ALERT Precipitation Network - The District operates an ALERT network that
includes 184 precipitation gages located throughout the county. The network provides
hourly observations of precipitation. Further information at the
Ventura
County Watershed Protection District ALERT page. |
 |
| |
|
| Sacramento County ALERT Precipitation
Network - The County of Sacramento operates an ALERT network that includes 74
precipitation gages throughout the county. The network provides 15-minute observations
of precipitation. Further information at:
http://www.sacflood.org/. |
 |
| |
|
| Orange County ALERT Precipitation Network -
Orange County operates this ALERT network which includes 65 precipitaion gages located
around the county. The network provides hourly observations of precipitation. Further
information at:
http://bos.ocgov.com/alertoc/alertoc.asp. |
No map |
| |
|
| San Bernardino County ALERT Precipitation
Network - San Bernardino County operates this ALERT network that includes 367
precipitation gages around the county. The network provides 15-min observations of
precipitation. Further information at:
http://www.sbcounty.gov/dpw/floodcontrol/water_resources.asp. |
 |
| |
|
| City of Roseville ALERT Network - The City of Roseville operates this ALERT network that includes precipitation and
stream gauges around the city. Further information at:
http://www.roseville.ca.us/pw/engineering/floodplain_management/roseville_current_stream_levels/default.asp. |
|
| |
|
| Weather Surveillance Radar 1988 Doppler (WSR-88D)
Network - The NOAA/NWS and the Department of Defence operate this network
of 143 WSR-88D radars across the continguous US (10 in California). The Level II
data are the three meteorological base data quantities (reflectivitiy, mean radial
velocity, and spectrum width) and are recorded at all NWS and most DOD sites.
Level II data are then processed in order to create a number of meteorological analysis
products known as Level III data. Level III data are recorded at the NWS sites. The
Level III products included base reflectivity, base spectrum width, base velocity,
composite reflectivity, echo tops, velocity azimuth display (VAD) wind profile,
vertically integrated liquid (VIL), 1-hour precipitation, storm total precipitation,
hail index overlay, mesocyclone overlay, severe weather probability overlay, storm
structure, storm tracking information overlay, and tornadic vortex signature overlay.
All Level II and III data are archived at NOAA/NCDC. For further information visit
the NOAA/NCDC Radar Resources page at:
http://www.ncdc.noaa.gov/oa/radar/radarresources.html or the NOAA Radar
Operations Center at:
http://www.roc.noaa.gov/. |
 |
| |
|
| Radiation and Flux Networks |
| |
|
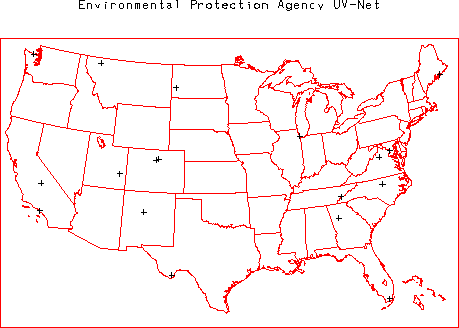
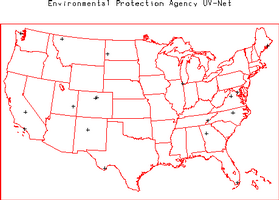
| Environmental Protection Agency (EPA) Ultraviolet
Monitoring Program (UV-Net) - The EPA operates this network of 20 Brewer
spectrophotometers throughout the US (2 in California). The network provides observations of
full-sky spectrally resolved solar radiation in the UV-B and UV-A bands. The
irradiance and total column ozone concentrations are derived from these data.
For further information visit the
EPA UV-Net page. |
 |
| |
|
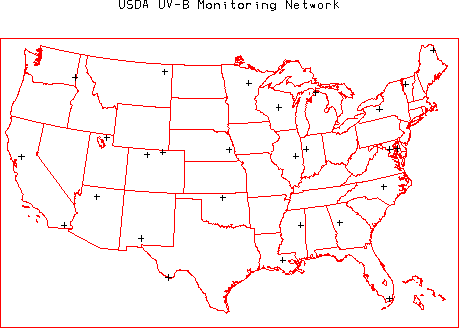
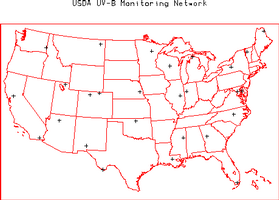
| United States Department of Agriculture (USDA)
UV-B Monitoring Network - The USDA operates this network of 29 stations
with locations throughout the US (2 in California). The network provides
3-minute observations of spectral total/direct/diffuse radiation, air temperature,
relative humidity, solar radiation, barometric pressure, and photosynthetically
active radiation. For further information visit the
USDA UV-B Monitoring page. |
 |
| |
|
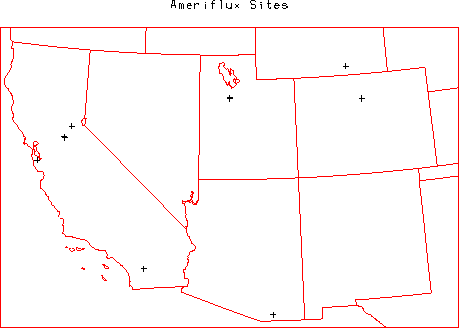
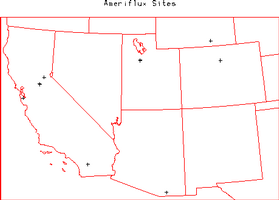
| Ameriflux Network - The Ameriflux network consists of 54 sites conducting
long-term measurements of CO2, water and energy fluxes throughout the US (5 in California).
The typical observational frequency is 30 minutes. The parameters measured at each site
vary, but Ameriflux has defined a core set of parameters that most sites collect, including
fluxes of CO2, energy and water, basic meteorological and radiation parameters, and soil
temperature and moisture. For further information visit the Ameriflux home page at:
http://public.ornl.gov/ameriflux/Participants/Sites/Map/index.cfm. |
 |
| |
|
| Soil Networks |
| |
|
| None at present |
|
| |
|
| Hydrology Networks |
| |
|
| California Water Data Library - The California Department of Water Resources
CEPA operates this resource that collects data from a number of groundwater and water quality
networks throughout the state of California.
For further information visit the Home Page. |
|
| |
|
| United States Geological Survey (USGS) Streamflow
Network - The USGS (part of the US Department of the Interior) operates this
network of 7237 streamflow gages (375 in California) at locations throughout the US.
The network provides hourly or more frequent observations of stage (water level) from
which discharge (flow) is comuputed using a stage-discharge rating relation. The
rating is defined by occasional direct current-meter measurements of discharge. All
data are available through the USGS and the district offices in each state. Many of
these gages provide realtime data
relayed via the GOES satellite data collection system. The realtime data are
provisional data that have not been reviewed or edited. These realtime data
may be subject to significant change and are not citeable until reviewed and approved
by the USGS. Realtime data may be changed after review because the stage-discharge
relationship may have been affected by: 1) backwater from ice or debris; 2) algal and
aquatic growth in the stream; 3) sediment movement; and 4) malfunction of recording
equipment. Each station record is considered provisional until the data are
published. The data are usually published with 6 months of the end of the water year
(1 October to 30 September). Data users are cautioned to consider carefully the
provisional nature of the information before using it. For further information on the
USGS stremflow network visit the
USGS Water Resources of the
United States page or the
USGS California District Office
home page. |
 |
| |
|
| Santa Clara Valley Water District ALERT
Streamflow, Stage, and Reservoir Gauge Network - The District operates an
ALERT network that includes 13 stage only stream gauges, 17 streamflow and stage
gauges, and 11 reservoir gauges. The temporal resolution varies. Clara, California
region. Further information at:
http://alert.valleywater.org/. |
No map |
| |
|
| Napa Valley Rainfall and Stream Level Information System Streamflow
Network - The city of Napa operates this network of 20 streamflow gauges.
The network provides 15 minute observations of streamflow. For further information
visit the
Napa
Valley Rainfall and Stream Level Information System home page. |
No map. |
| |
|
| San Luis Obispo County ALERT Network - The county of San Luis Obispo operates this network of precipitation and streamflow
gauges. For further information visit the
San Luis Obispo ALERT home page. |
No map. |
| |
|
| Monterey County ALERT Streamflow Network - The county of
Monterey operates this network of 30 streamflow gages.
The network provides 15 minute observations of streamflow.
For further information visit the
Monterey County ALERT home page. |
No map. |
| |
|
| San Joaquin County ALERT Streamflow
Network - The county of San Joaquin operates this network of 12 streamflow gauges.
The network provides hourly observations of streamflow. For further information
visit the
San Joaquin
County ALERT home page. |
No map. |
| |
|
| Marin County ALERT Streamflow Network - The county of Marin
operates this network of three streamflow stations. For further information
visit the
Marin County ALERT home page. |
No map. |
| |
|
| Ventura County Watershed Protection District
ALERT Streamflow and Stage Network - The District operates an ALERT network that
includes 34 streamflow ang stage gages located throughout the county. The network provides
hourly observations of streamflow and/or stage. Further information at the
Ventura County
Watershed Protection District ALERT page. |
 |
| |
|
| Sacramento County ALERT Stream Level
Network - The County of Sacramento operates an ALERT network that includes 51
stream level gages throughout the county. The network provides 15-minute observations
of stream level and stage. Further information at:
http://www.sacflood.org/. |
 |
| |
|
| San Bernardino County ALERT Precipitation
Network - San Bernardino County operates this ALERT network that includes 76
stream level gages around the county. The network provides daily observations of
of peak and average streamflow. Further information at:
http://www.co.san-bernardino.ca.us/trnsprtn/pwg/. |
 |
| |
|
| Upper Air Networks |
| |
|
| NOAA/NWS Radiosonde Network Low Vertical Resolution Data - The NOAA/NWS
typically releases radiosondes twice per day at 0000 and 1200 UTC at 69 locations throughout
the US (2 in California). During special weather situations the NWS can request to release
additional radiosondes at off-times (e.g. 1800 UTC). The low resolution data is sent out
over the Global Telecommunications System (GTS) and provides mandatory and significant level
observations of pressure, altitude, temperature, dew point, wind speed, and wind direction.
There are 3 types of radiosondes utilized within the US network, Vaisala, VIZ (or Sippican),
and Microsonde. These data are archived by NOAA/NCDC and other organizations. For further
information on the NWS Radiosonde network visit the NWS radiosonde network home page at:
http://www.ua.nws.noaa.gov. |
 |
| |
|
| NOAA/NWS Radiosonde Network High Vertical Resolution Data - The same
radiosonde locations mentioned in the previous data set also provide a 6-second vertical
resolution data set that provides observations of pressure, temperature, altitude,
relative humidity, and azimuth and elevation angles. UCAR/JOSS has developed software
to derive 6-second vertical resolution winds from the angle data. These data are
archived by NCDC and UCAR/JOSS. |
|
| |
|
| Cooperative Agency Profiler (CAP) Network - The NOAA/FSL ingests data
from wind profilers and RASS operated by a number of cooperating agencies. Most of
these profilers are 915 MHz, but some are 449 or 50 MHz. Most provide hourly observations
of wind speed and direction. The number and location of these can vary through time. As
this is being written the network included 58 locations within the US (19 in California).
Most of the sites are along the US West Coast and in the northeastern US. For further
information visit the
CAP home page.
The Naval Postgraduate School also has a
Coastal
Wind Profiler page containing the California profiler data. |
 |
| |
|
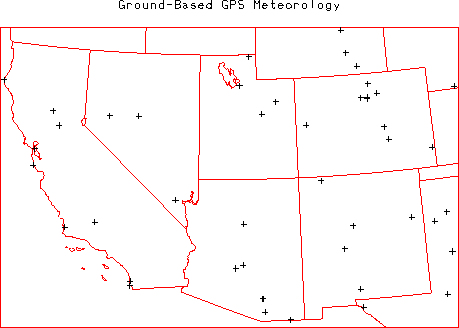
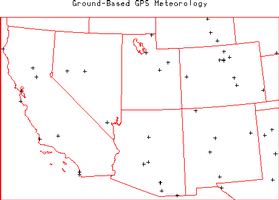
| Ground Based Global Positioning System (GPS) Meteorology Demonstration Network
(GPS-MET) - The NOAA/FSL ingests data from 323 GPS locations around the US
operated by many different agencies (9 in California). Typically each location provides
30-minute observations of integrated precipitatable water along with a number of surface
meteorology parameters (air temperature, relative humidity, barometric pressure, etc).
For further information visit the GPS-MET home page at:
http://www.gpsmet.noaa.gov/jsp/index.jsp. |
 |
| |
|
| Aerosol Networks |
| |
|
| Aerosol Robotic Network (AERONET) - AERONET is an optical ground-based aerosol
monitoring network and data archive supported by NASA's Earth Observing System. The network
hardware consists of identical automatic sun-sky scanning spectral radiometers owned by national
agencies and universities. Data from this collaboration provides globally distributed (8 in California)
near real time observations of aerosol spectral optical depths, aerosol size distributions and precipitable
water. For further information visit the
AERONET home page. |
 |
| |
|
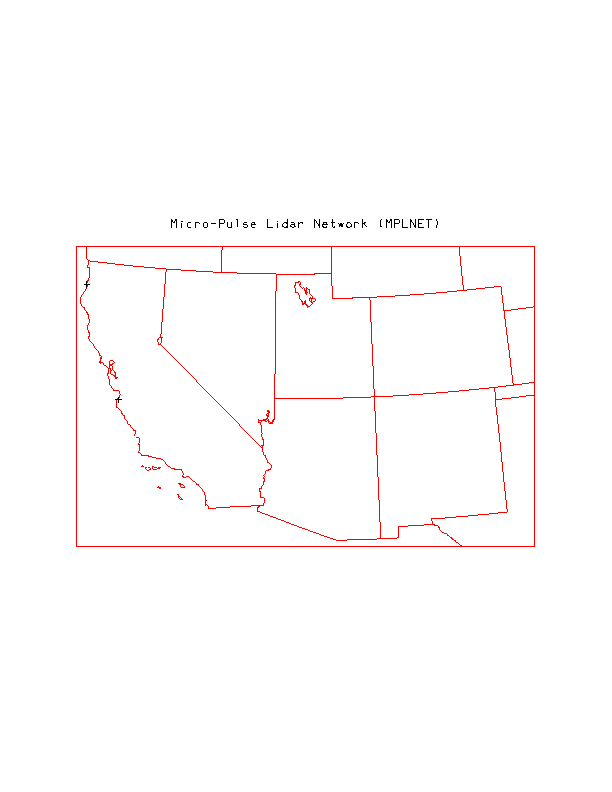
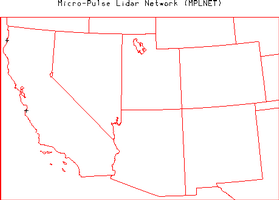
| Micro-Pulse Lidar Network (MPLNET) - MPLNET is comprised of ground-based lidar systems
that are co-located with sun/sky photometer sites in the NASA AERONET. Basic data from the MPL include
aerosol and cloud layer heights. The primary purpose of MPLNET is to acquire long-term observations of
aerosol and cloud vertical structure at sites around the world (2 in California). For further information
visit the MPLNET home page. |
 |
|
| |
|
| Coastal Networks |
| |
|
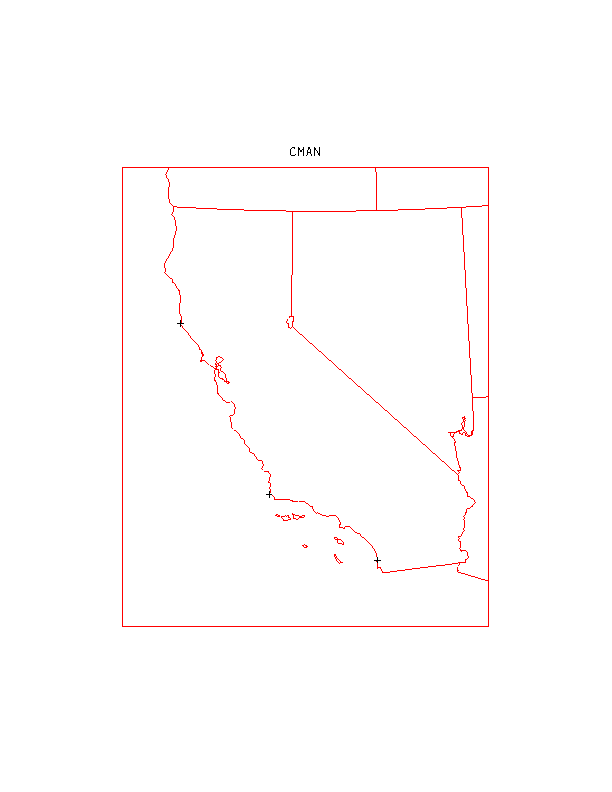
| Coastal-Marine Automated Network (C-MAN) -
The National Data Buoy Center (NDBC) operates this network of 55 C-MAN stations
with locations along coastlines throughout the US (3 in California). The network
typically provides hourly observations of air temperature, barometric pressure,
wind speed, wind direction, and wind gust. Some stations also provide
observations of sea water temperature, water level, waves, relative humidity,
precipitation, and visibility. For further information visit the
NDBC home page. |
 |
| |
|
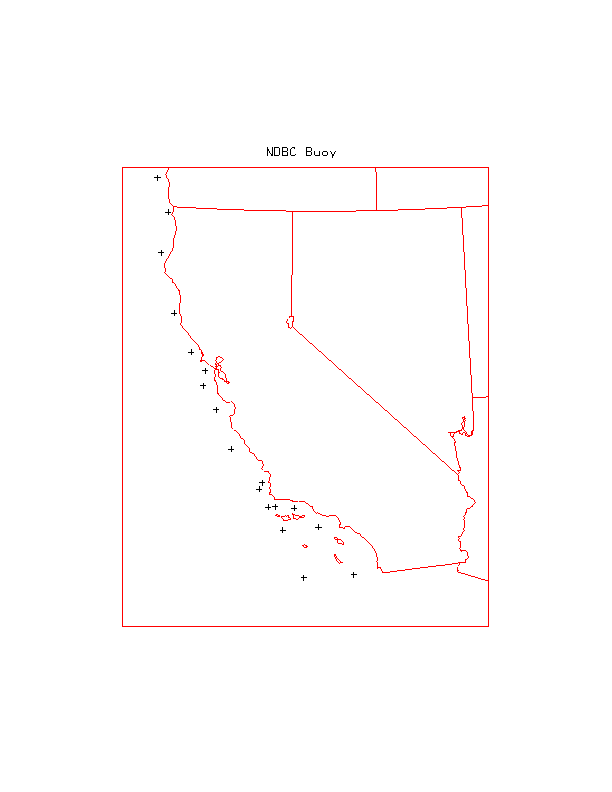
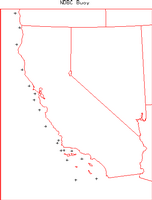
| National Data Buoy Center (NDBC) Moored Buoy
Network - The NDBC operates this network of 77 moored buoys with locations
throughout the US coastal regions (20 off the coast of California). The network typically
provides hourly observations of air temperature, dew point, water temperature,
barometric pressure, wind speed, wind direction, wave height, wave period, and
swell. For further information visit the
NDBC home page. |
 |
| |
|
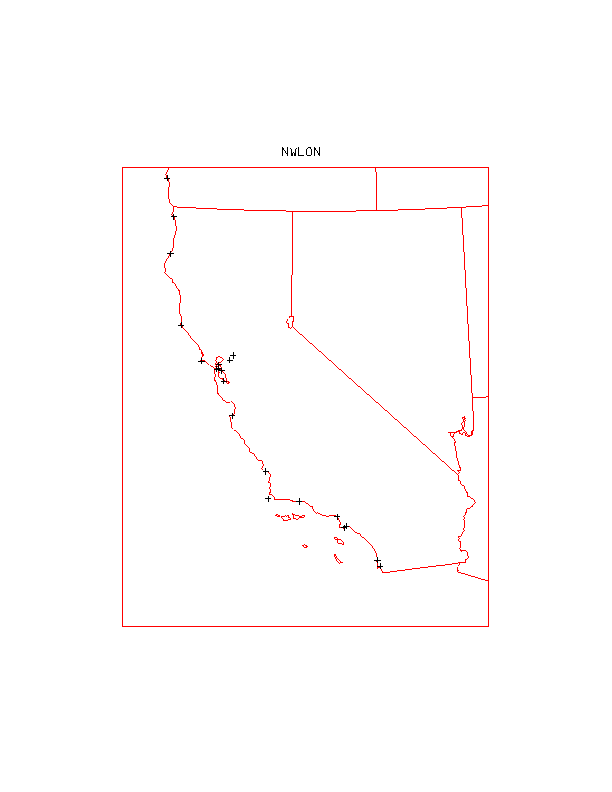
| National Water Level Observation Network (NWLON) - The National
Ocean Service (NOS) Center for Operational Oceanographic Products and Services (CO-OPS)
maintains a long-term database containing water-level
measurements and derived tidal data. NWLON provides water level observations at 318
locations throughout the United States. Some stations provide additional measurements
including air and water temperature, pressure and winds. For additional information
visit the NWLON web page. |
 |
| |
|
| WeatherFlow National Coastal Mesonet - WeatherFlow, Inc
operates this proprietary network of weather station at coastal locations in the
United States. For further information visit the
WeatherFlow National Coastal Mesonet
web page. |
| |
|
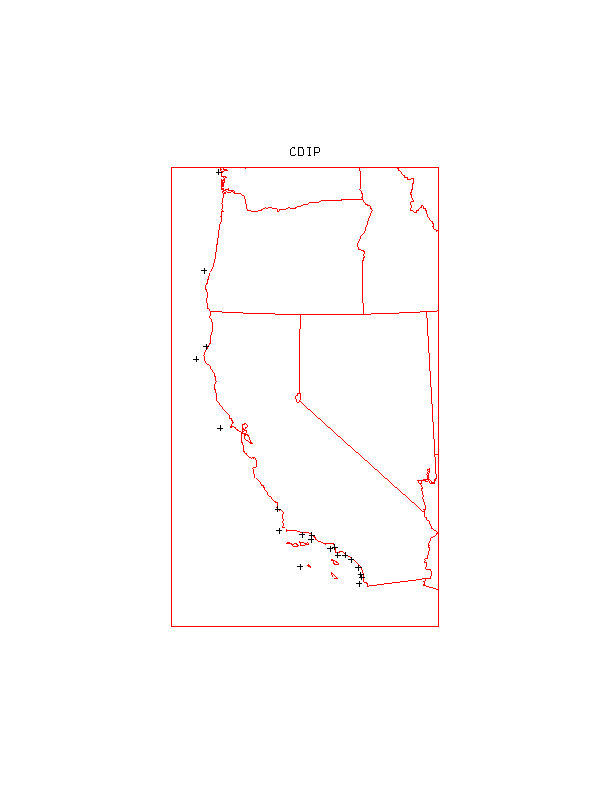
| Coastal Data Information Program (CDIP) - The Scripps Institution of
Oceanography operates this network of 20 Waverider buoys along the US Pacific coast.
These stations provide up to 30 minute resolution observations of
parameters including water temperature and wave information. For further information
visit the CDIP web page. |
 |
| |
|
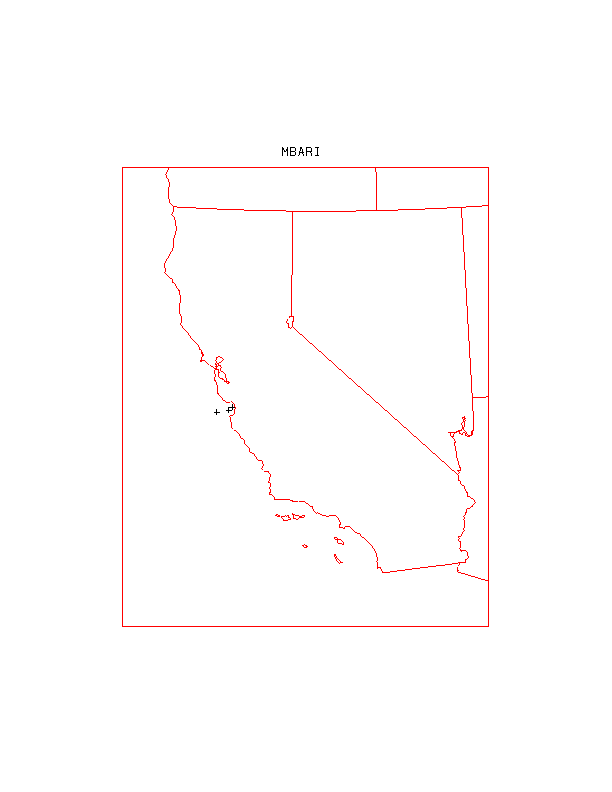
| Monterey Bay Aquarium Research Institute (MBARI) Buoys - MBARI
operates this network of three buoys that provide hourly observations of meteorological
(wind, pressure and air temperature) and oceanographic (water temperature) parameters.
For further information visit the MBARI
web page. |
 |
 .
. .
.