The SMART-R radar in DYNAMO was set-up on a soft sandbar surrounded by water on three sides. The radar apparently tilted during the early part of the project. This tilt was noted by Jon Fliegel during analysis, and corrections applied. Fliegel determined that the radar was tilted about 0.75 off of horizontal, with the direction of maximum downward tilt toward 285 degrees azimuth. Further analysis by University of Washington researchers indicated that there also seems to be an absolute bias in the elevation angle, with the antenna pointing lower than is reported by the data system, possibly by as much as 1.5 degrees. The UW analysis looked at cloud top height, integrated over many days of precipitation events.
Unresolved in the UW analysis is the time history of any change in the radar tilt. It would also be useful to have somewhat independent confirmation of the UW tilt estimates by another means. Logically, analysis of radar bright bands could allow episodic evaluation of any tilt change and any bias in elevation angle, both.
An edited pdf describing the analysis is available.
A good case study of a bright band would include extensive stratiform precip with echoes uniformly distributed fully around the radar and extending through the melting layer. The melting layer should have zero or known tilt. Such cases were extremely rare during DYNAMO. Only one really good case was found, and one other fair case. Several other possible, but likely very marginal, cases were found. All cases had only brief periods of existence. Cases, in time order, are listed.
	      Date/time     Comments

	   20110124 06:18   fair case; bb at 4300-4400 m
	   20111123 16:34   very good case; bb at 4600 m

	   20111127 21:43   shows promise at high tilts
	   20111127 22:03   marginal case
	   20111219 07:33   partial circle only
	   20111221 11:18   weak bb
	   20111221 13:03
	   20111222 20:34   high tilts, only; half circle
Only cases for 24-Oct and 23-Nov have been analyzed and reported here.
The bright band is never really uniform, and there may be tilt to, or undulations in, the bright band. The bright band may contain convective elements, causing the thickness of the bright band to vary. The analysis itself is extremely sensitive to the expected height of the bright band. The bright band tends to be "fuzzier" at low elevation angles, but high tilts are less effective for diagnosing a tilt to the radar platform. Any tilt below about 10 degrees elevation is very marginal for this work.
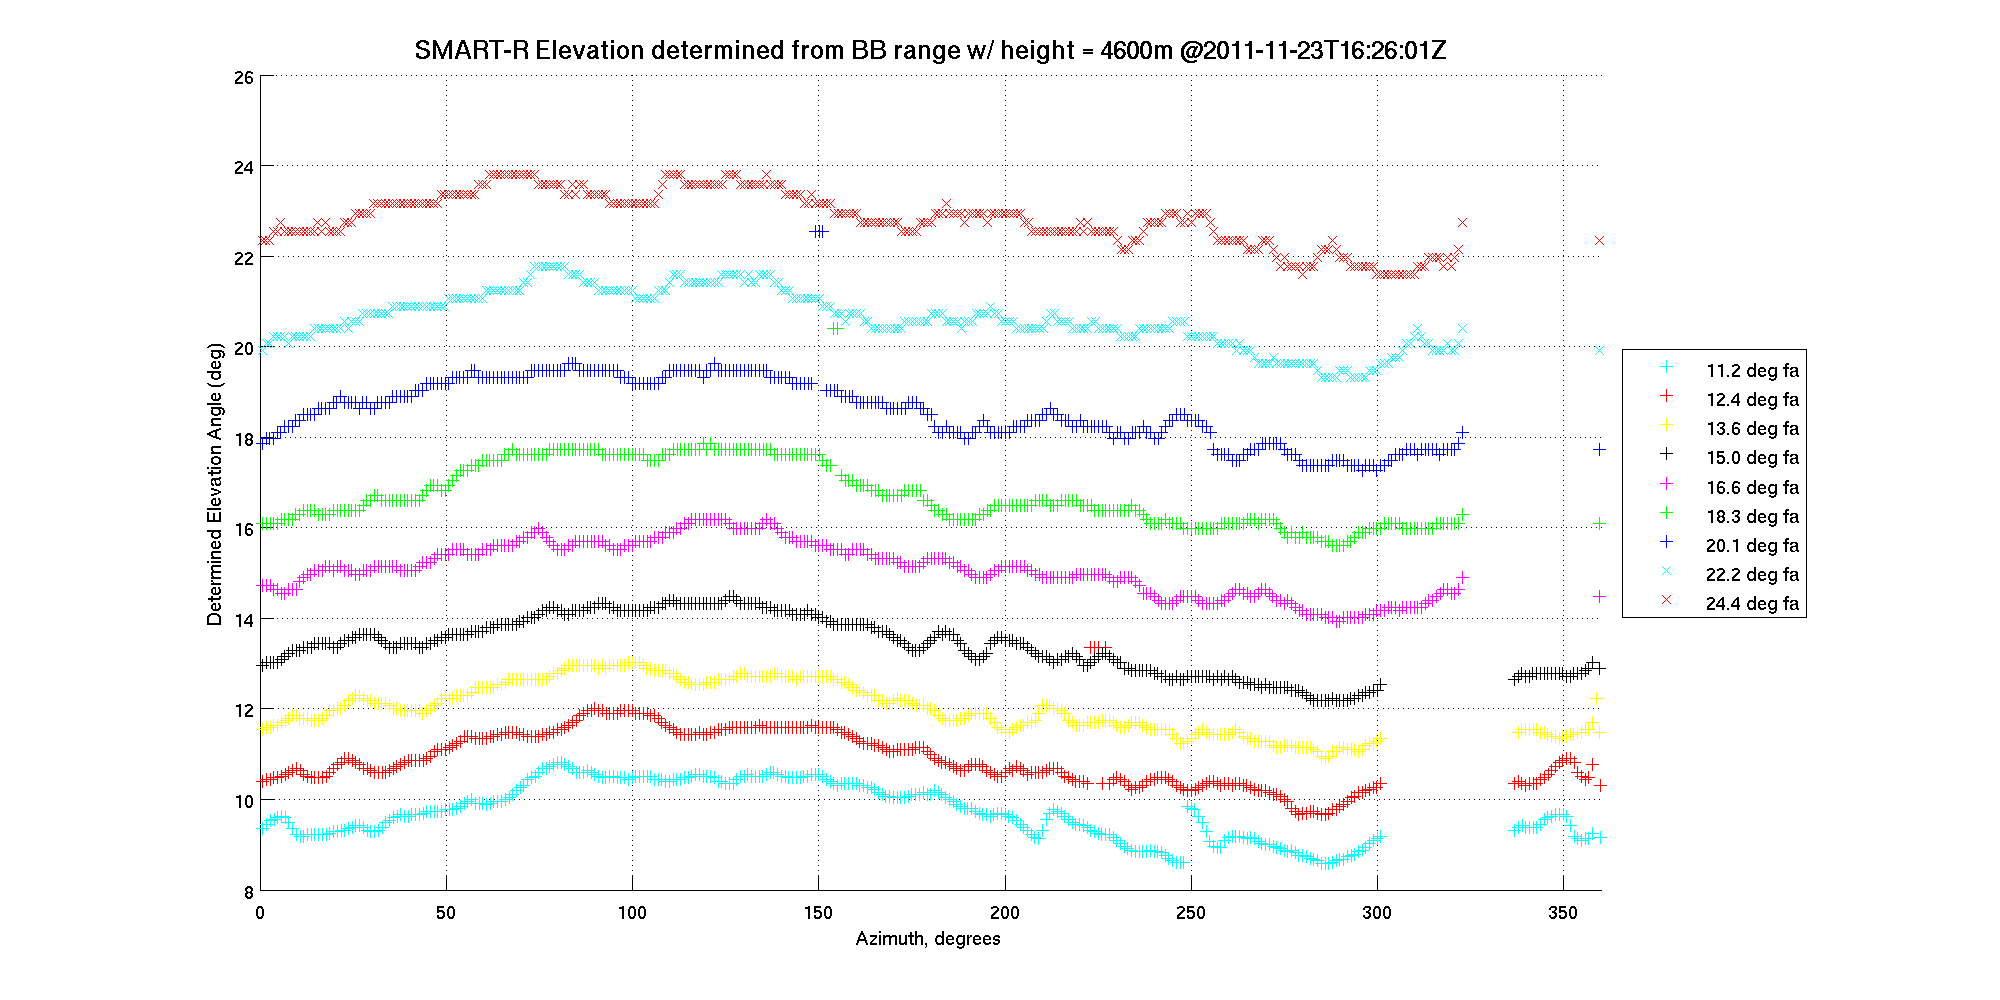
The bright band for 23-Nov-2011 near 16:34Z is analyzed. The height of the bright band was determined from S-Pol data, and was found to be close to 4600 meters, with no apparent tilt to the melting layer (look here for S-Pol RHIs).
To determine the location of the bright band from SMART-R data, the data were first smoothed using a median filter (7 gates along the radial; 5 beams in the azimuthal direction), windowed for the approximate region of the bright band, then a polynomial fit was applied (along the radial) to the smoothed and windowed data. The maximum reflectivity gate for each azimuth was then found from the polynomial fitted data. [It should be noted that, since this was a proof-of-concept analysis, shortcuts were taken and edge effects for smoothing were not particularly well-handled.] Successive steps in the smoothing process are shown in figure 1; similar plots for all tilts for the 24-Oct and 23-Nov cases are available.
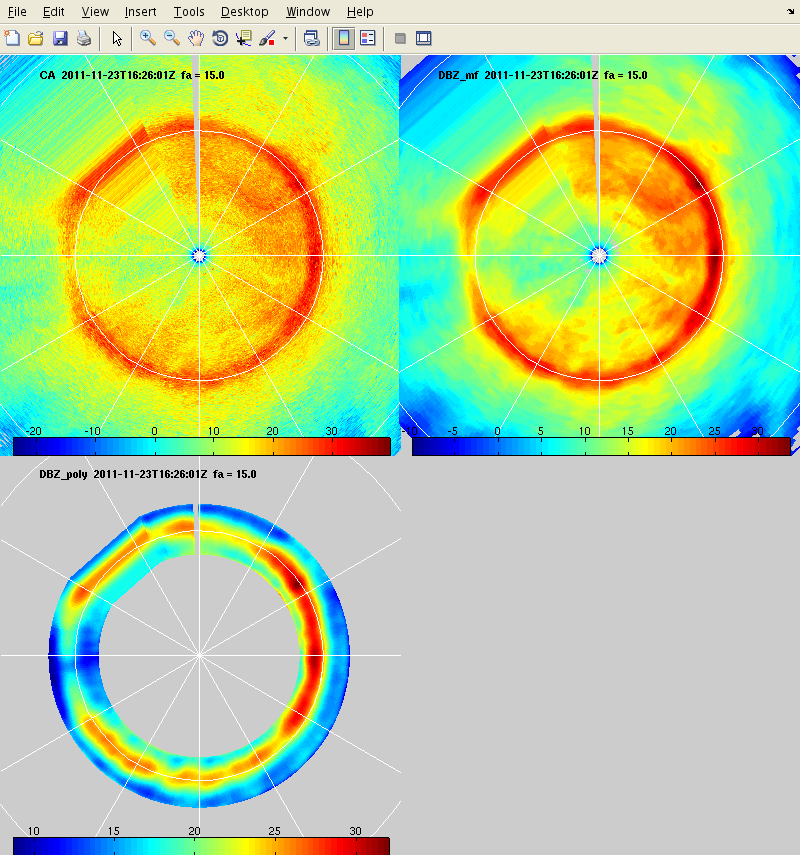
Figure 1: Original reflectivity for SMART-R showing a bright band, upper left panel. Other panels show progressively smoothed reflectivity. Note that color bars are self-scaling. Smeared beams in the NW wedge are an artifact of the plotting process, and are missing data that were not included in the analysis.
After data smoothing, the following was done:
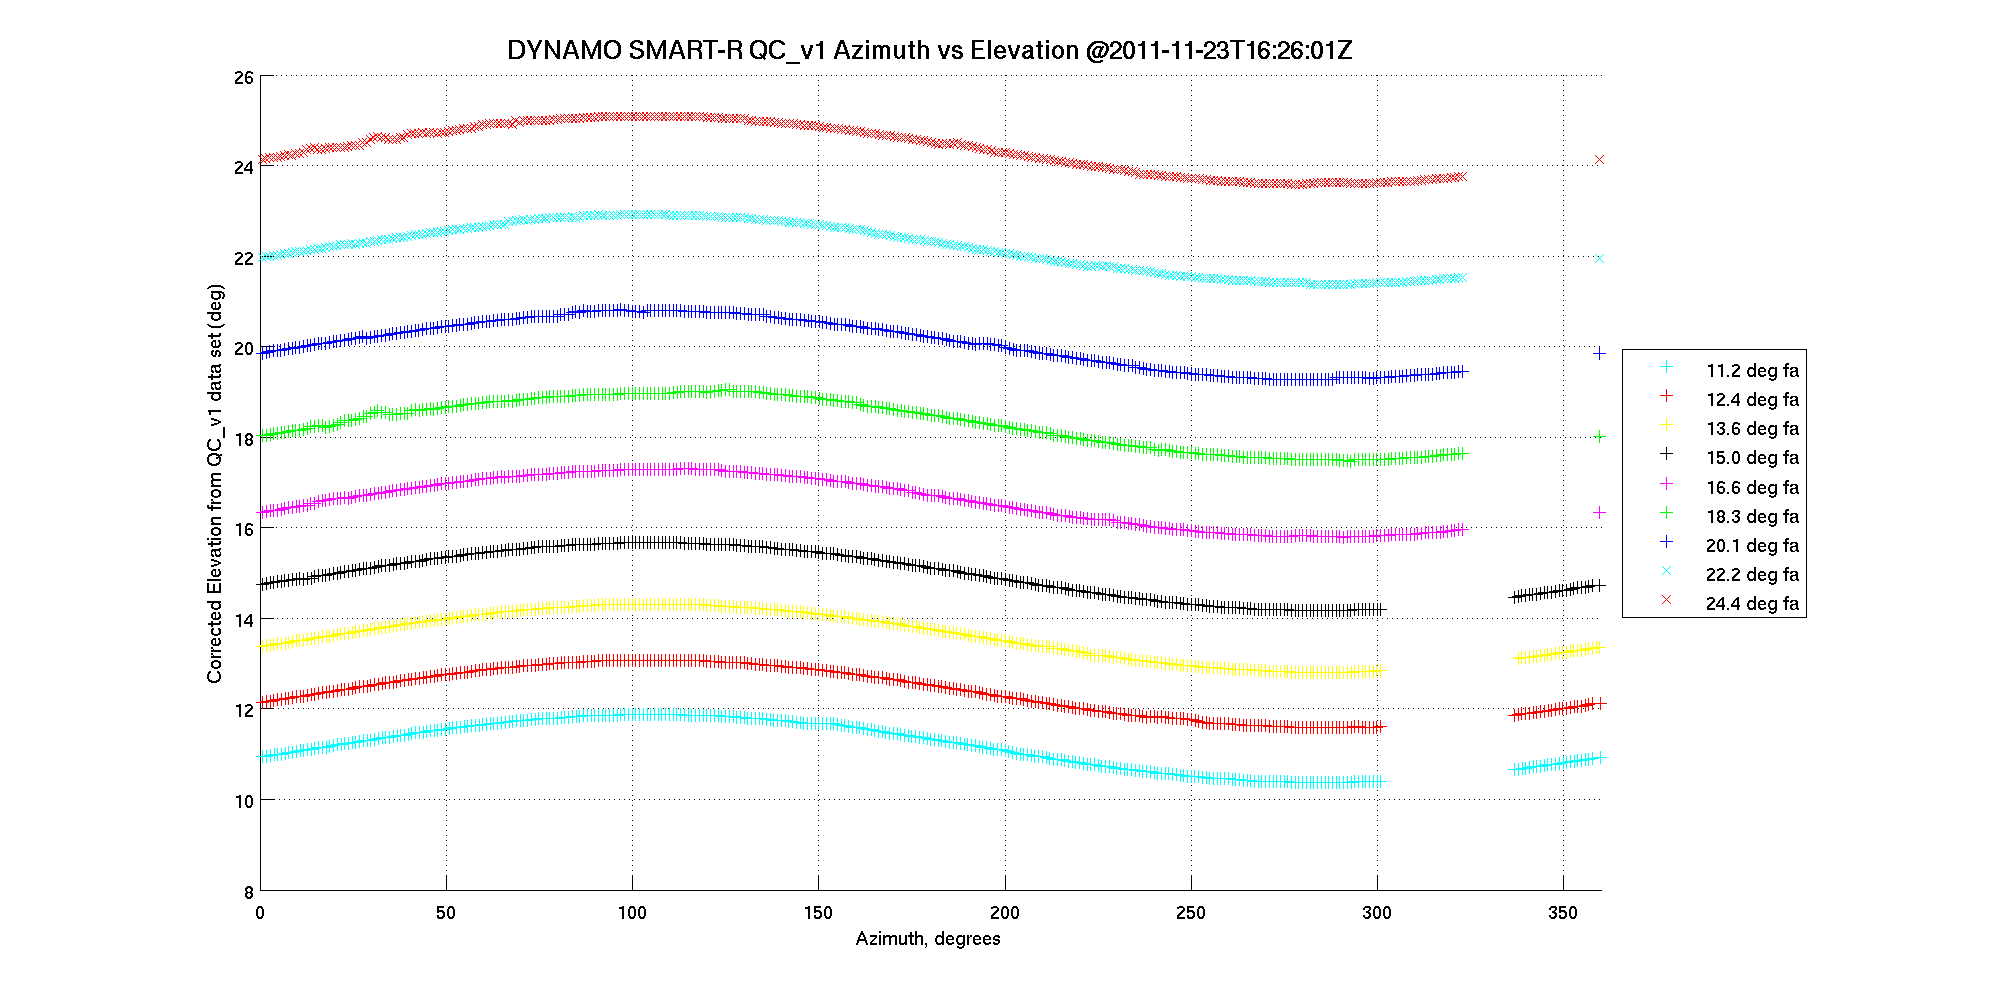
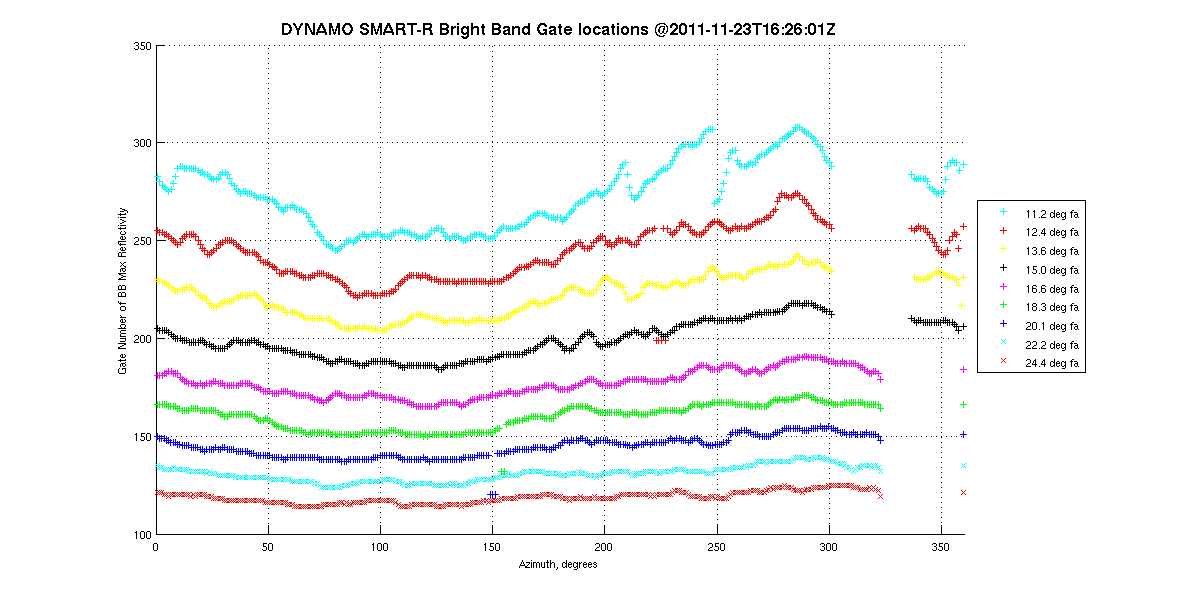
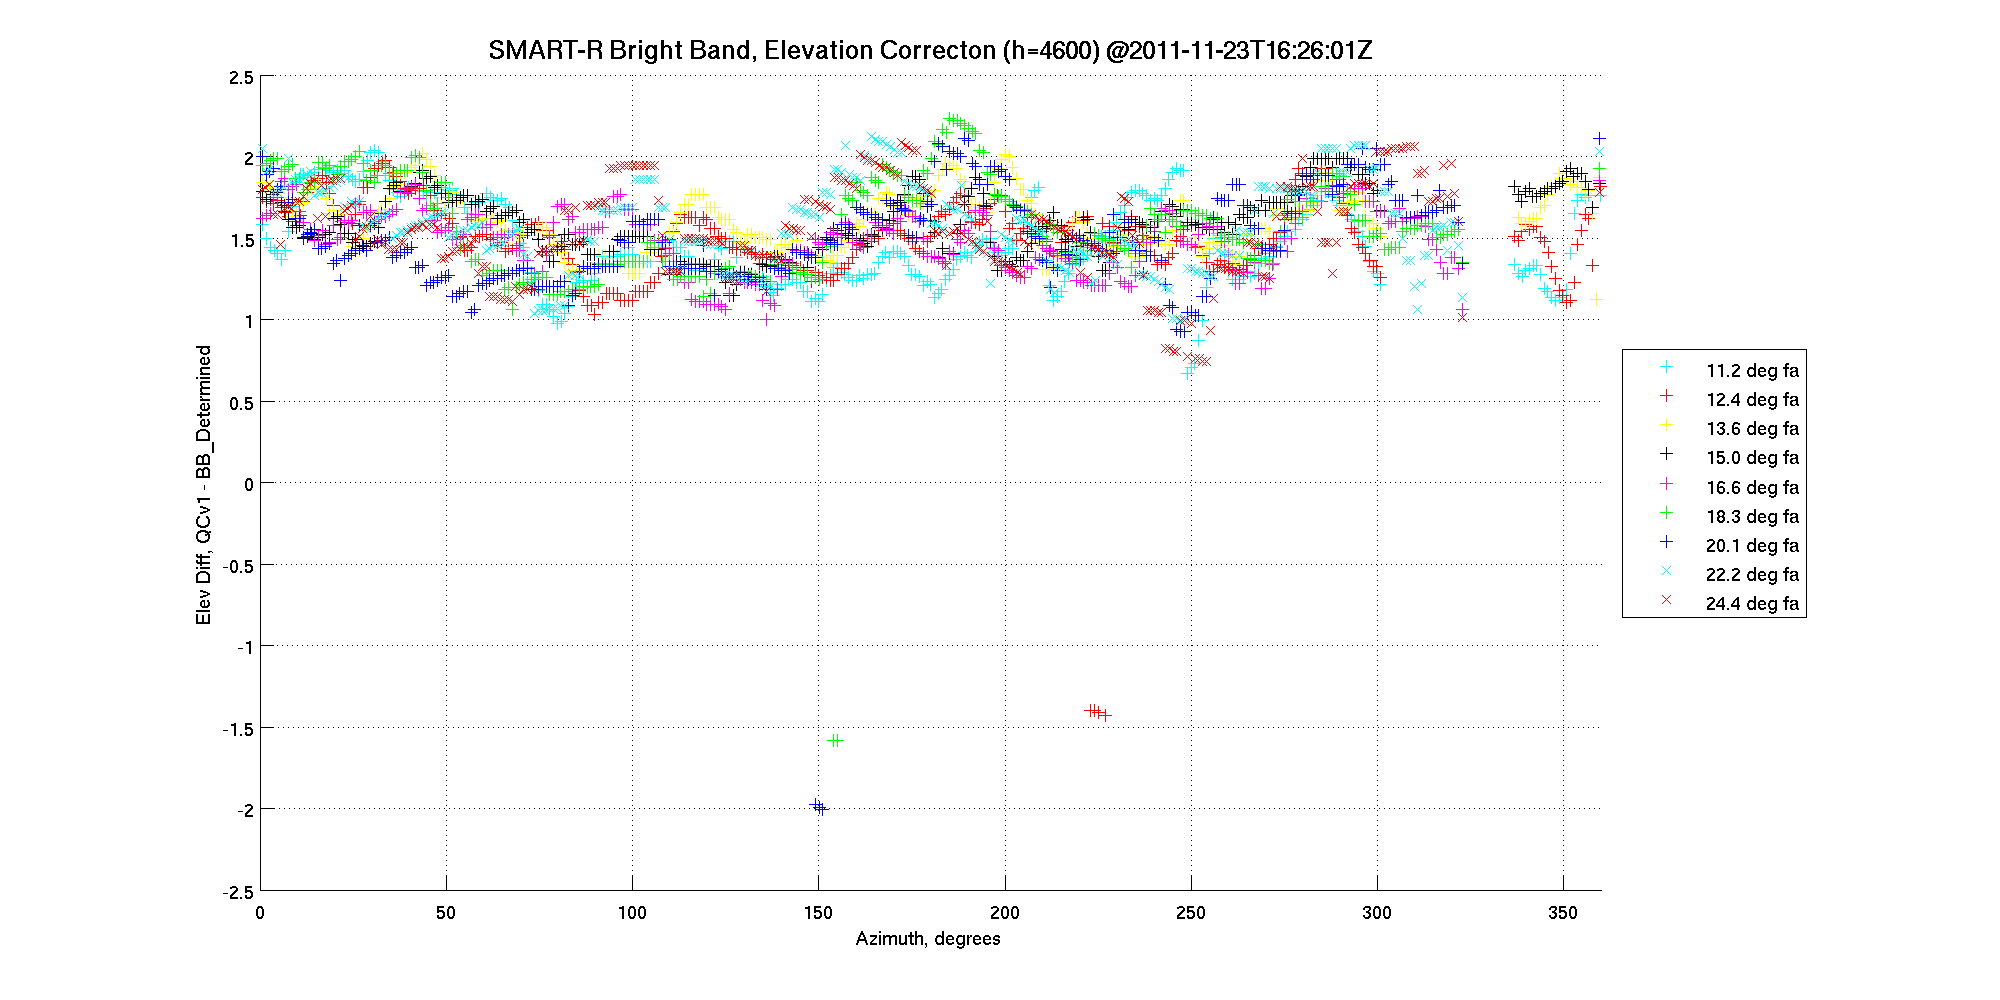
The various plots are presented (only for 23-Nov; other figures available in this directory). The following general conclusions were found:
Future work should include fitting a sine curve to the different tilt data. This would allow better testing of consistency between different tilts, and a better check on the amplitude of the off-level correction and direction of that correction.
Note: Right-click on the following figures, and select "view image"