Hajime Nakamura
03 February 2003
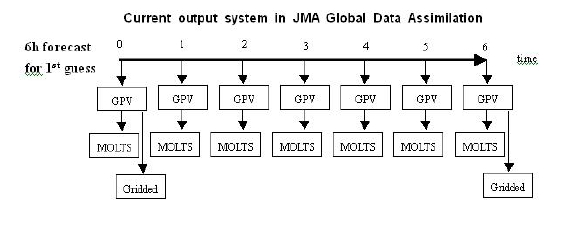
1-1 Output from Data Assimilation
The JMA global data assimilation system adopts 3-dimensional variational method (3Dvar) with 6 hour DA cycle. JMA had been output every 6 hour gridded data from the 6-hour forecast (first guess field) in the data assimilation cycle for monitoring purpose. In response to the CEOP model output request, JMA started on Oct 1st, 2002 to shorten the output interval of this gridded data to one hour. The MOLTS data for any reference sites are picked up from this one-hour intermediate gridded data and sent to the CEOP data archive centers. JMA provides the gridded data every 6 hours to the centers, although JMA archives the hourly intermediate gridded data because of large amount of data transfer. The estimated size of the total gridded data is about 700KB per day.
1-2 Output data
The JMA global data assimilation system out three types of GPV data every one hour, from which the MOLTS data are produced for CEOP reference sites.
M1 from GPV of 288*145, 1.25 x 1.25 degree, 23 pressure levels
M2 from GPV of 640*320, model Gaussian grid with about 0.5625x0.5625 degree, 40 eta levels
M3 from GPV of 320*160, Thinned model Gaussian grid with about 1.125x1.125 degree, 40 eta levels
2 Format of JMA MOLTS data (in preparation)
2.1 Sample files of MOLTS data
(1) MOLTS_JMA_p_0301250600.txt: sample of MOLTS file "M1"
(2) MOLTS_JMA_m_0301250600.txt: sample of MOLTS file "M2"
(3) MOLTS_JMA_t_0301250600.txt: sample of MOLTS flle "M3"
2.2 Naming of files of MOLTS data
MOLTS_JMA_(grid type: p, m, t)_(initial time yymmddhhmm).txt
2.3 Format of MOLTS data
Each file has the following information:
(1)Header1: Initial time
Initial time of data assimilation cycle
Forecast Time From KTI To KTE (UNIT: hour, currently KTI=0, KTE=6)
(2)Header2: Monitoring site
MONITORING CEOP SITE NAME
LATITUDE and LONGITUDE
NEAREST neighbor grid point: grid indices I (longitude), J (co-latitude), latitude, longitude
Model height (m)
(3)main body:
(M1)
element1, level1, unit, forecast time1, time2, time3, time4, time5, time 6
element1, level2, unit, forecast time1, time2, time3, time4, time5, time 6
......
element1, level23, unit, forecast time1, time2, time3, time4, time5, time 6
element2, level1, unit, forecast time1, time2, time3, time4, time5, time 6
element2, level2, unit, forecast time1, time2, time3, time4, time5, time 6
......
element2, level23, unit, forecast time1, time2, time3, time4, time5, time 6
...(repeated)...
(M2) same as (M1) but for
pressure is output variables
40 levels
(M3) same as (M1) but for
level='SURF' for surface variables.
(note)
(a) (2) and (3) are repeated for 41 CEOP monitoring sites.
(b) Each file includes forecasts data from one initial time.
(c) Each data are shown by floating point format (except for land/sea/ice mask in M2)