

Regional Hydroclimate Project:
-
BALTEX (Baltic Sea Experiment)
-
Cabauw
-
Cabauw
-
None
-
Name: Dr. Fred C. Bosveld
Affiliation:
-
Royal Netherlands Meteorlogical Institute
-
Wilhelminalaan 10
postbus 201
3730AE, De Bilt
The Netherlands
Telephone: +31 (0)30 2206911 (787)
Fax: +31 (0)30 2210407
-
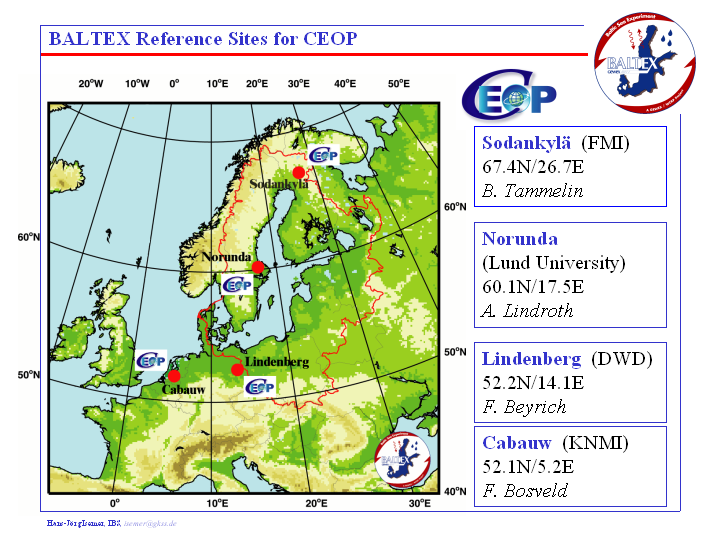
The coordinates of the BALTEX anchor station Cabauw, lat. 51.97N lon. 4.93E, height (m.s.l.) -0.7 m.
The radiosondes are released at the site of the De Bilt The Netherlands(WMOcode:06260 De Bilt lat(N): 52.10 lon(E): 5.18 alt(msl): 4m) . De Bilt is located 25 km North East of the BALTEX anchor station Cabauw.
BALTEX Regional Map (click for full resolution):
Google Earth .kmz file of BALTEX Cabauw Reference Site station and radiosonde locations
Station Description:
-
General Description:
The Cabauw mast is located in the western part of the Netherlands (51.971 oN, 4.927 oE). This site was chosen, because it is rather representative for this part of the Netherlands and because only minor landscape developments were planned in this region. Indeed the present surroundings of Cabauw do not differ significantly from those in 1973. The North Sea is more than 50 km away to the WNW, and there are no urban agglomerations within 15 km radius. The nearby region is agricultural, and surface elevation changes are at most a few metres over 20 km. Within 40 km radius there are four major synoptic weather stations, among which is the regular radiosonde station at De Bilt, ensuring a permanent supporting mesoscale network. Near the mast, the terrain is open pasture for at least 400 m in all directions, and in the WSW direction for 2 km. Farther away, the landscape is generally very open in the West sector, while the distant East sector is rather rough (windbreaks, orchards, low houses). The distant North and South sectors are mixed landscapes, much pasture and some windbreaks. So the highest mast levels have in all directions a long fetch of landscape roughness which is usefully similar to the roughness observed in the lower surface layer (Wieringa, 1989). An effective all azimuth mesoscale roughness length of 0.15 m matches well with observed ABL behaviour. Sectorwise roughness lengths are given by Van Ulden et al. (1976) and by Beljaars and Holtslag (1991). Panoramic photos from the top of the mast are shown by Driedonks (1981). On the mast itself no undisturbed measurements can be made below 20 m. Auxiliary 20 m masts are installed to the SE and the NW at sufficient distance from the mast foot building. South and North of the mast are well-kept observation field for micrometeorological observations. The soil consists of 0.6m of river-clay, overlying a thick layer of peat; its structure has been investigated in some detail (Jager et al., 1976). The water table is about 1 m below the surface, but can be higher during wet periods.
Since then the only significant change in the surroundings is the expansion of the village of Lopik east of the site from the year 2000 on
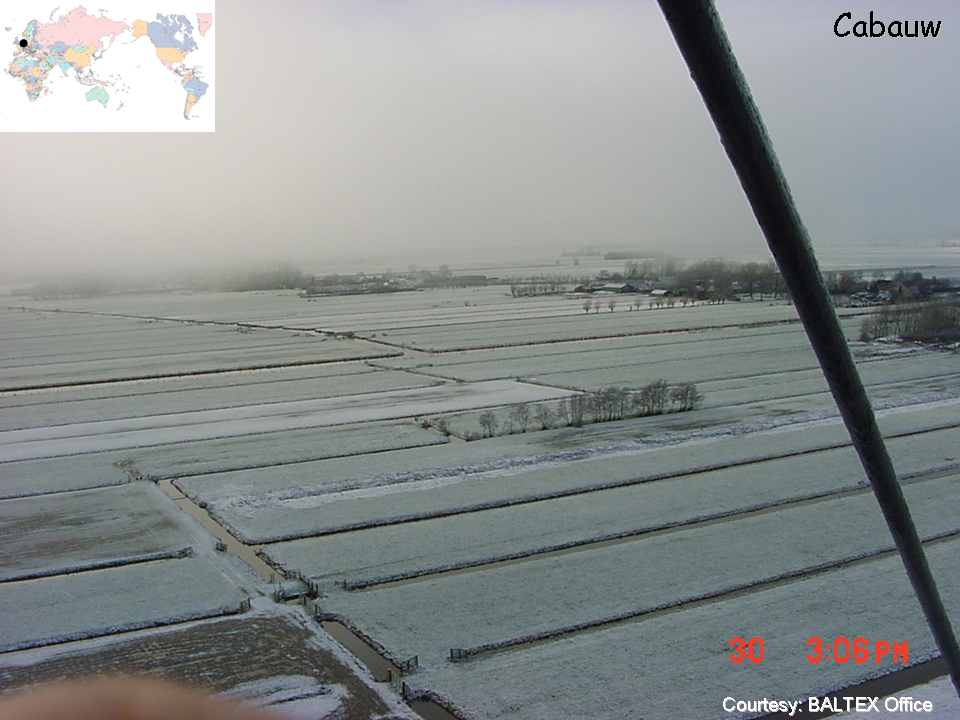
View from tower (click for full resolution):
Station Operator: The Royal Netherlands Meteorological Institute.
Vegetation and Land Use:
Dominant land cover at the measurement location: Grassland.
Canopy height: 0.1m
Land cover within 50 m of site: Grassland
Land cover within 500 m of site: Grassland
Land cover within 12 km of site: Grassland
Seasonal land cover changes: Crop field (Maize) West of the site.
Major changes in land cover at site since 2002: Since 2002 Maize is grown West of the sitewhich considerably affects the flux observation during westerly winds untill September 2006. After this date the flux tower was moved to avoid this interference.
Slope at the site: No slope.
Other notes: None.
Soil Type and Characterization:
Surface soil type: 35-50% clay.
Soil type in deeper layers: Clay and below 0.75 m Peat.
Surface soil porosity: 49%.
Soil porosity in deeper layers: 49%
Soil infiltration rate: No information.
Bulk Dry Density: No information.
Saturated Hydraulic Conductivity: No information.
The Soil Reference Group(s) (from World Reference Base for Soil Resources): No information.
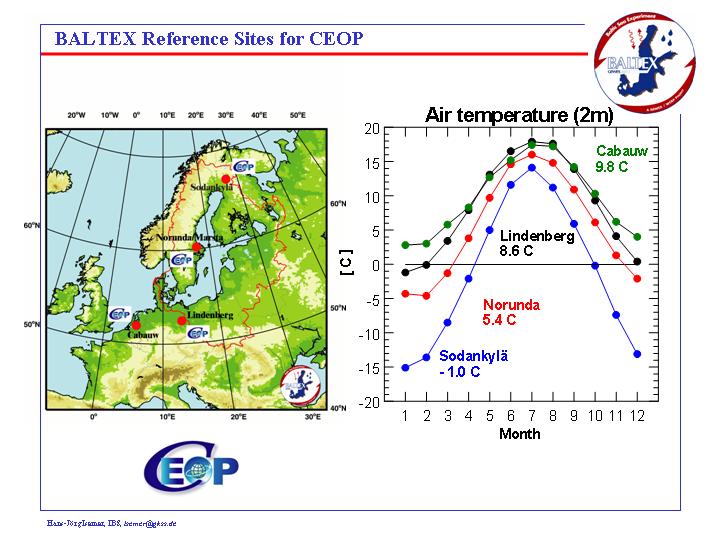
Climate:
Temperature and precipitation annual cycles (click for full resolution):

-
SURFACE METEOROLOGY AND RADIATION INSTRUMENTATION AND DESCRIPTION:
- Station pressure is measured at the automatic weather station site, 200 m South-West of the main tower. The instrument is a Paroscientific 1016B-01. Provisions are made against dynamic pressure effects. Calibration is done at KNMI. Instruments are replaced after 26 month. Accuracy is 0.1 hPa. Resolution is 0.1 hPa. Datalogging is with the KNMI XP1-SIAM Pressure.
- Air Temperature Air temperature are measured at 1.5 m. Air temperature is measured with a KNMI Pt500-element in an unventilated KNMI temperature hut. This hut is open in construction. Heating of the sensor, the metal filter and the open hut improves the functioning during high humidity conditions.
Calibration is done at KNMI. Temperature sensors are replaced each 38 month. Accuracy is 0.1 oC. Resolution is 0.1 oC. Data logging is done with the KNMI XU2-SIAM Temperatuur/Vocht HMP243.
- Dew point - (1.5 m derived)
- Relative humidity is measured at 1.5 m with a Vaisala HMP243 heated relative humidity sensor with a metal filter in a separate Vaisala unventilated hut. This hut is open in construction. Heating of the sensor, the metal filter and the open hut improves the functioning during high humidity conditions. Calibration is done at KNMI. Dew point sensors are subject to contamination and drift of calibration this makes it nescessary to replace them each 8 month. Accuracy is 3.5% RH. Resolution is 0.1oC. Data logging is done with the KNMI XU2-SIAM Temperatuur/Vocht HMP243.
- Specific humidity (1.5 m derived)
- Wind speed is measured at 10 m. To avoid too large flow obstruction from the mast and the main building measurements are taken at two separate masts South (B-mast) and North (C-mast) of the main building. For each 10 minute interval instruments are selected that are best exposed to the undisturbed wind. Still some flow obstruction remains due to the presence of the tower and the supporting booms. Corrections are applied according to Wessels (1983). Corrections in the wind speed are maximal 3% and corrections in wind direction are maximal 3 degrees.
Wind speed is measured with the KNMI cup-anemometer. Cup diameter is 105 mm and the distance between the centre of the cups to the rotation axis is 100 mm. Wind direction is measured with the KNMI wind vane. Distance between axis and the outer side of the vane is 535 mm. The azimuth of the wind vane plugs at the tip of the booms are determined with a camera relative to distant objects at close to the horizon. The instruments are logged with the KNMI wind SIAM. Wind gusts are determined from a running 3 sec mean value. Calibration of the cup anemometers is done in the wind tunnel of KNMI. Wind vanes are balanced and the direction of the vane is tested. Sensors are replaced after 26 month. The cup anemometer contains a photo-chopper with 32 slits. The accuracy is 0.5 m/s. The treshold velocity is 0.5 m/s. The resolution is 0.1 m/s. The response length is 2.5 m. The wind vane contains a code disk. Accuracy is 3o. Resolution is 1o.
- Wind direction is measured at 10 m. To avoid too large flow obstruction from the mast and the main building measurements are taken at two separate masts South (B-mast) and North (C-mast) of the main building. For each 10 minute interval instruments are selected that are best exposed to the undisturbed wind. Still some flow obstruction remains due to the presence of the tower and the supporting booms. Corrections are applied according to Wessels (1983). Corrections in the wind speed are maximal 3% and corrections in wind direction are maximal 3 degrees.
Wind speed is measured with the KNMI cup-anemometer. Cup diameter is 105 mm and the distance between the centre of the cups to the rotation axis is 100 mm. Wind direction is measured with the KNMI wind vane. Distance between axis and the outer side of the vane is 535 mm. The azimuth of the wind vane plugs at the tip of the booms are determined with a camera relative to distant objects at close to the horizon. The instruments are logged with the KNMI wind SIAM. Wind gusts are determined from a running 3 sec mean value. Calibration of the cup anemometers is done in the wind tunnel of KNMI. Wind vanes are balanced and the direction of the vane is tested. Sensors are replaced after 26 month. The cup anemometer contains a photo-chopper with 32 slits. The accuracy is 0.5 m/s. The treshold velocity is 0.5 m/s. The resolution is 0.1 m/s. The response length is 2.5 m. The wind vane contains a code disk. Accuracy is 3o. Resolution is 1o.
- U wind component (derived) (10 m)
- V wind component (derived) (10 m)
- Precipitation - Rain amount and duration is measured at the radation field South of the main tower. To surpress flow obstruction the rain gauge is positioned in a circular pit of 3 m diameter, wich is surrounded by a circular slope. Rain duration is derived from the rain gauge observations. Rain is measured with the KNMI rain gauge. Calibration is done at KNMI. Instruments are replaced after 14 month. Accuracy is 0.2 mm. Resolution is 0.1 mm. Datalogging is with the KNMI XR2-SIAM Neerslag.
- Snow depth - Not Measured
- Incoming shortwave radiation - Short wave upward and downward radiation are measured at the radiation field South of the tower at 1.5 m height. The downward looking sensor (albedo) is on a boom of 1 m length. The porting structure is painted black to get a wel defined radiation condition. Since December 2002 the instruments are ventilated and heated to avoid formation of dew, snow and rime. The instruments are Kipp&Zn CM11 pyranometers. Data logging is done with the KNMI XQ1/XD0/XF0-SIAM Radiation. Calibration is done at KNMI against a reference instrument which itself is calibrated at Davos (Switserland).
- Outgoing shortwave radiation - Short wave upward and downward radiation are measured at the radiation field South of the tower at 1.5 m height. The downward looking sensor (albedo) is on a boom of 1 m length. The porting structure is painted black to get a wel defined radiation condition. Since December 2002 the instruments are ventilated and heated to avoid formation of dew, snow and rime. The instruments are Kipp&Zn CM11 pyranometers. Data logging is done with the KNMI XQ1/XD0/XF0-SIAM Radiation. Calibration is done at KNMI against a reference instrument which itself is calibrated at Davos (Switserland).
- Incoming longwave radiation - Long wave upward and downward radiation are measured at the radiation field South of the tower at 1.5 m height. The sensors are on a boom of xx m length. The instruments are mounted in one housing to get equal house temperatures. They are ventilated to avoid formation of dew, snow and rime and to minimise heating of the domes through irradiation. The domes are equipped with small thermistors. Corrections are applied for heating of the domes. The instruments are Eppley pyrgeometers (PIR). Data logging is done with the KNMI XL0-SIAM Eppley Radiation. Calibration is done in Davos (Switserland).
- Outgoing longwave radiation - Long wave upward and downward radiation are measured at the radiation field South of the tower at 1.5 m height. The sensors are on a boom of xx m length. The instruments are mounted in one housing to get equal house temperatures. They are ventilated to avoid formation of dew, snow and rime and to minimise heating of the domes through irradiation. The domes are equipped with small thermistors. Corrections are applied for heating of the domes. The instruments are Eppley pyrgeometers (PIR). Data logging is done with the KNMI XL0-SIAM Eppley Radiation. Calibration is done in Davos (Switserland).
- Net radiation (1.5 m; derived)
- Skin temperature - Data is collected, but no information available.
- Incoming Photosynthetically Active Radiation (PAR) - Not measured.
- Outgoing Photosynthetically Active Radiation (PAR) - Not measured.
- Station pressure - Surface pressure is measured at the automatic weather station site, 200 m South-West of the main tower. The instrument is a Paroscientific 1016B-01. Provisions are made against dynamic pressure effects. Calibration is done at KNMI. Instruments are replaced after 26 month. Accuracy is 0.1 hPa. Resolution is 0.1 hPa. Datalogging is with the KNMI XP1-SIAM Pressure.
- Air Temperature - Air- and dewpoint temperature are measured at seven levels, 200, 140, 80, 40, 20, 10 and 1.5 m. The highest 4 levels are measured at the South-East booms of the main tower . The lowest three levels are measured at the B-mast, South of the main building. Air temperature is measured with a KNMI Pt500-element in an unventilated KNMI temperature hut. Dew point temperature is measured with a Vaisala HMP243 heated relative humidity sensor with a metal filter in a separate Vaisala unventilated hut. This hut is open in construction. The humidity data often overestimates during drying episodes after dew, fog or rain, because of a wet shielding or sensor. This may result in observed dewpoint temperatures higher than the air temperature. Heating of the sensor, the change to metal filter and the open hut improves the functioning during high humidity conditions.
Calibration is done at KNMI. Temperature sensors are replaced each 38 month. Accuracy is 0.1 oC. Resolution is 0.1 oC. Dew point sensors are subject to contamination and drift of calibration this makes it nescessary to replace them each 8 month. Accuracy is 3.5% RH. Resolution is 0.1oC. Data logging is done with the KNMI XU2-SIAM Temperatuur/Vocht HMP243.
- Dew point (derived)
- Relative humidity - Air- and dewpoint temperature are measured at seven levels, 200, 140, 80, 40, 20, 10 and 1.5 m. The highest 4 levels are measured at the South-East booms of the main tower . The lowest three levels are measured at the B-mast, South of the main building. Air temperature is measured with a KNMI Pt500-element in an unventilated KNMI temperature hut. Dew point temperature is measured with a Vaisala HMP243 heated relative humidity sensor with a metal filter in a separate Vaisala unventilated hut. This hut is open in construction. The humidity data often overestimates during drying episodes after dew, fog or rain, because of a wet shielding or sensor. This may result in observed dewpoint temperatures higher than the air temperature. Heating of the sensor, the change to metal filter and the open hut improves the functioning during high humidity conditions.
Calibration is done at KNMI. Temperature sensors are replaced each 38 month. Accuracy is 0.1 oC. Resolution is 0.1 oC. Dew point sensors are subject to contamination and drift of calibration this makes it nescessary to replace them each 8 month. Accuracy is 3.5% RH. Resolution is 0.1oC. Data logging is done with the KNMI XU2-SIAM Temperatuur/Vocht HMP243.
- Specific humidity (derived)
- Wind speed - Wind speed and wind direction is measured at six levels, 200, 140, 80, 40, 20 and 10 m. To avoid too large flow obstruction from the mast and the main building measurements are taken on booms in three different directions. At the levels 200, 140, 80 and 40 m the wind direction is measured at all three booms and wind speed is measured at two booms (South-West and North). At the levels 20 and 10 m the wind direction and wind speed are measured at two separate masts South (B-mast) and North (C-mast) of the main building. For each 10 minute interval instruments are selected that are best exposed to the undisturbed wind. Still some flow obstruction remains due to the presence of the tower and the supporting booms. Corrections are applied according to Wessels (1983). Corrections in the wind speed are maximal 3% and corrections in wind direction are maximal 3 degrees.
Wind speed is measured with the KNMI cup-anemometer. Cup diameter is 105 mm and the distance between the centre of the cups to the rotation axis is 100 mm. Wind direction is measured with the KNMI wind vane. Distance between axis and the outer side of the vane is 535 mm. The azimuth of the wind vane plugs at the tip of the booms are determined with a camera relative to distant objects at close to the horizon. The instruments are logged with the KNMI wind SIAM. Wind gusts are determined from a running 3 sec mean value. Calibration of the cup anemometers is done in the wind tunnel of KNMI. Wind vanes are balanced and the direction of the vane is tested. Sensors are replaced after 26 month. The cup anemometer contains a photo-chopper with 32 slits. The accuracy is 0.5 m/s. The treshold velocity is 0.5 m/s. The resolution is 0.1 m/s. The response length is 2.5 m. The wind vane contains a code disk. Accuracy is 3o. Resolution is 1o.
- Wind direction - Wind speed and wind direction is measured at six levels, 200, 140, 80, 40, 20 and 10 m. To avoid too large flow obstruction from the mast and the main building measurements are taken on booms in three different directions. At the levels 200, 140, 80 and 40 m the wind direction is measured at all three booms and wind speed is measured at two booms (South-West and North). At the levels 20 and 10 m the wind direction and wind speed are measured at two separate masts South (B-mast) and North (C-mast) of the main building. For each 10 minute interval instruments are selected that are best exposed to the undisturbed wind. Still some flow obstruction remains due to the presence of the tower and the supporting booms. Corrections are applied according to Wessels (1983). Corrections in the wind speed are maximal 3% and corrections in wind direction are maximal 3 degrees.
Wind speed is measured with the KNMI cup-anemometer. Cup diameter is 105 mm and the distance between the centre of the cups to the rotation axis is 100 mm. Wind direction is measured with the KNMI wind vane. Distance between axis and the outer side of the vane is 535 mm. The azimuth of the wind vane plugs at the tip of the booms are determined with a camera relative to distant objects at close to the horizon. The instruments are logged with the KNMI wind SIAM. Wind gusts are determined from a running 3 sec mean value. Calibration of the cup anemometers is done in the wind tunnel of KNMI. Wind vanes are balanced and the direction of the vane is tested. Sensors are replaced after 26 month. The cup anemometer contains a photo-chopper with 32 slits. The accuracy is 0.5 m/s. The treshold velocity is 0.5 m/s. The resolution is 0.1 m/s. The response length is 2.5 m. The wind vane contains a code disk. Accuracy is 3o. Resolution is 1o.
- U wind component (derived)
- V wind component (derived)
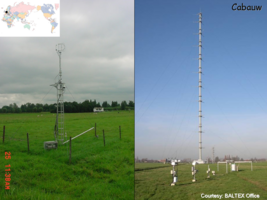
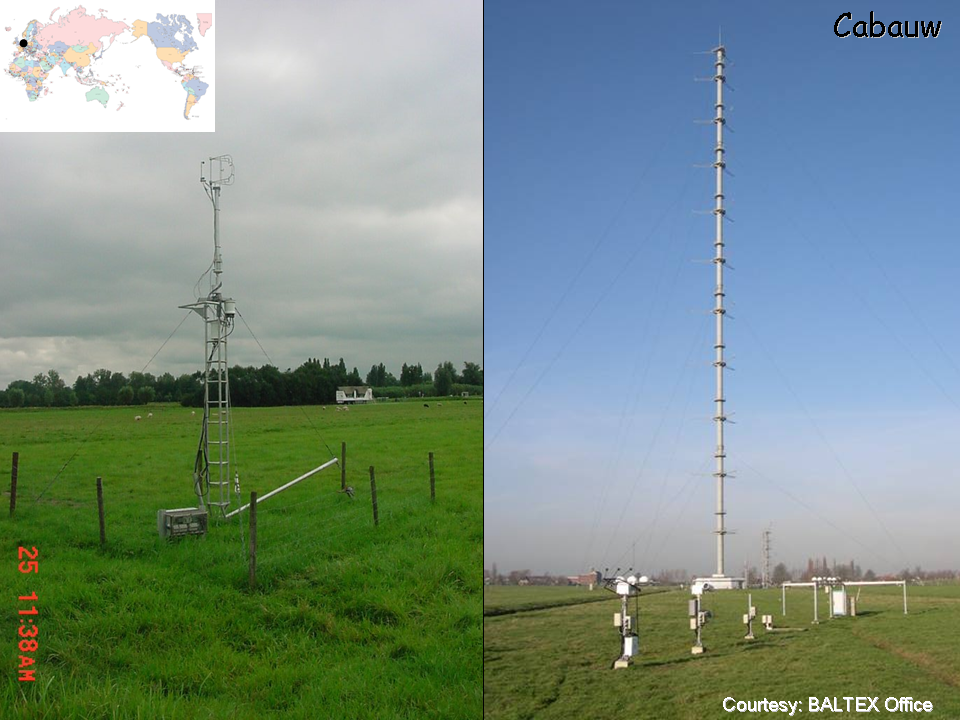
The Cabauw Tower (on right; click for full resolution):
- Sensible Heat Flux (5.37 m)
- Latent Heat Flux (5.37 m)
- CO2 Flux (5.37 m)
- Soil Heat Flux (0, -5, -10 cm) - Soil heat flux is measured at the soil-terrain, 100 m South of the main tower, with six soil heat flux plates. The six plates are burried at the three vertices of an equilateral triangle with sides of 2 m at depths of 0.05 and 0.10 m.
The instruments are manufactured by TNO-Delft. Type: WS31S, principle: thermo-pile, diameter 0.11 m, thickness 5 mm, sensitive surface: central square of 25*25 mm2. Calibration is done by TNO-Delft.
Flux tower (on left; click for full resolution):
- Soil temperature (-0.04, -0.08, -0.12, -0.20, -0.30, and -0.50 m) - Soil temperatures are measured at the soil-terrain 100 m South of the main tower. The temperature needles are burried horizontally at depths of 0.04, 0.08, 0.12, 0.20, 0.30 and 0.50 m.
Instruments are manufactured at KNMI. They are Nickle wired needles with an electric resistance of 500 Ohm and a sensitive length of 0.35 m. Calibration is done at KNMI. Datalogging is at a Campbell Scientific CR21X datalogger.
- Soil moisture (-0.20 m starting 6 December 2002). Soil water content is measured at the soil-terrain, 100 m South of the main tower, with a TDR-sensor at a depth of 0.20 m.
The instruments are manufactured by Campbell Scientific. TypeCS615, principle: Time domain reflectometry, rod length = 30 cm, width between the two rods: 32 mm. Calibration is done by Campbell Scientific. Data logging is with a Campbell Scientific CR21X datalogger. Measurements are taken 5 times in a 10 minute interval. Averages over 10 minutes are saved.
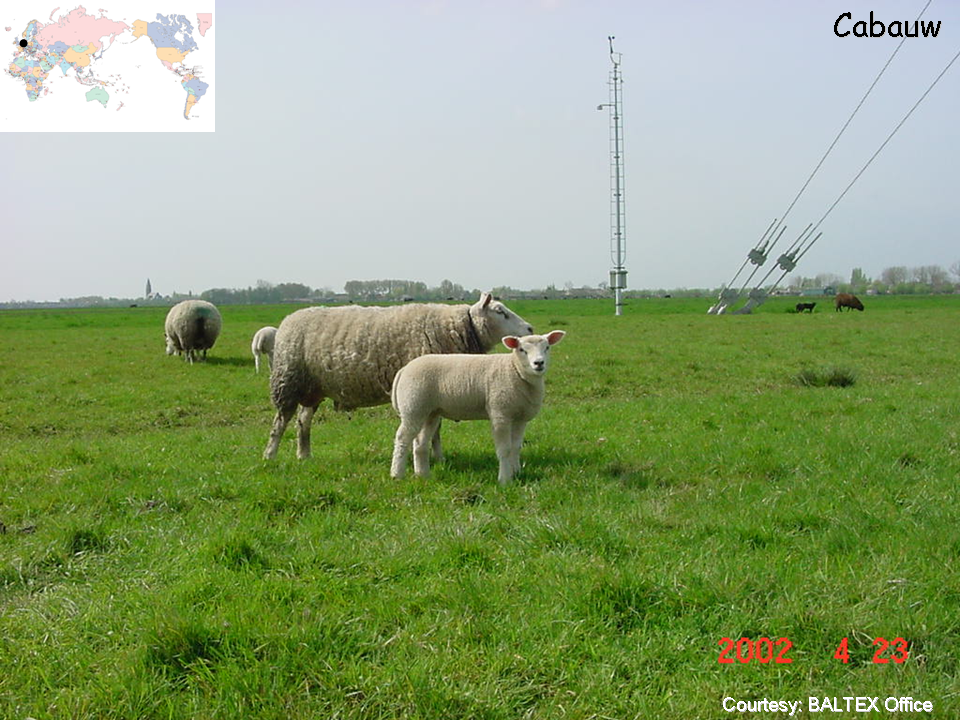
The tower for standard meteorological measurements (click for full resolution):
METEOROLOGICAL TOWER INSTRUMENTATION AND DESCRIPTION: The 10, 20, 40, 80, 140, and 200 m heights include observations of air temperature, dew point, relative humidity, specific humidity, wind speed, wind direction, U wind component, and V wind component. The 2 m height includes observations of air temperature, dew point, relative humidity, and specific humidity.
FLUX INSTRUMENTATION AND DESCRIPTION: Turbulent surface fluxes are measured at 5 m height approximately 200 m South of the 200 m main tower. A sonic anemometer/thermometer is used to measure turbulent fluctuations of the three wind components and (sonical) temperature. The sonical temperature is measured along the vertical transducer pair. An open path infrared fluctuation meter is used to measure turbulent fluctuations of humidity and carbondioxide. The sonic anemometer has an azimuthal opening angle of 120o for horizontal wind measurements. The open path sensor is positioned vertically just behind the sonic probe at a distance of 0.3 m from the vertical sonical path. The instruments are mounted on a 1 m thin vertical cylinder to avoid a too strong flow obstruction due to the supporting mast. The vertical cylinder is supported by a rotator which is controlled by a wind direction tracking system and automatically turned into the mean wind direction each 2 hours. An inclinometer is positioned between the rotator and the supporting cylinder. The instrument are positioned vertically within 1 degree.
The sonic anemometer is a Kaijo-Denki, probe type TR60-A, electronic unit DAT-300 or DAT-600. The sonic path is 0.2 m. Resolution is 0.1 K. The H2O/CO2-sensor is a KNMI Infrared Fluctuation meter. Pathlength is 0.3 m. Resolution is 0.003 g/m3 H2O and 0.15 ppm CO2.
Calibration of the sonic anemometer is done, approximately each second year, in a wind tunnel of TNO-Apeldoorn. The temperature, humidity and co2 calibration is done at KNMI also approximately each second year.
SOIL INSTRUMENTATION AND DESCRIPTION: Soil measurements are performed west of the radiation measurements.
RADIOSONDE INSTRUMENTATION AND DESCRIPTION: The radiosonde is of type Vaisala RS90-Loran C. The files contain operational ascents at 10 sec. resolution. Quantities archived are: pressure (hPa), geopotential height (m), temperature (C), dew point temperature (C), relative humidity (%), wind speed (m/s) and wind direction (degrees).
Radiosondes are launched in principle two times a day (12 and 24 h UTC).
-
Web:
-
http://www.knmi.nl/~bosveld -> Observations -> Documentation (Documention of Cabauw in-situ observations)
http://www.cesar-database.nl (webbased data portal for Cabauw Experimental Site for Atmospheric Research)
Literature:
-
Beljaars A. C. M. and A. A. M. Holtslag (1991). Flux parameterization over land surfaces for atmospheric models. J. Appl. Meteorol., 30, 3, 327-341.
Driedonks A.G.M. (1981). Dynamics of the Well-mixed Atmospheric Boundary Layer. KNMI-WR81-02.
Jager C. J., T. C. Nakken and C. L. Palland (1976). Bodemkundig onderzoek van twee graslandpercelen nabij Cabauw. N.V.Heidemaatschappij beheer, Arnhem, maart 1976. (In Dutch)
Ulden A. P. van and J. Wieringa (1996). Atmospheric boundary layer research at Cabauw. Boundary Layer Meteorology, 78, 39-69.
Wieringa J. (1989). Shapes of annual frequency distributions of wind speed observed on high meteorological masts. Boundary Layer Meteorol., 47, 85-110.
Ulden A.P. van, J.G. van der Vliet and J. Wieringa (1976). Temperature and Wind observations at heights from 2 to 200 m at Cabauw in 1973. KNMI-WR76-07.
- BALTEX: The Baltic Sea Experimen t (13 March 2007; Washington, DC, USA)
- A Status Report from the European (BALTEX) Reference Sites in CEOP (2 7 February 2006; Paris, France)
- BALTEX Reference Sites for the CEOP (10 March 2004; Irvine, California, USA)
- BALTEX Cabauw (31 March 2003; Berlin, Germany)
- BALTEX Reference Sites for the GEWEX CEOP (6 March 2002; Tokyo, Japan)
- EOP-3/4 and beyond Data Sets and Documentation
- Surface Meteorological Data: Current Status and Browse Plots
- Soil Temperature and Moisture Data: Current Status and Browse Plots
- Flux Data: Current Status and Browse Plots
- Meteorological Tower Data: Current Status and Browse Plots
- EOP-1 Converted Format Data Sets and Documentation
- EOP-1 Native Format Data Sets and Documentation