Last Modified:
| summary of flights |
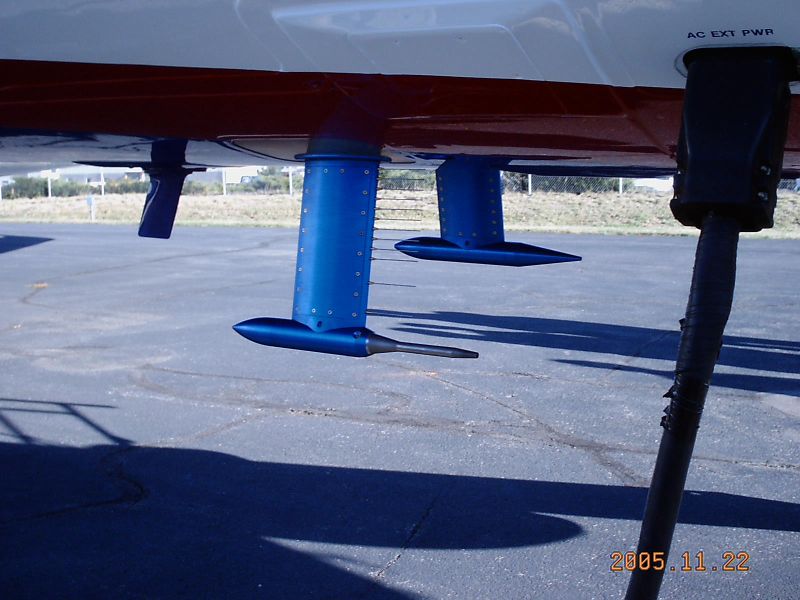
two aperture pads on belly |
six aperture pads on top of fuselage |
static pressure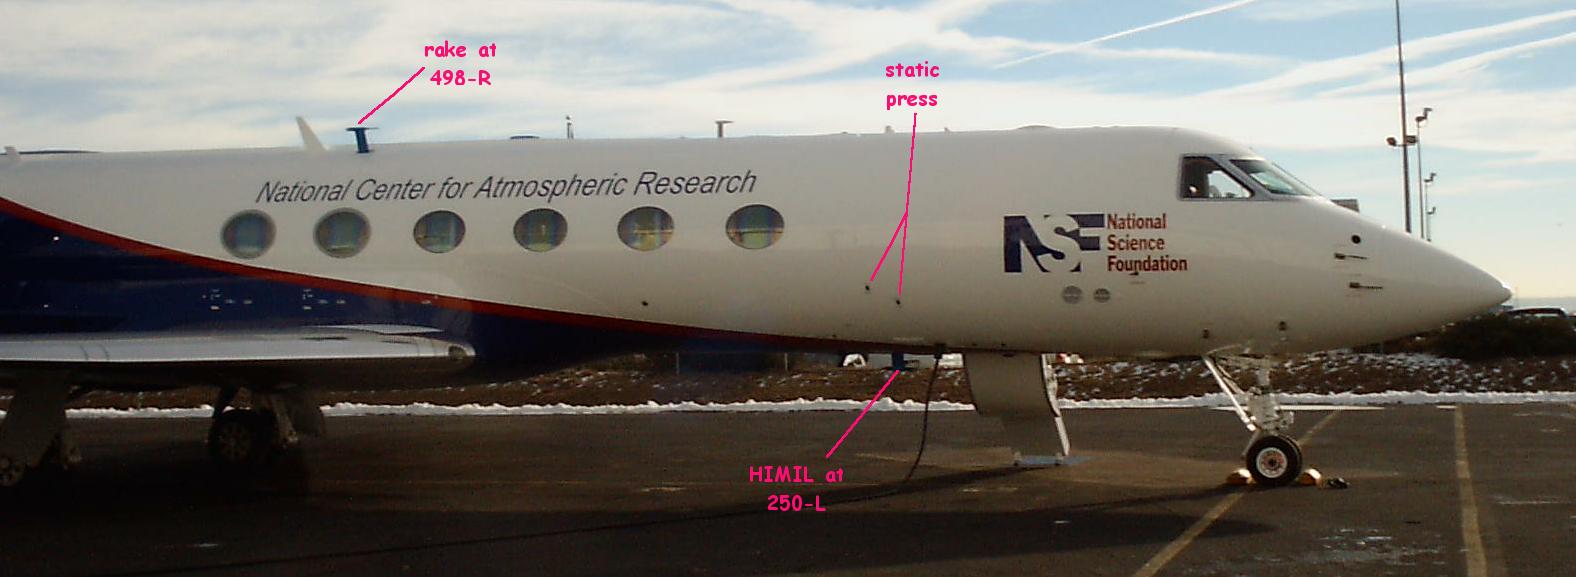 |
radome gust system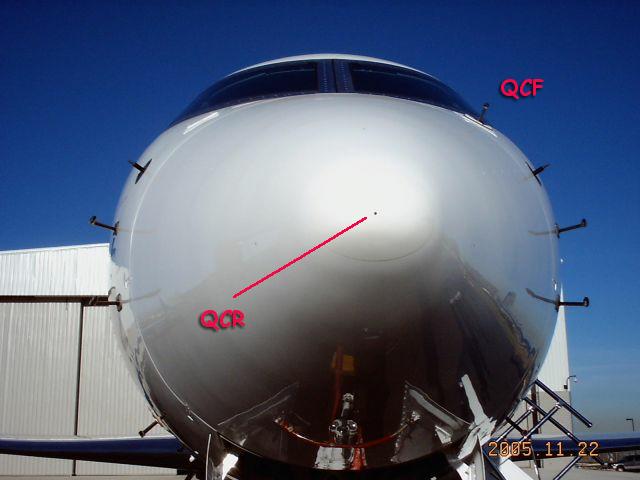 |
fuselage pitot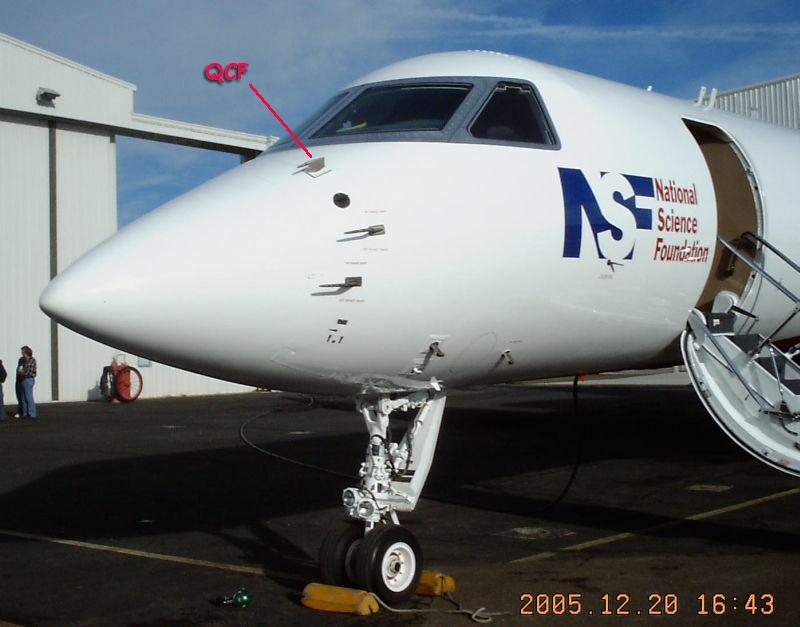 |
Pressure RakeThe rake has twelve small pitot tubes along its strut and a large pitot-static tube at the end. All pitot tubes share the same reference pressure, i.e., the total pressure of the large pitot-static tube. The large pitot-static tube has static pressure ports on its side. The twelve pitot tubes connect by small tubing to a NetScanner (Pressure Systems, Inc.) that is located at the foot of the rake, inside the aircraft. The NetScanner measures the twelve differential pressures at 50 Hz, and sends data to the aircraft data system. Dynamic and static pressures of the large pitot-static tube are measured with other sensors and recorded separately. |
|
click for |
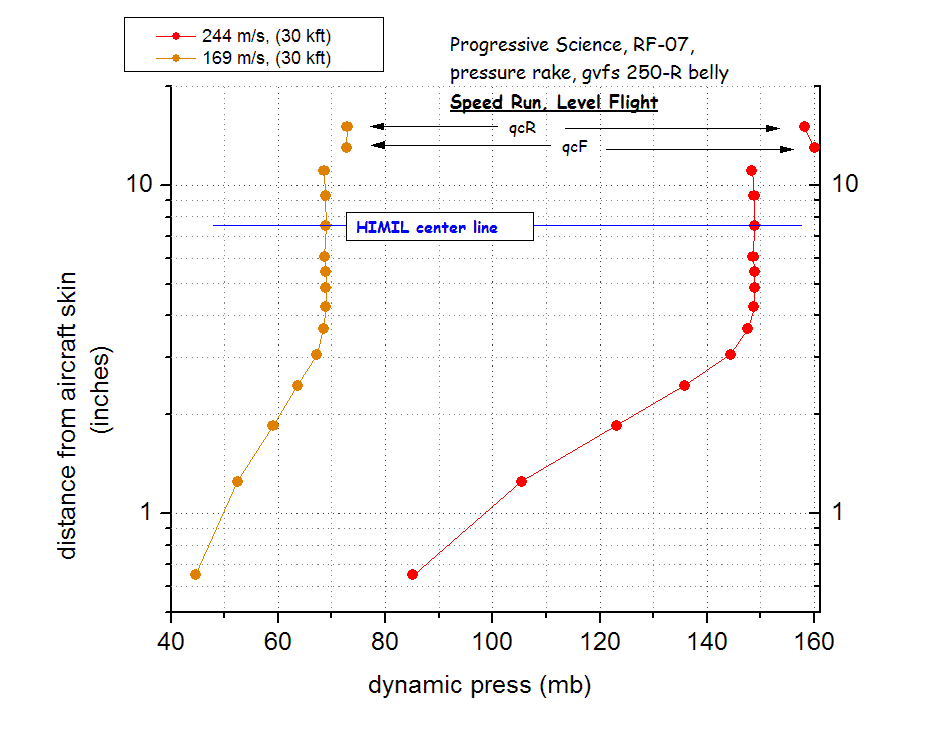
DYNAMIC PRESSURE PROFILES - speed runs
|
DYNAMIC PRESSURE PROFILES at different aperture pad locationsThe pressure rake was moved between flights. This
figure shows pressure rake measurements at different locations during level flight. Note
that the BL depth is greater at locations further from nose, as
expected. At the furthest aft position (498-R), the HIMIL centerline
lies within the BL.
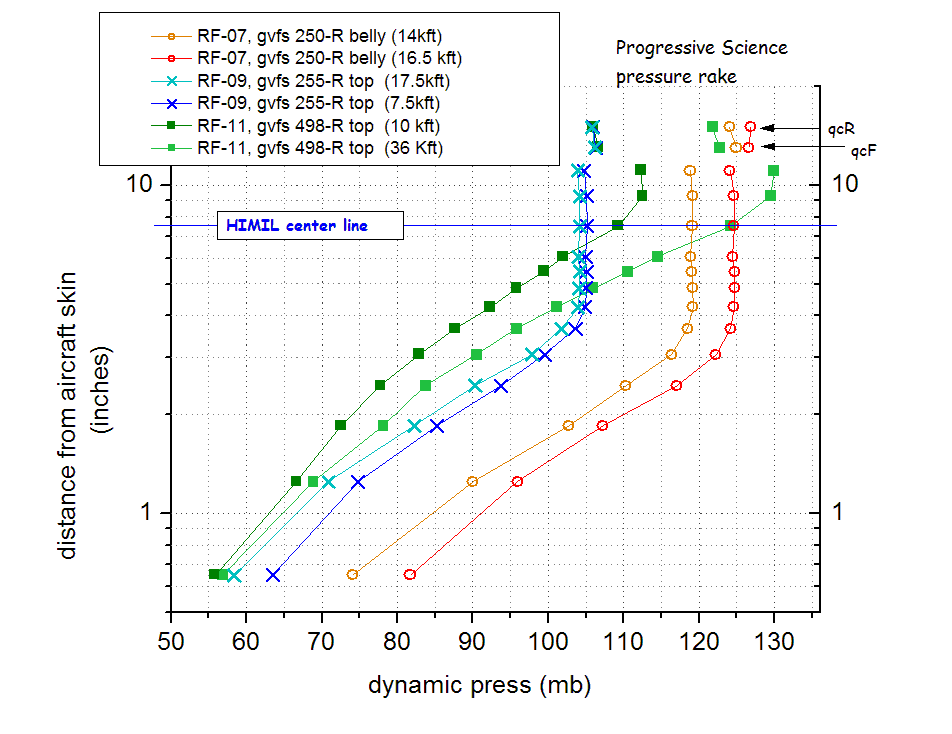 Dynamic pressures QCR (radome) and QCF (fuselage) were also measured. At forward locations (250 belly and 255 top), QCR and QCF are larger than the distal rake pressure. However, when the rake was mounted further aft (498 top), QCR and QCF are smaller. |
BL DEPTH - changes during maneuversPitch maneuvers and side-slip maneuvers were done on several flights. The following figures show data from a ten-minute interval during RF07, when the rake was mounted on the belly at 250-R. Rake pressures follow those at the nose radome sensor (QCR). Small scale variability is evident at all points within the boundary layer (p00 to p05) but not outside it. Side-slip causes large variations in rake pressures.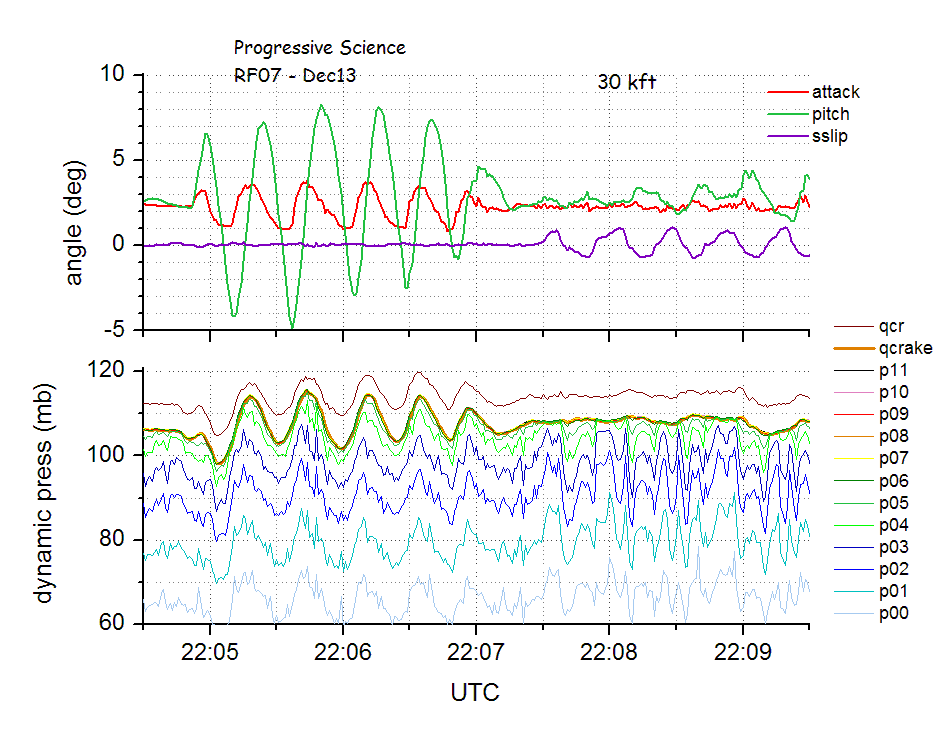 Next figure zooms in on one-minute of
the pitch maneuver. It shows that in the BL, there is slight asymmetry in the rake pressure
traces. This suggests that the BL profile during pitch UP is different
from pitch DOWN. The times of maximum and minimum pitch are marked by vertical lines for reference in the next plot.
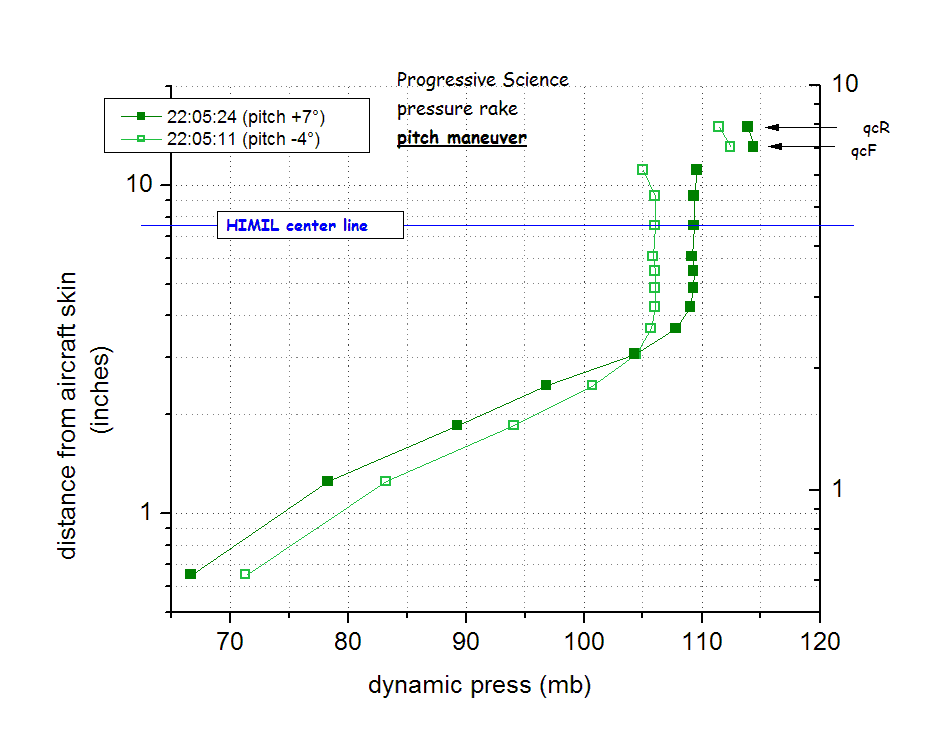
 Profiles of rake pressure were
plotted during the greatest pitch excursions -4° and +7°. They
suggest that the BL was slightly thicker during pitch up.
 |
BL DEPTH - measured vs GAC studyGulfstream
Aerospace Corporation (GAC) estimated BL thickness from flow modeling
studies of the GV and found that the thickness generally followed the 1:100 rule (thickness ~1% of distance from the nose)
for distances as far as ~gvfs 800. Thicker BL excursions occurred where
other structures joined the fuselage, for example near the wing root.
Pressure rake measurements during Progressive Scienceindicated that the BL is thicker than predicted in the GAC simulations. At gvfs 498, BL depth was about 9.0" whereas GAC flow modeling predicts ~5". This discrepancy may arise from the non-perfect surface of the NSF/NCAR GV (due to antennas and other hardware) or because the simulations and measurements are at different speeds and angles of attack. The following plot shows the rake measurements of BL depth at four locations on the GV fuselage, along with the centerline heights of standard (short) and tall HIMILs. 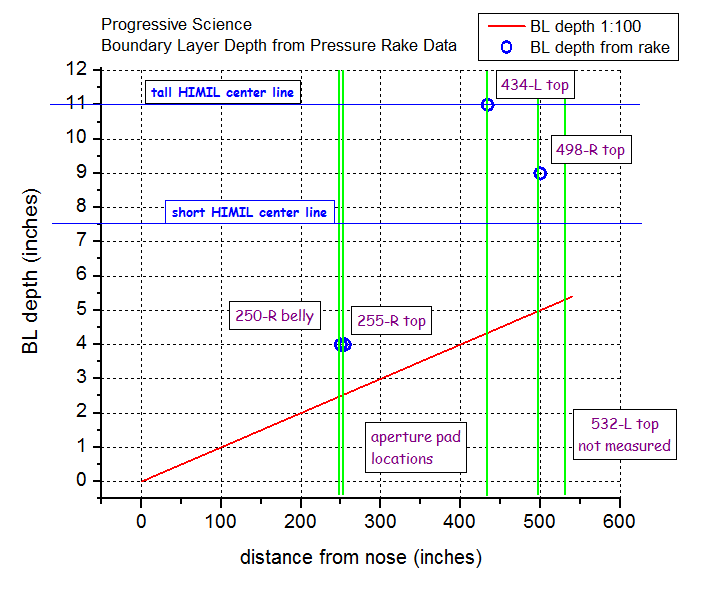 |
BL Profiles - modelingFlow modeling studies at RAF can be compared with pressure rake measurements. |
TURBULENCEFuture analysis can examine high frequency signals (50 Hz) in the pressure rake and other data. |