|
|
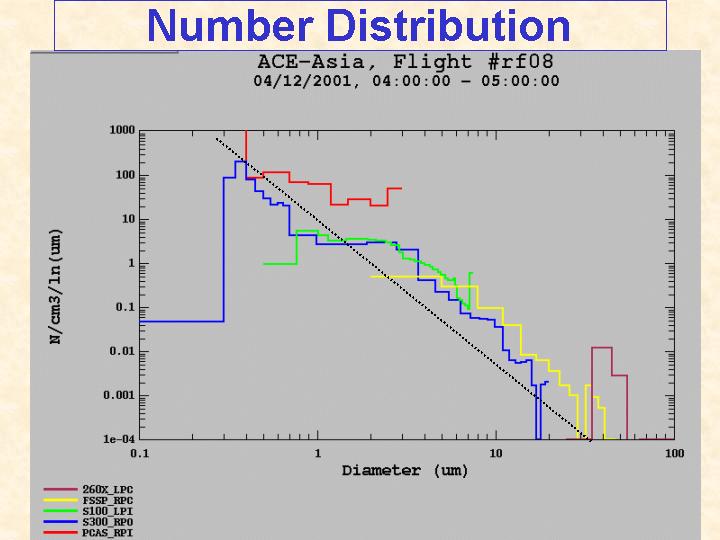
| One-hour average size distribution for the low altitude segment. Data from five probes are shown. Except for the PCASP (red), there is general consistency of measurements in the size ranges where instruments overlap. The PCASP is consistently high. Dotted line shows log/log slope of –3 parallels much of the data. |
| NEXT |