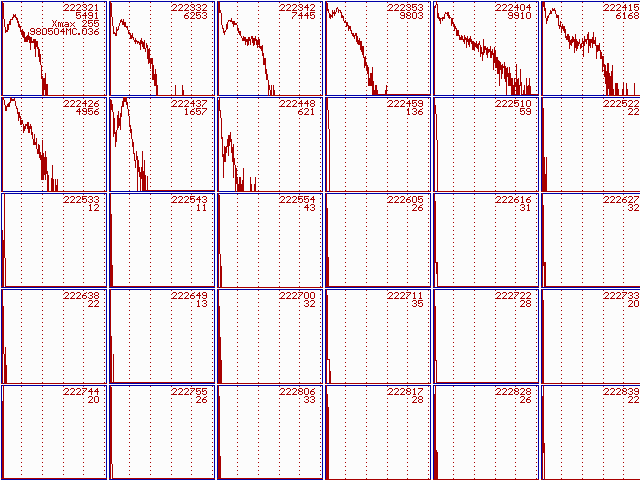
Size Spectra of Particles at CFD Outlet |
Particles in the air coming out of the CFD pass through the optical particle counter and produce electrical pulses. These pulses go to a MultiChannel Analyzer (MCA) which measures the amplitude of each pulse and sorts it into one of 256 channels. Over a period of 10 seconds, the pulses are accumulated into a frequency distribution, or spectrum. The channel number corresponds to particle size ~2 to 16um.
 This plot shows five minutes of MCA spectra. Each small plot is a spectrum
showing 10 seconds of data. In the corner of each small plot is the clock
time (hhmmss) and total number of counts.
This plot shows five minutes of MCA spectra. Each small plot is a spectrum
showing 10 seconds of data. In the corner of each small plot is the clock
time (hhmmss) and total number of counts.
The time period shown is 22:18 to 22:23 UTC (first plot) and 22:23 to 22:28 UTC (second plot). The humidity in the CFD was about +5% SSw (supersaturation with respect to water). The CFD was adjusted to give a brief period of very high supersaturations (up to +21%). The MCA spectra show a strong response of particle formation during this period. Counts greater than 500 correspond to SSw > 12%.