- role of ice nuclei for ice formation in clouds
- "diamond dust" formation in polluted versus unpolluted air
- production, transport, removal and modification of Arctic IN
- physical nature of IN (chemical composition, size distribution, effectiveness)
Primary instrumentation for these studies was on the NCAR C-130. Measurements were made using the following techniques:
- CFD = continuous flow diffusion chamber for real time measurements
- CN = condensation nucleus monitor (total aerosol concentration)
- PIXE = impactor for collecting all aerosol particles on transmission electron microscope (TEM) grids for later examination
- CFD impactor samples = collecting IN on TEM grids
- IN filters = polycarbonate membrane filters for
- collecting all aerosol particles (processed later in laboratory)
Ice nuclei were measured with a continuous flow diffusion (CFD)
chamber, which is illustrated in Figure 1. The CFD chamber consists
of two concentric cylinders. Sample air is sandwiched between
particle-free sheath air and flows downward through the space
between the cylinders. The cylinder walls are coated with ice
and held at different temperatures to create a supersaturation.
Ice nuclei activate, grow as ice crystals to ~3 to 8µm and
are detected at the exit with an optical particle counter (OPC).
The number of voltage pulses exceeding the threshold for 3µm
particles is recorded at 5Hz. Analog pulse heights are also scaled
into 256 channels, compiled every 10s, for analyzing particle
size distributions from ~0.4 to 8µm. The crystals exiting
the chamber can be collected on electron microscope grids with
an inertial impactor.
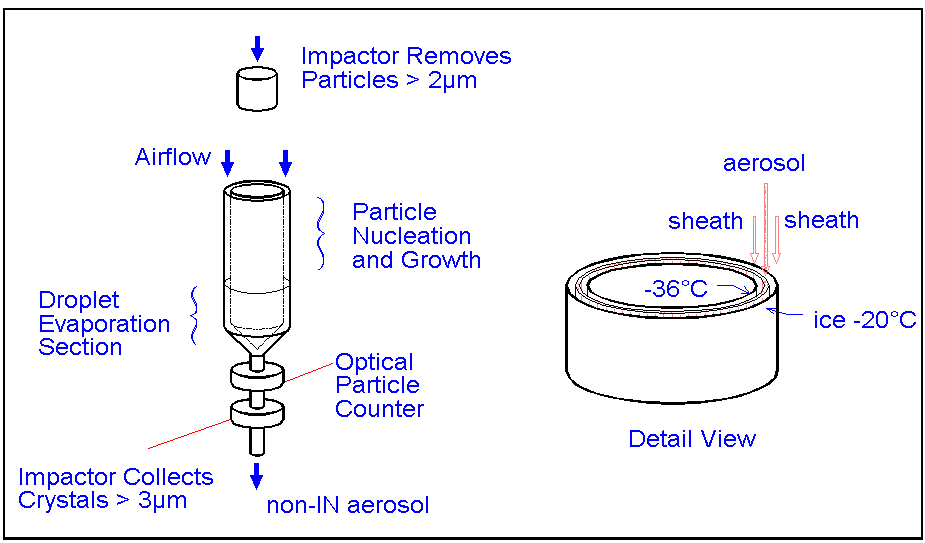
Total flow through the CFD is ~10LPM, of which the
sample is ~1LPM; thus 90% of the flow is filtered and recycled
as a particle free sheath. The flow is laminar, and residence
time is 3-10s. Sample temperature can be set in the range 10
to -35°C. The sample humidity can be independently set from
ice saturation to 20% water supersaturation, SSw.
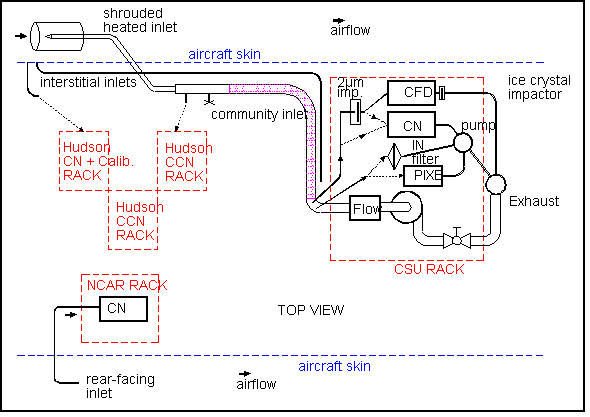
Arrangements for sampling air on the C-130 are shown in Figure 2. The community air was continuously flushed with a large flow of air (~1000 LPM). Ice nuclei measurements were made at the CSU instrument rack with small flows from the duct. The CFD drew about 1 LPM and the CN counter drew ~1.5 LPM. During selected periods of ~10-30 minutes, additional aerosol samples were collected on 47mm diameter polycarbonate membrane filters. These collected all aerosol particles for later processing in the laboratory. Other samples of total aerosol were taken by using a PIXE impactor to collect particles onto electron microscope (EM) grids. Another impactor at the exit of the CFD chamber was used to collect crystals that nucleated and grew in the chamber. These crystals contained the ice nucleating particles and were collected on TEM grids.
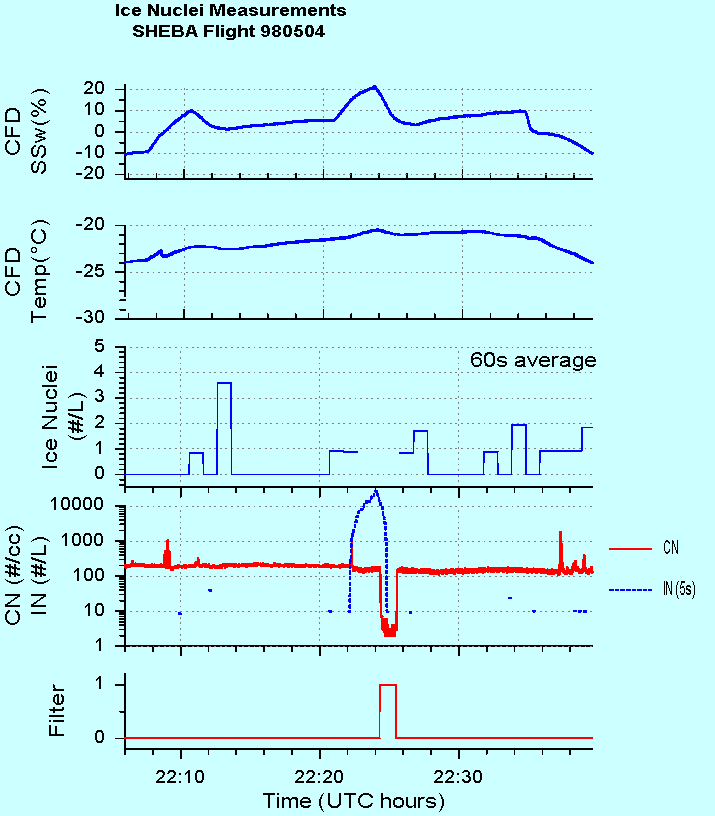
An example of ice nuclei measurements is shown in Figure 3 for the May 4 flight from 22:06 to 22:40UTC. The aircraft had just descended through the inversion and low level cloud, then spent the next hour flying transects near SHEBA at altitudes from ~30m to ~500m AGL. During the descent, the vertical profile showed strong changes of aerosol concentration that coincided with the thermal stratifications, as described elsewhere in this paper. The figure shows that CN concentrations near the surface were generally quite small and steady ~200/cc except for occasional brief spikes of higher concentration when the airplane crossed its own exhaust (see flight track) or perhaps the plume from the ship. The large dip in CN was caused by deliberately filtering the sample (see bottom panel) as a check for air leaks.
The ambient temperature was 20°C at the top of the inversion (1000m AGL) and 24°C at its base (~980m AGL). As shown in the top two panels of Figure 3, the ice nuclei were measured over a range of temperatures and humidities in the CFD chamber, from 24 to 20°C and from 10% to +20% supersaturation during this time period. The IN concentrations are shown in two panels - on the linear scale to illustrate the consistently low values, and also on a logarithmic scale (with CN) to illustrate the high concentrations that appeared when the supersaturation was > +20%. Note that the high values dropped rapidly to zero in response to the filter, in parallel with the CN. For supersaturations < +10%, IN concentrations were generally very small, averaging 0.45/L before the SSw peak and 1.30/L afterwards. The linear plot of IN shows the 60 second average concentration, and is based on accumulating the 5Hz counts and dividing by the sample volume. Sixty second samples are ~1.0 liter. A large fraction of the 5Hz counts were zero: outside the SSw peak, there are ~8350 points, of which 98.9% are zero.
What is the significance of the large IN concentrations at high SSw? Values of SSw larger than about 2% are not generally expected in clouds, since CCN particles are usually sufficiently abundant to limit the peak SSw. Nevertheless, there have been speculations, based on theoretical analyses, that there can be small regions of some clouds where there are few CCN, and SSw can rise to higher values. We operated the CFD at high SSw because it is possible with this technique. The measurements shown here suggest that if such SSw could be achieved in clouds, large numbers of ice crystals would be nucleated. We do not infer that high SSw can be achieved in Arctic clouds.
Impactor samples of IN and total aerosol were obtained during this time period, but they have not been analyzed yet.