C-130 flying with Twin Otter

03:00 to 04:30 C-130 Particle number concentration and volume plots. Upper six plots = size distributions. Lower six plots = volume distributions. Each plot is a 15-minute average that corresponds approximately with constant altitude sections of the stair-step descent.

Major difference between first two plots echoes the changes seen in the time plot (middle panel).

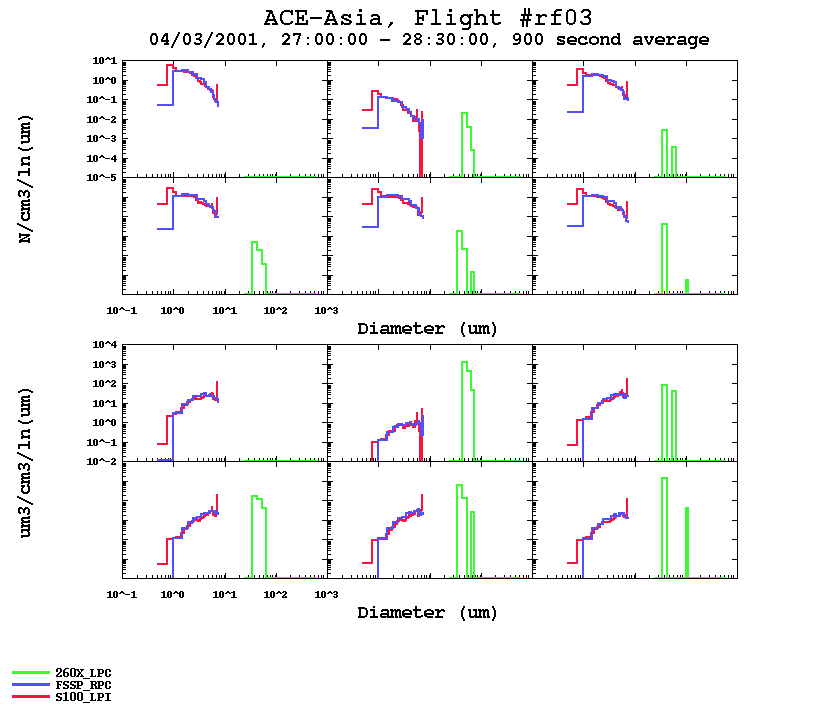
NOTE FSSP-100 and SPP-100 data agreement. Major contribution to volume loading > 40µm.
Missing size range 8-40µm was measured starting with RF#4 (April 6) when size range on FSSP was changed to 2-47µm.    NEXT

size and volume plots