NOTE that FSSP-100 and SPP-100 data overlap. Major contribution to volume loading > 40”m.
Missing size range 8-40”m was covered starting with RF#4 (April 6) when size range on FSSP was changed to 2-47”m.
NEXT
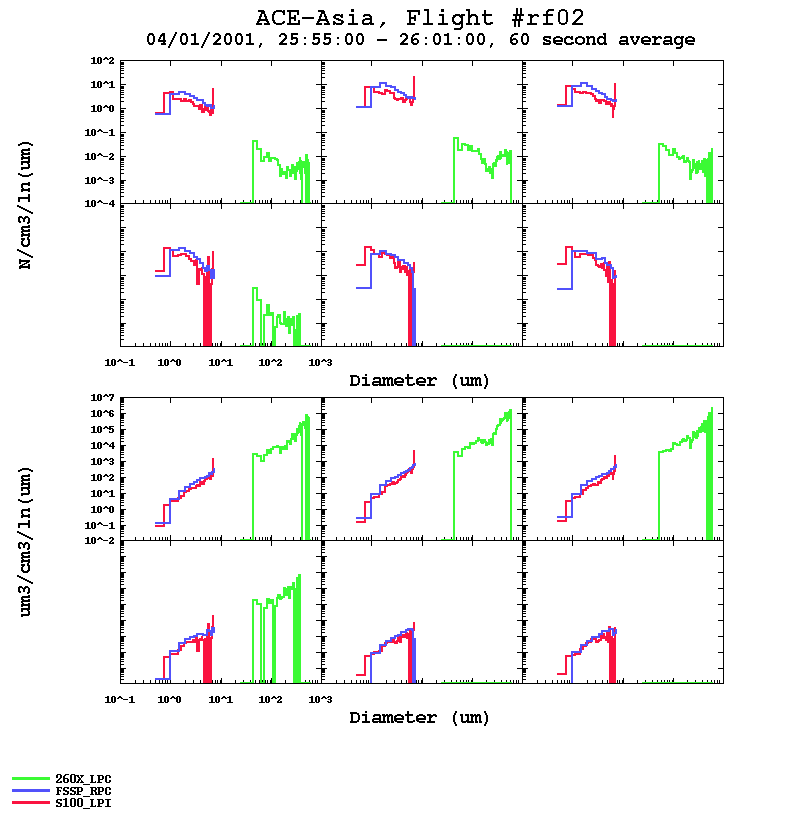
| C-130 Particle number concentration and volume plots. Upper six plots = size distributions.
Lower six plots = volume distributions. Each plot is a one-minute average.
NOTE that FSSP-100 and SPP-100 data overlap. Major contribution to volume loading > 40”m.
|
|
|