Humidity was high ~90% and increased toward end of time segment. Several particle modes are present including haze ~2”m and cloud droplets ~10”m. back to START
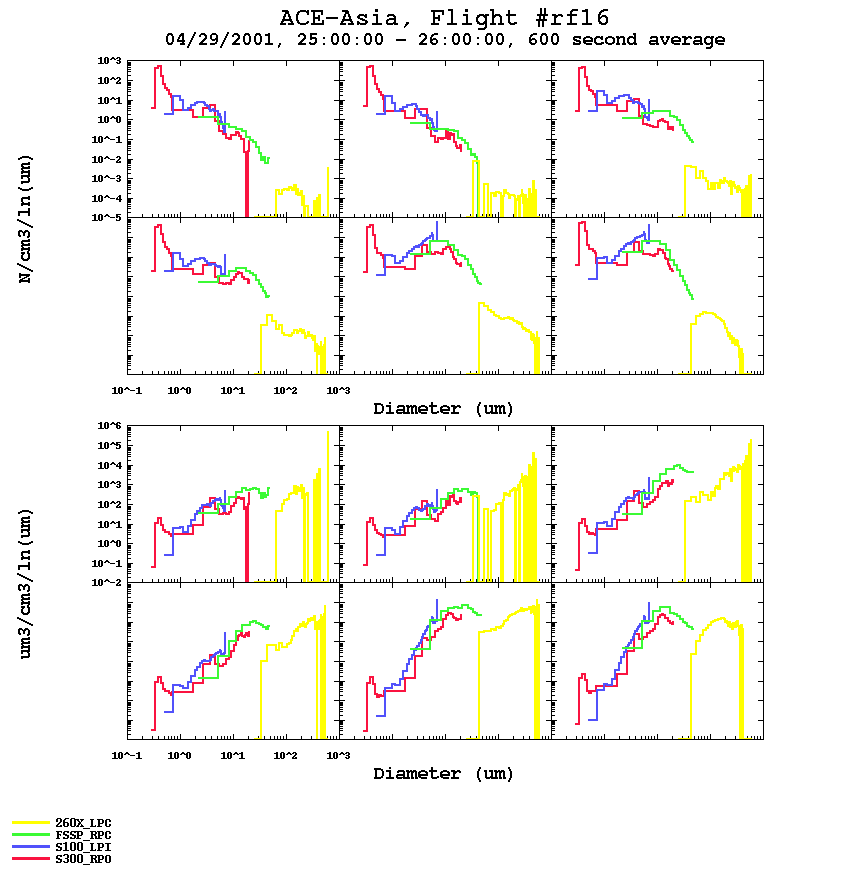
| 01:00 to 02:00 C-130 particle number concentration and volume plots. Upper six plots = size distributions.
Lower six plots = volume distributions. Each plot is a 10-minute average.
NOTE instrument size ranges overlap from ~1 to 20”m, and distributions show general agreement.
Humidity was high ~90% and increased toward end of time segment. Several particle modes are present including haze ~2”m and cloud droplets ~10”m. back to START |
|
|