


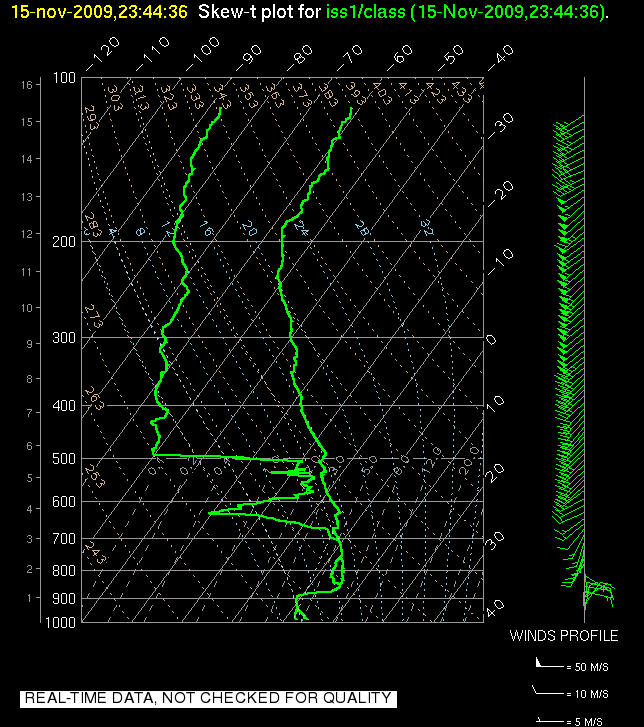
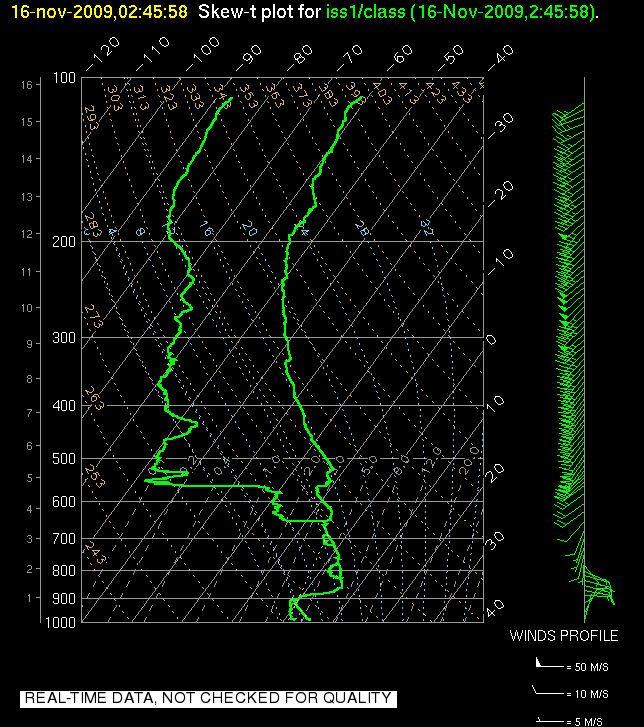
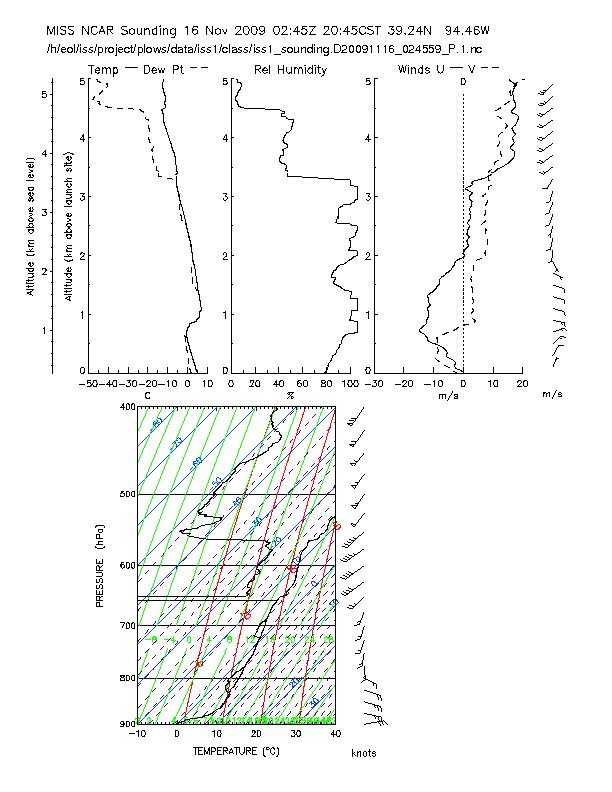
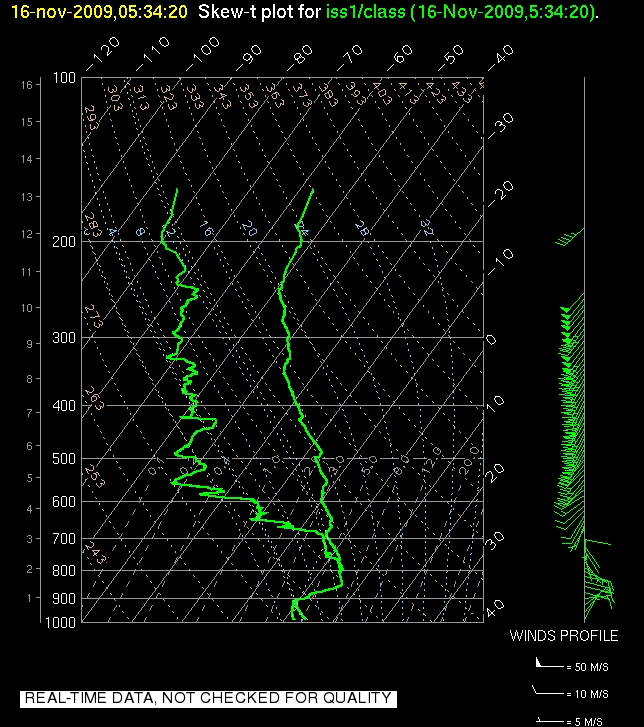
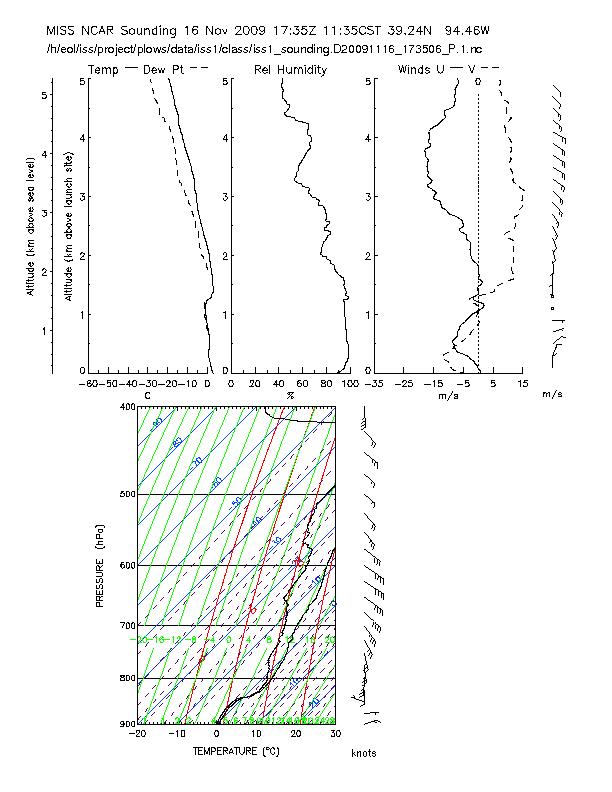
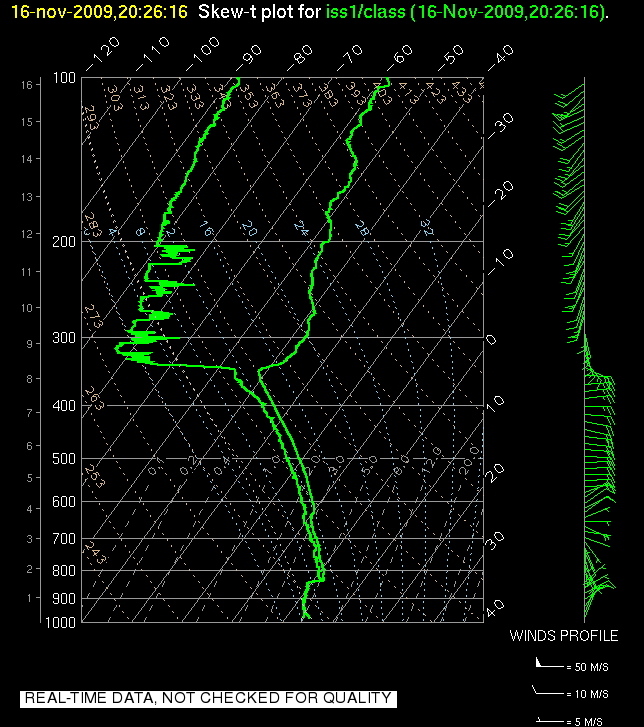
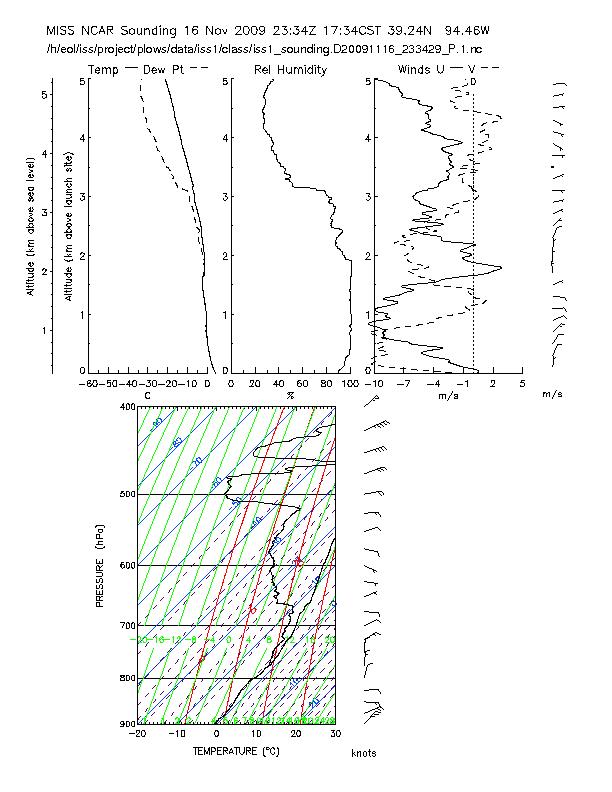
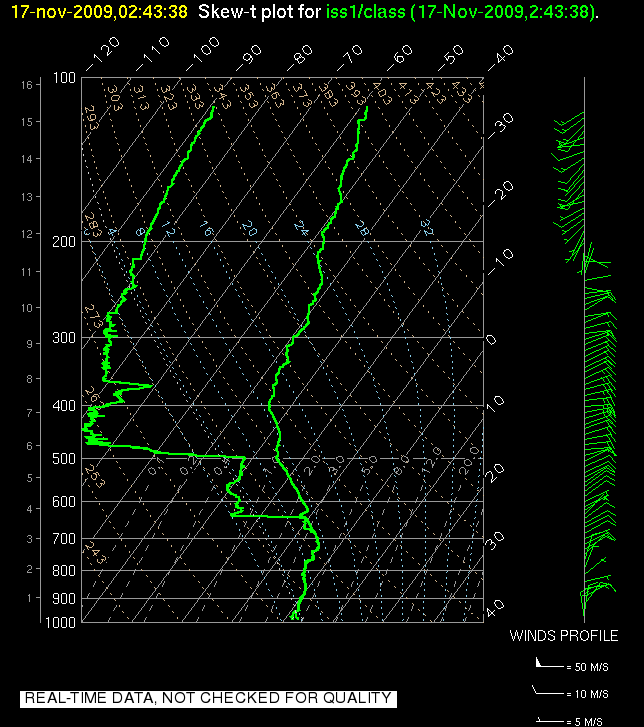
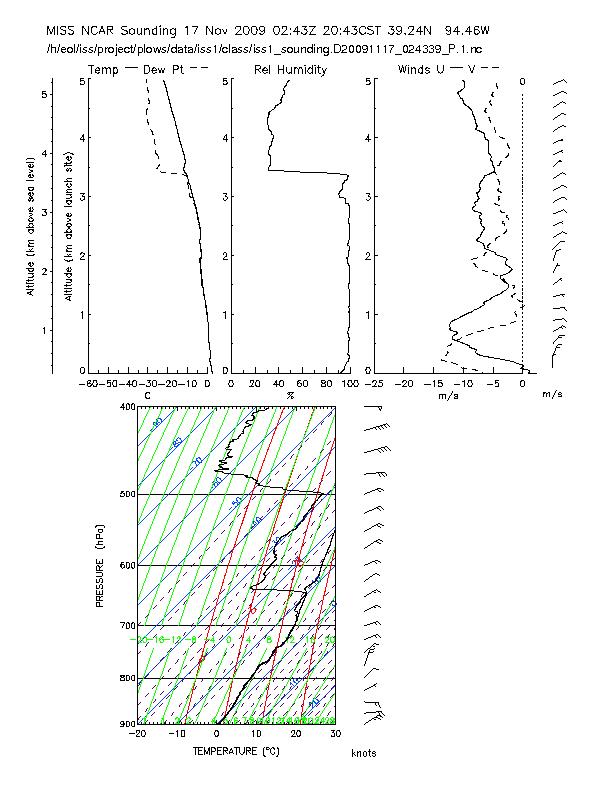
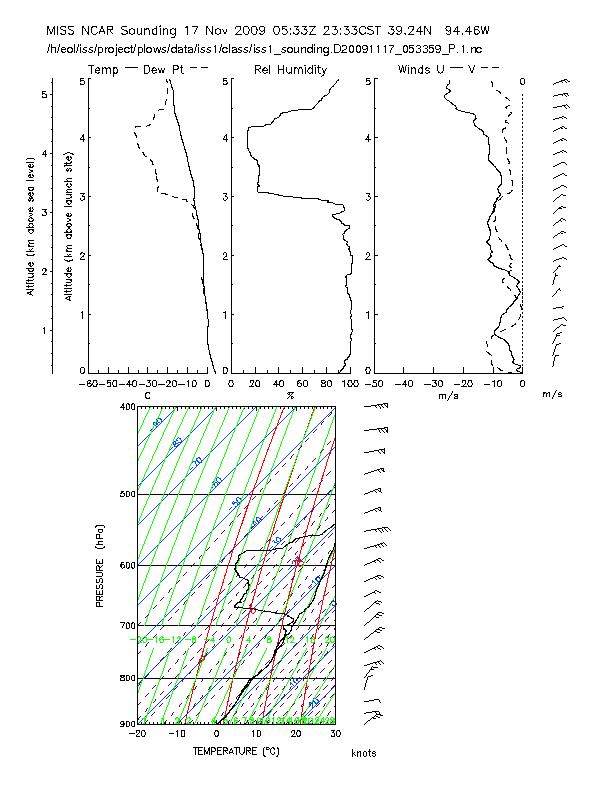
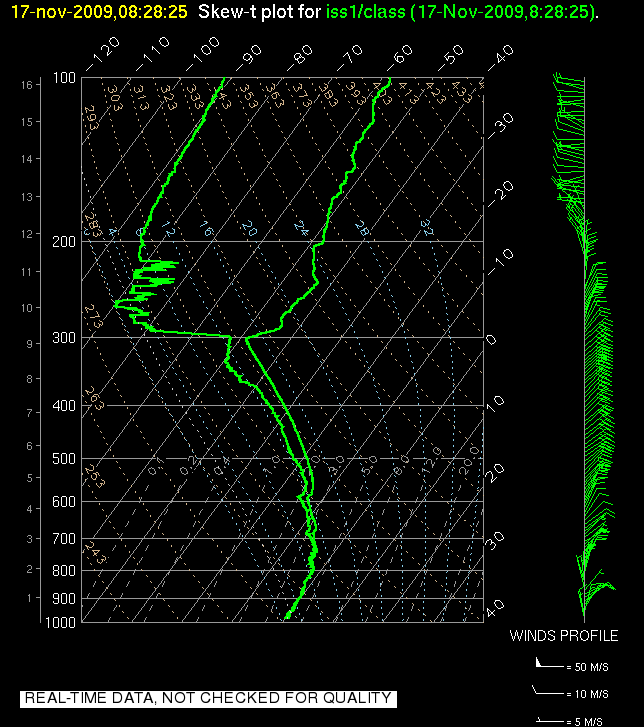
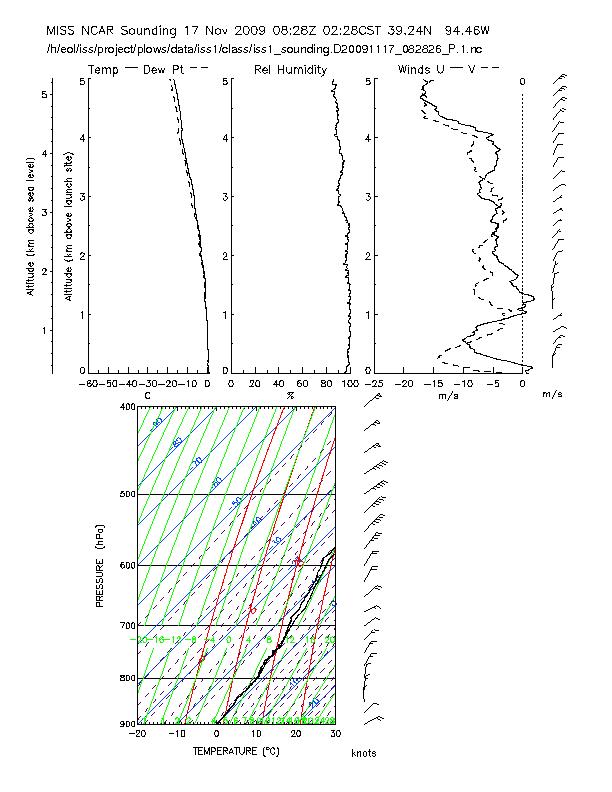
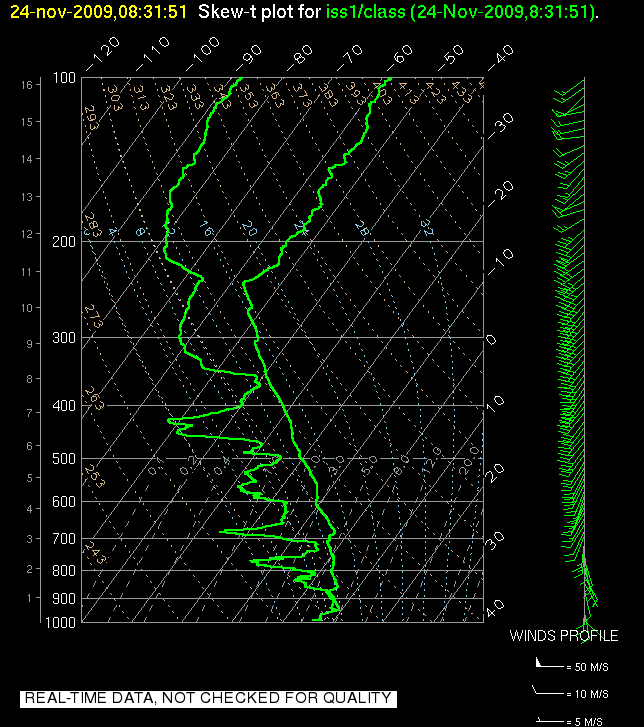
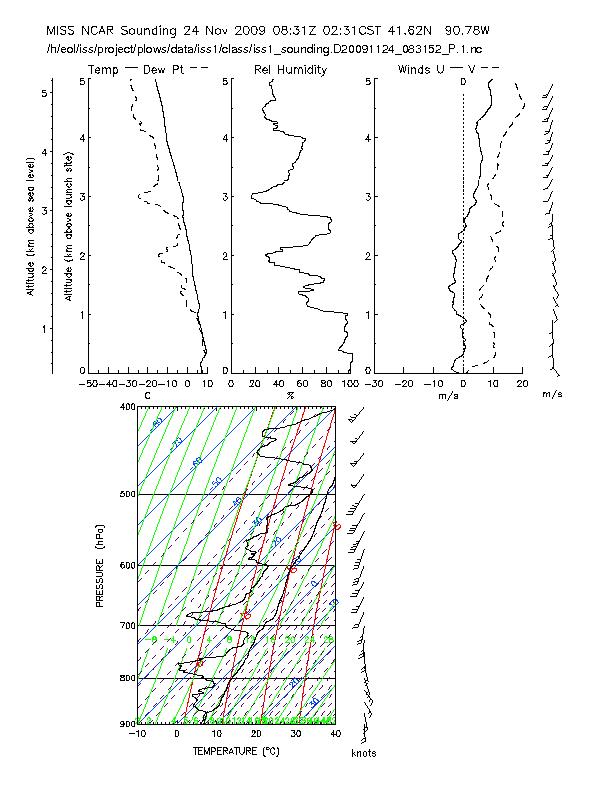
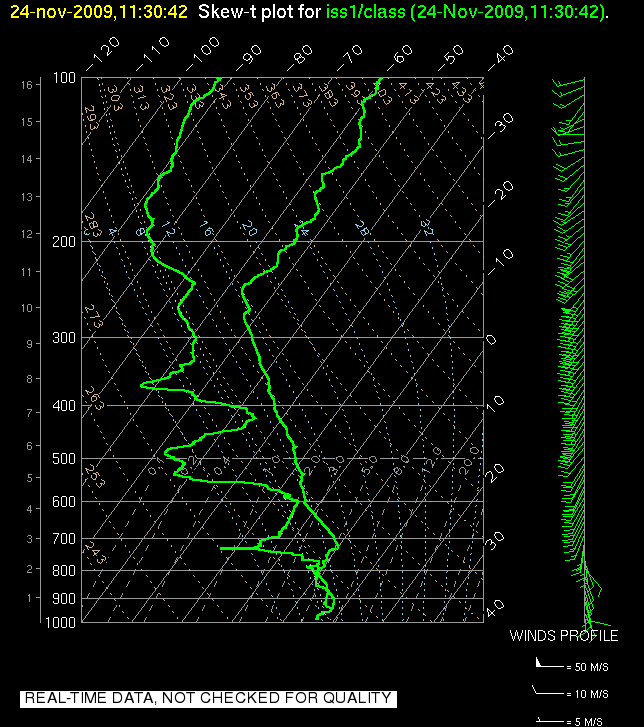
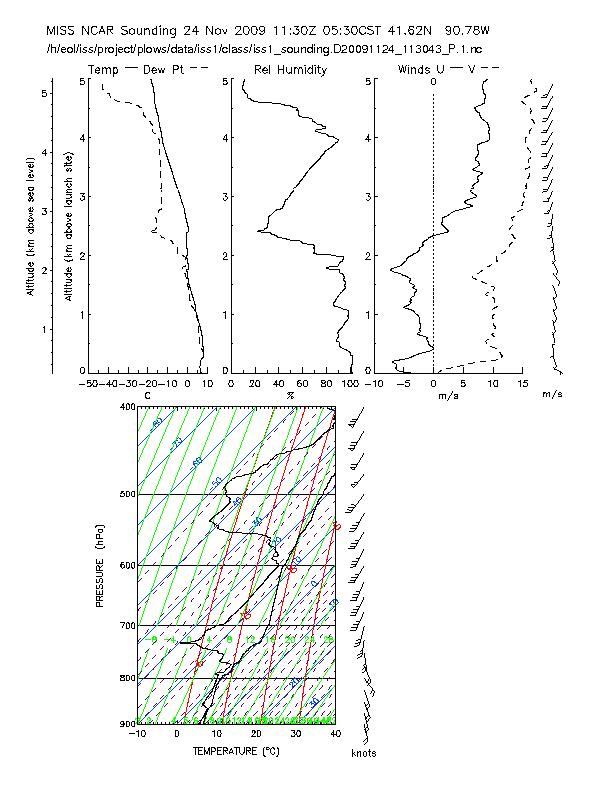
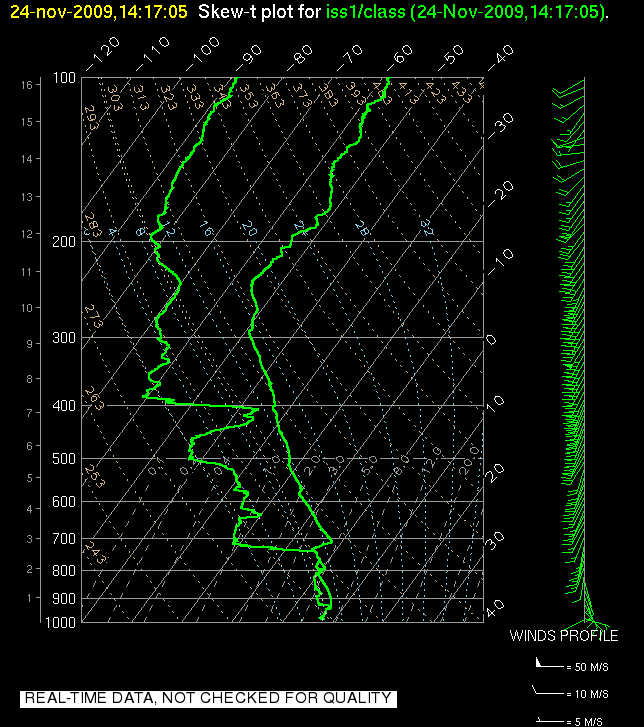
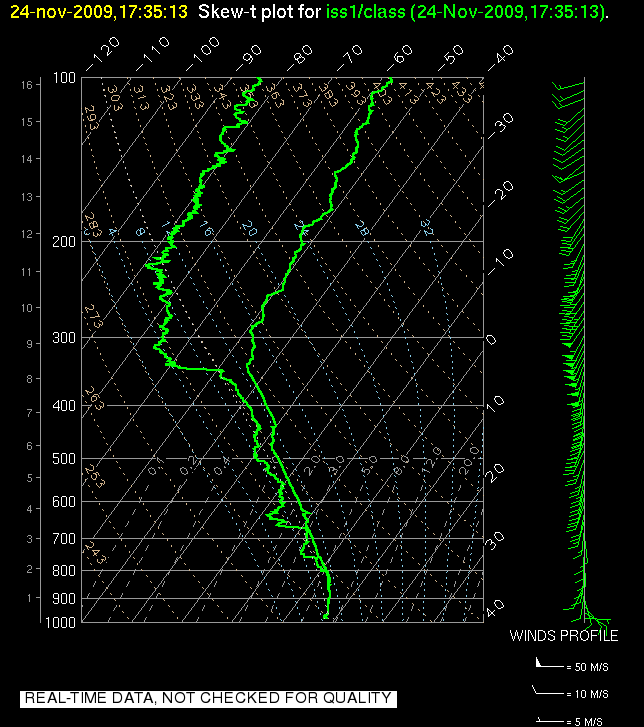
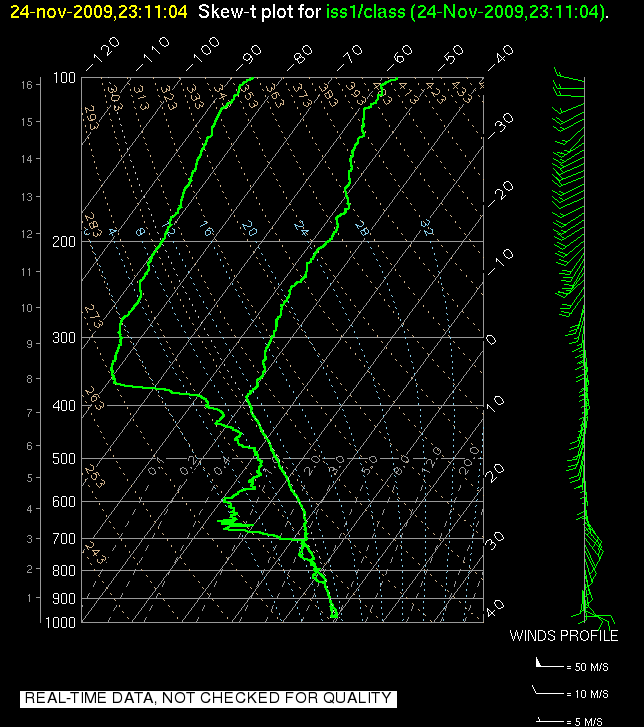
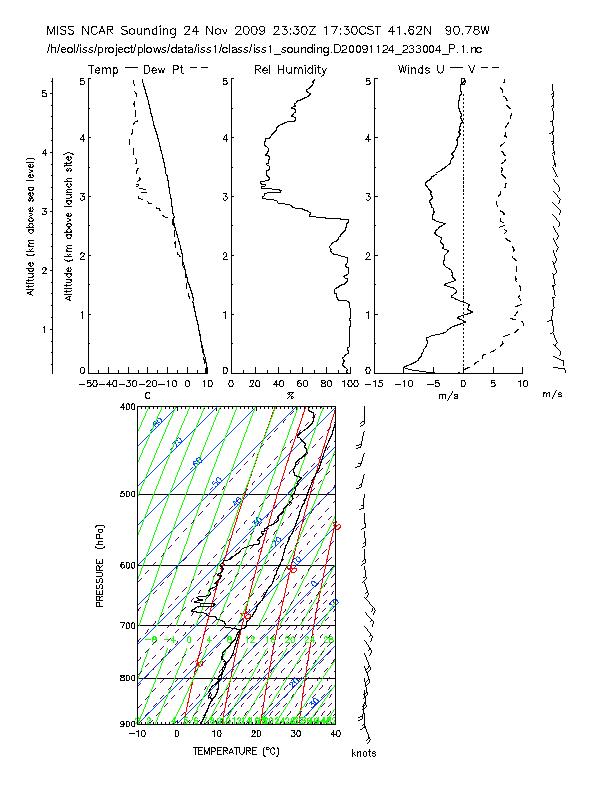
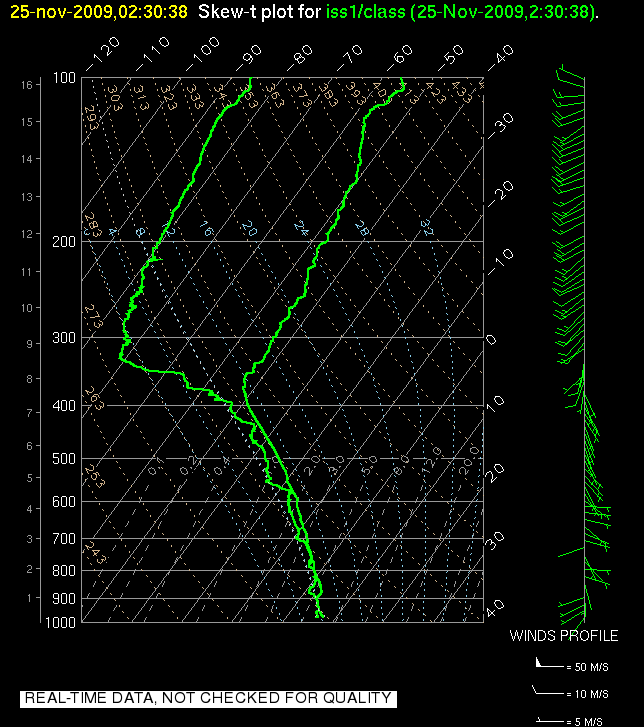
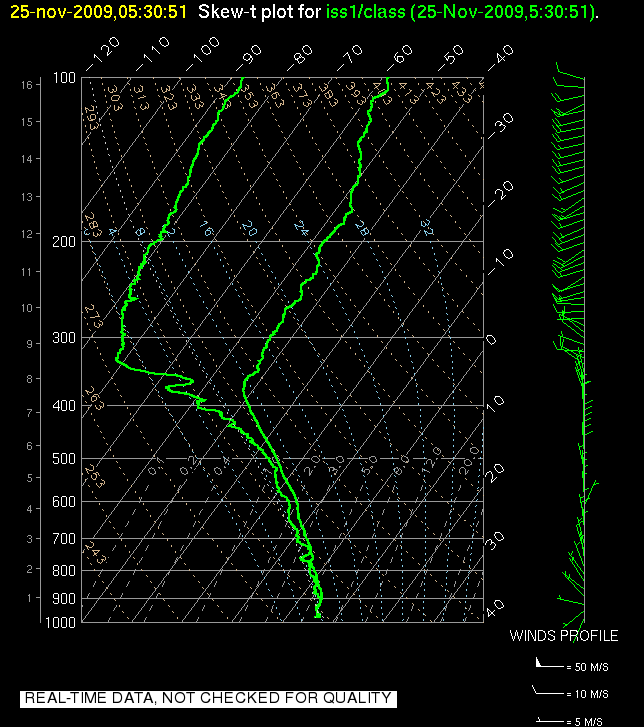
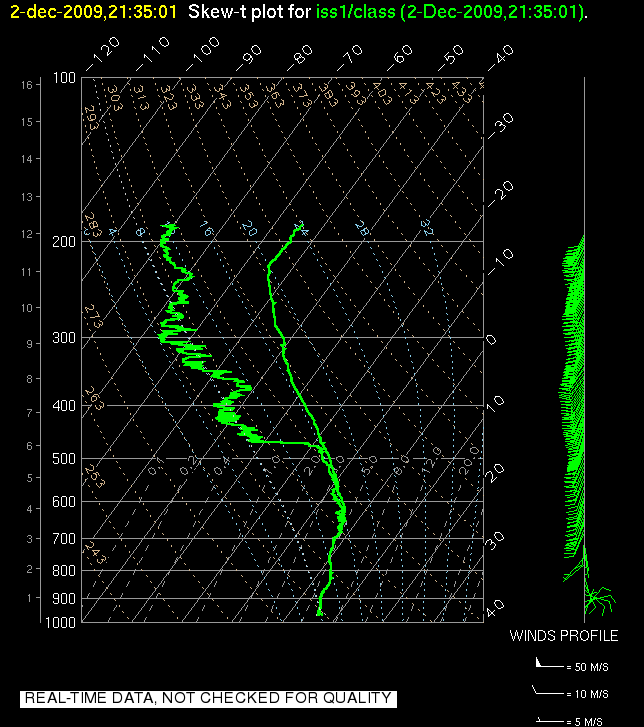
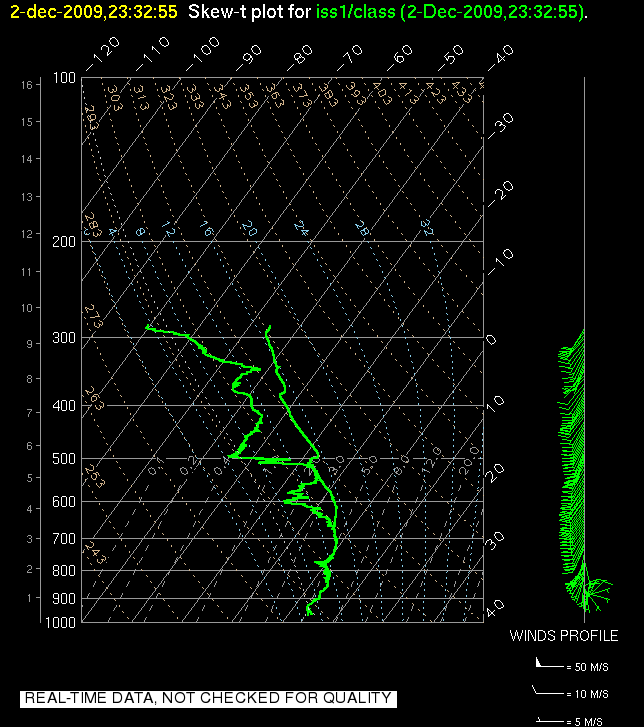
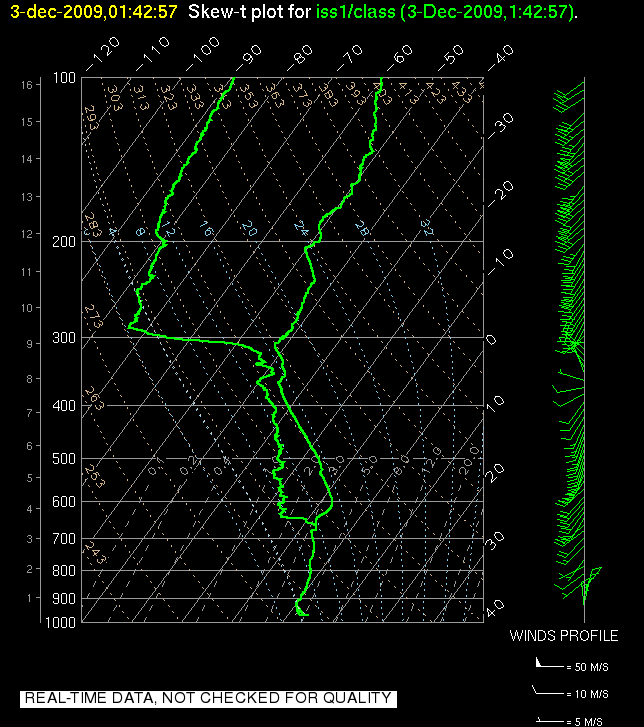
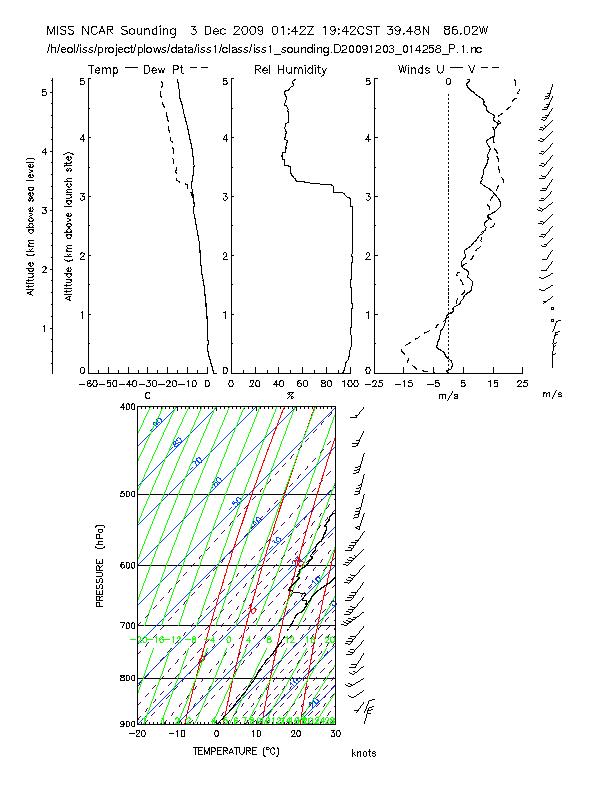
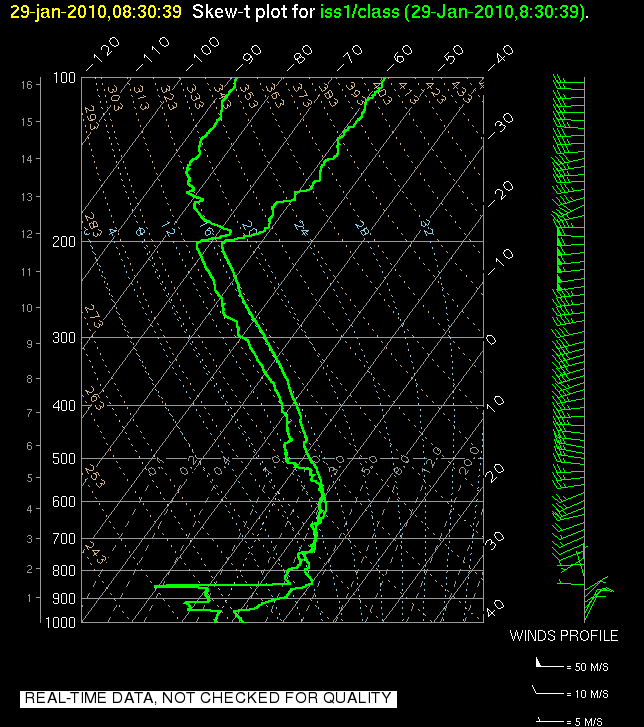
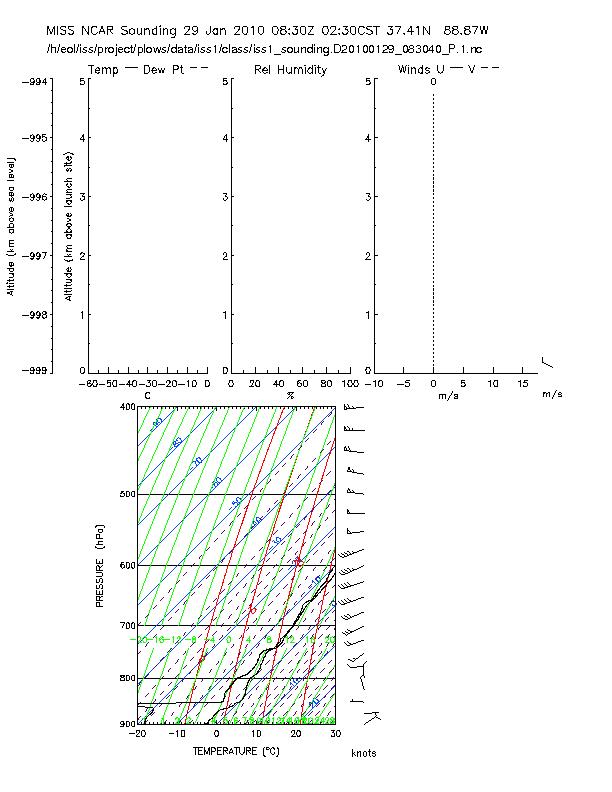
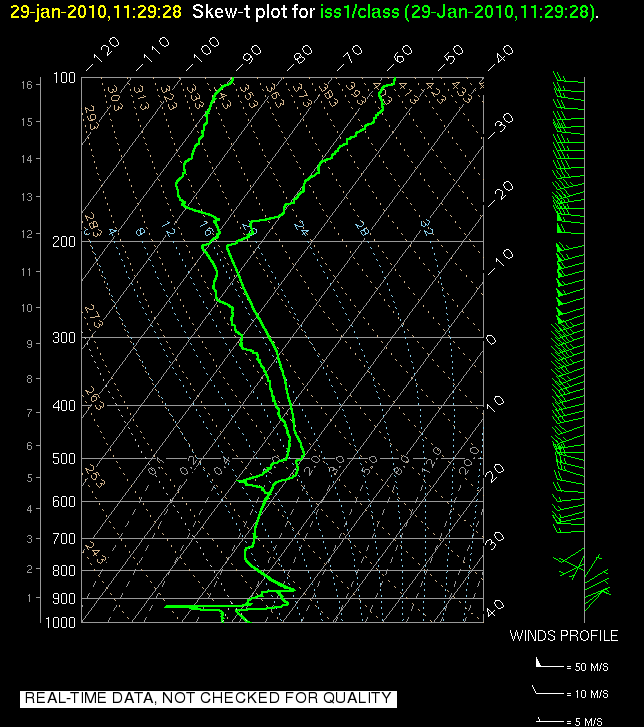
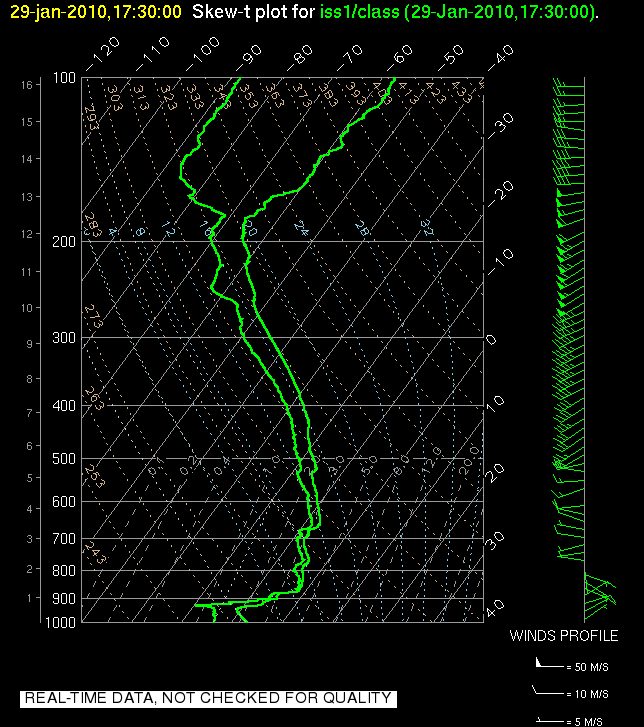
NCAR/EOL MISS GAUS Radiosonde Soundings made in support of the PLOWS project. (See the ISS/GAUS PLOWS web page).
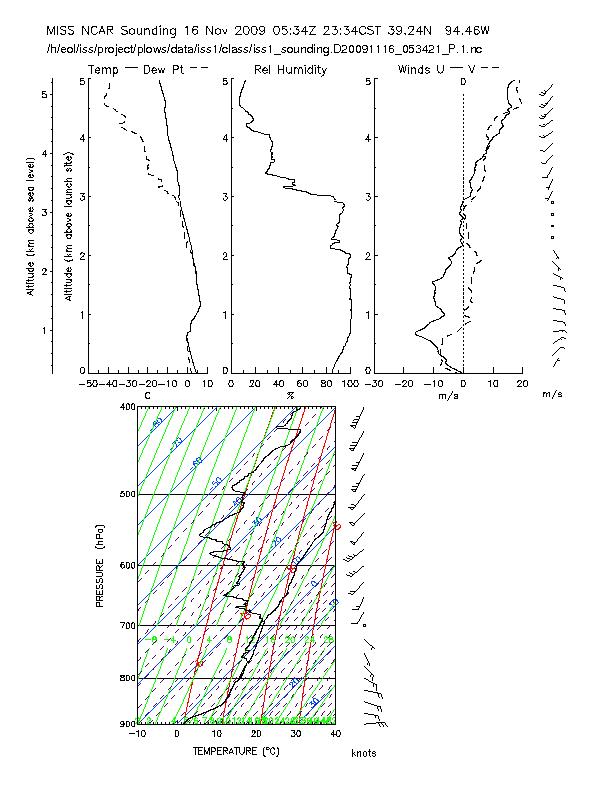
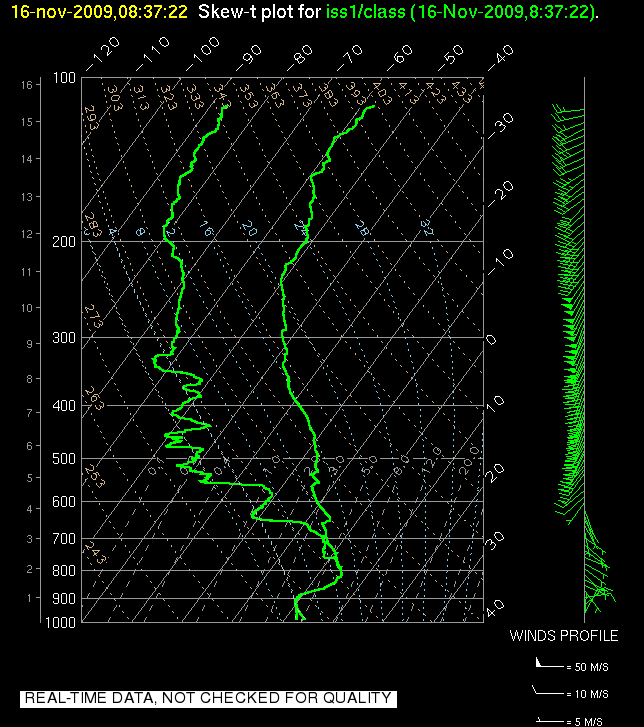
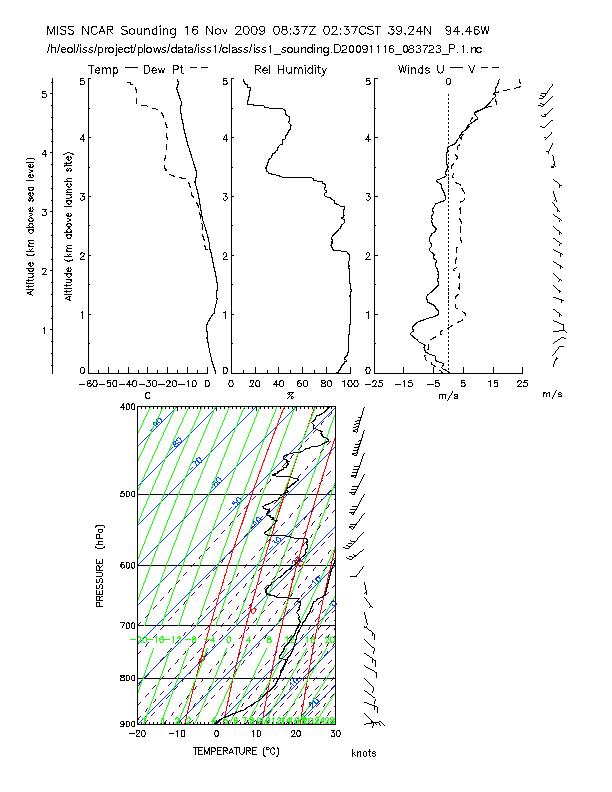
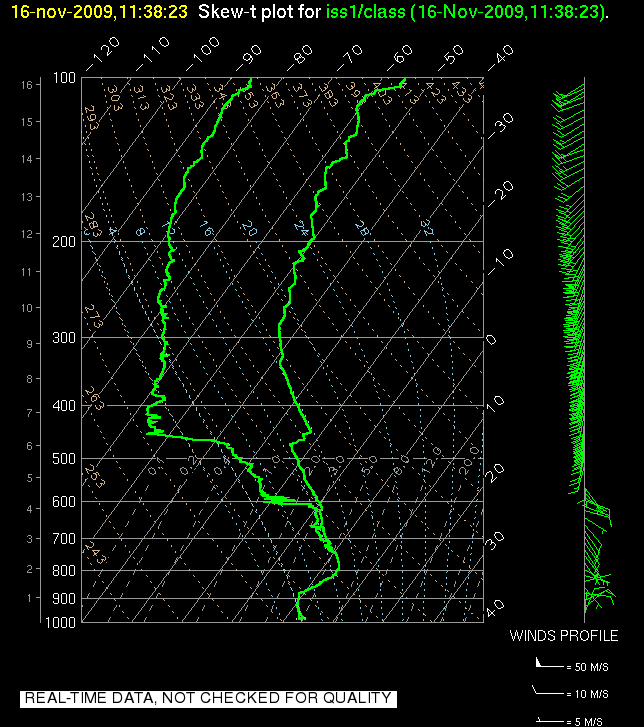
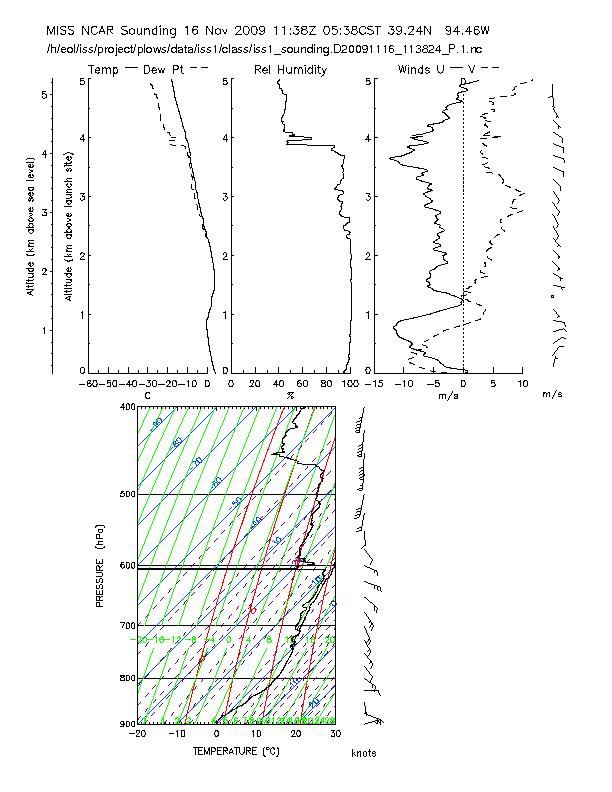
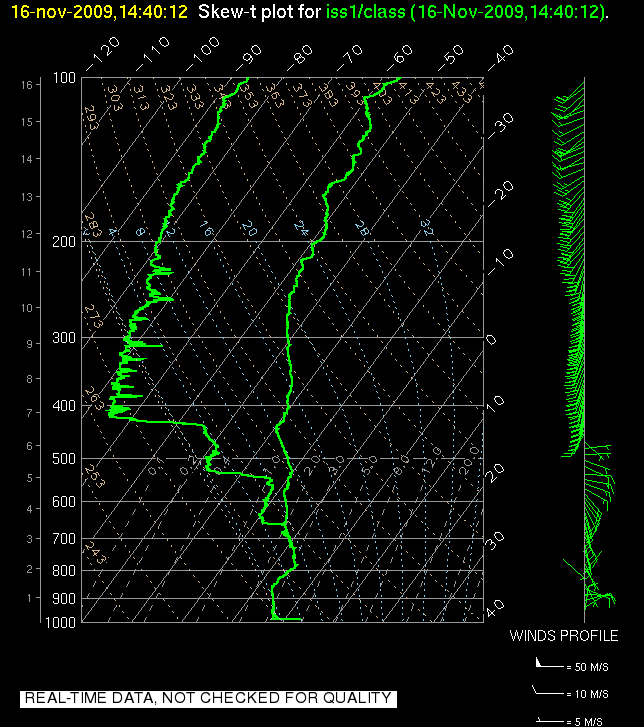
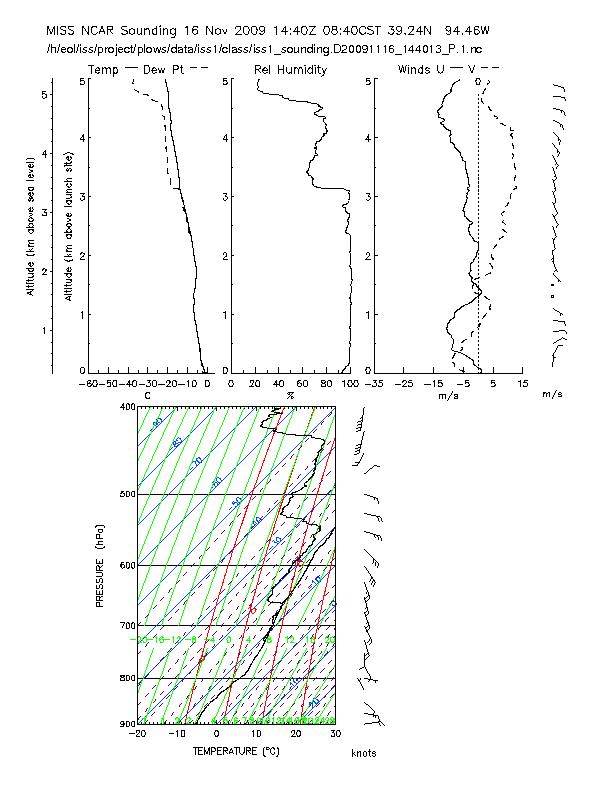
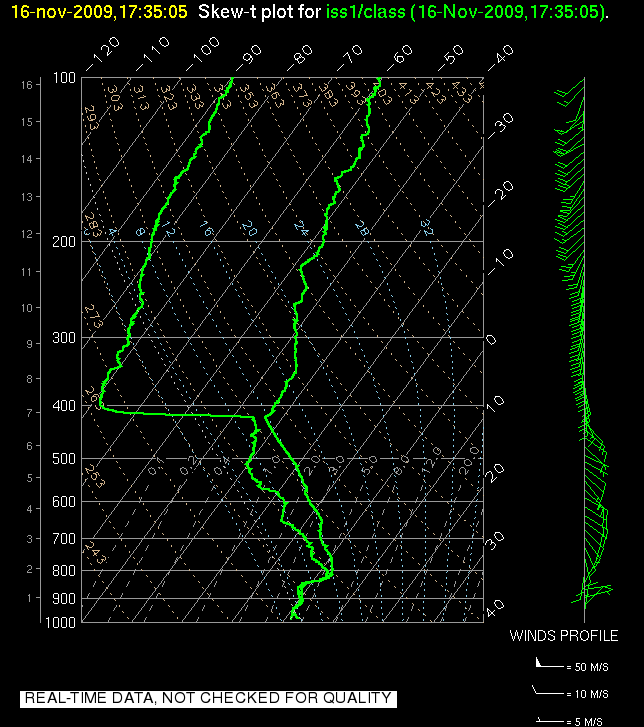
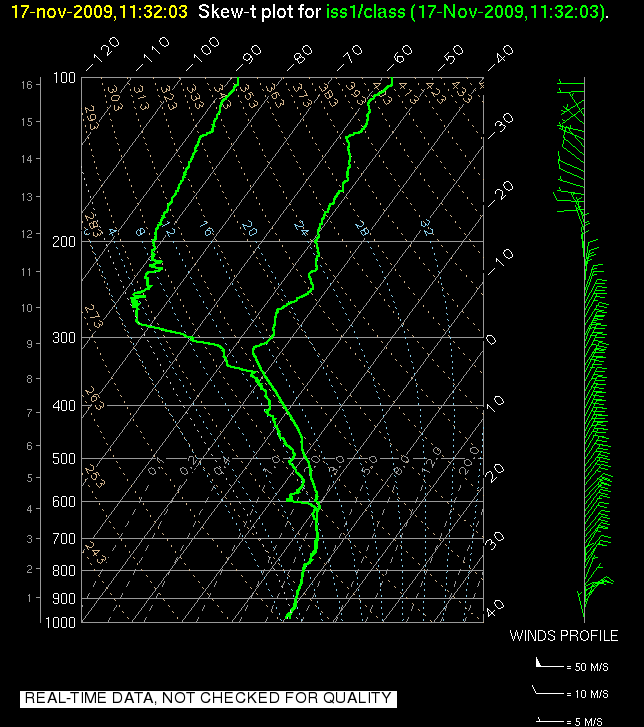
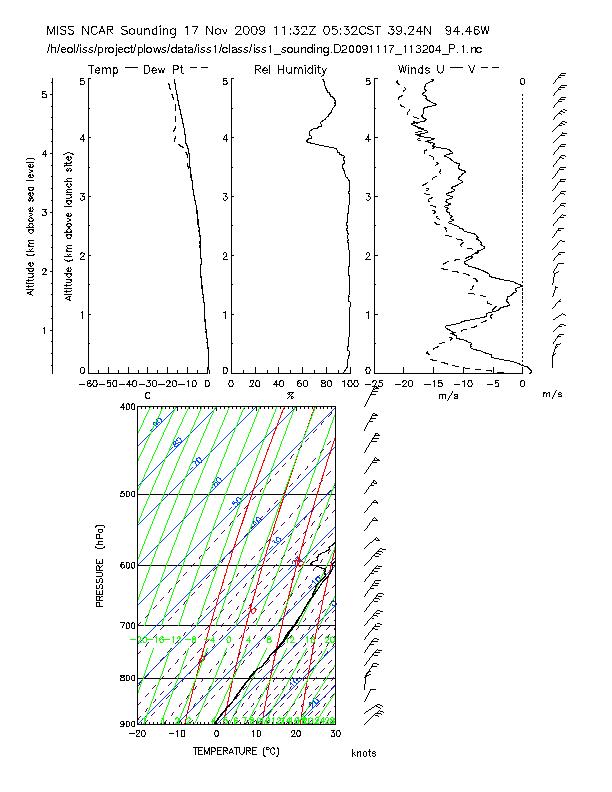
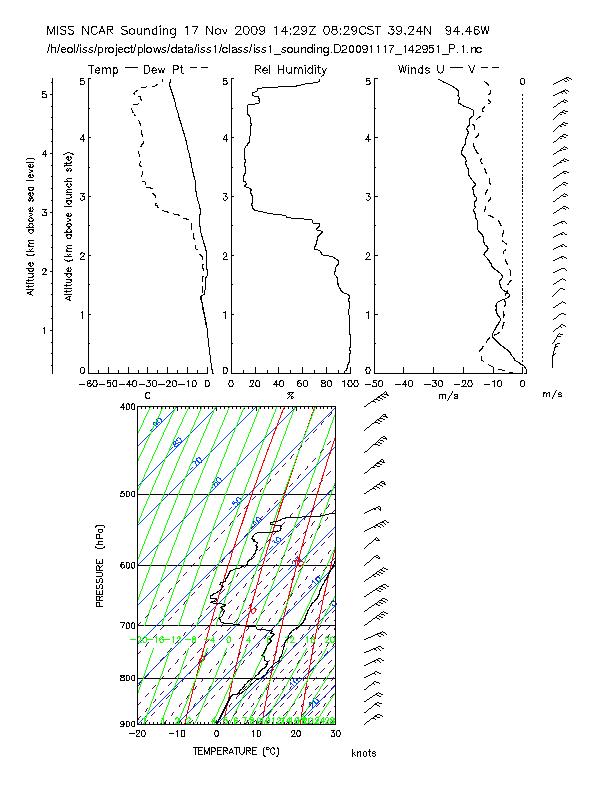
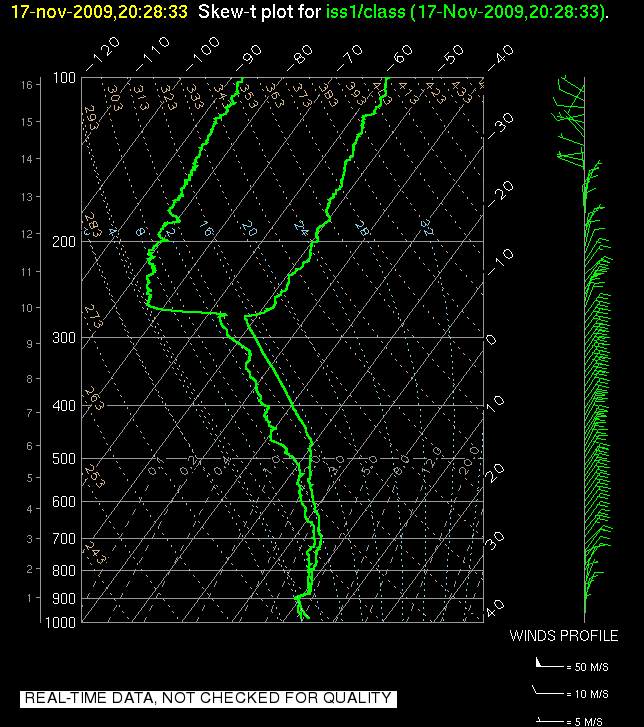
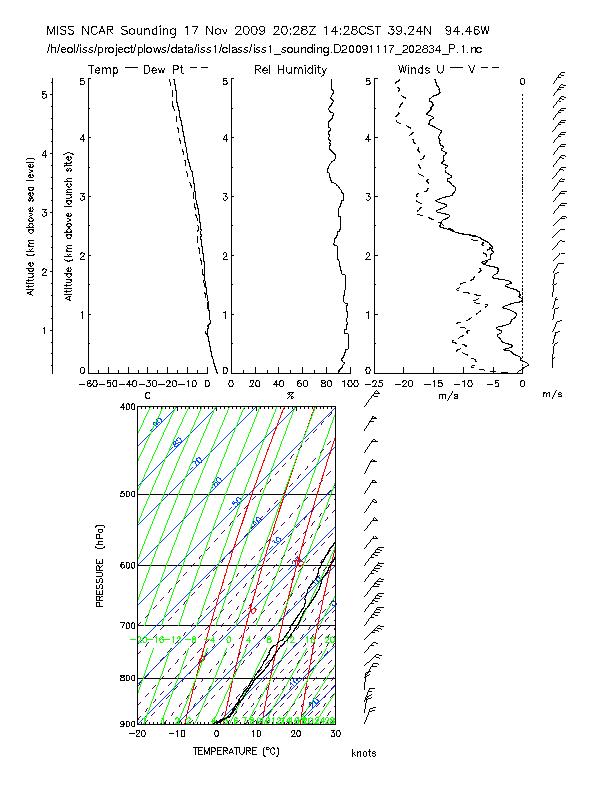
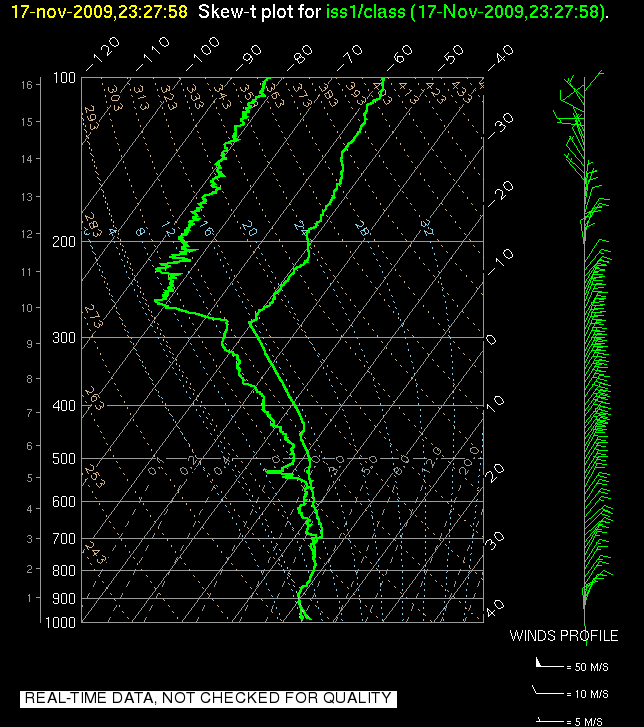
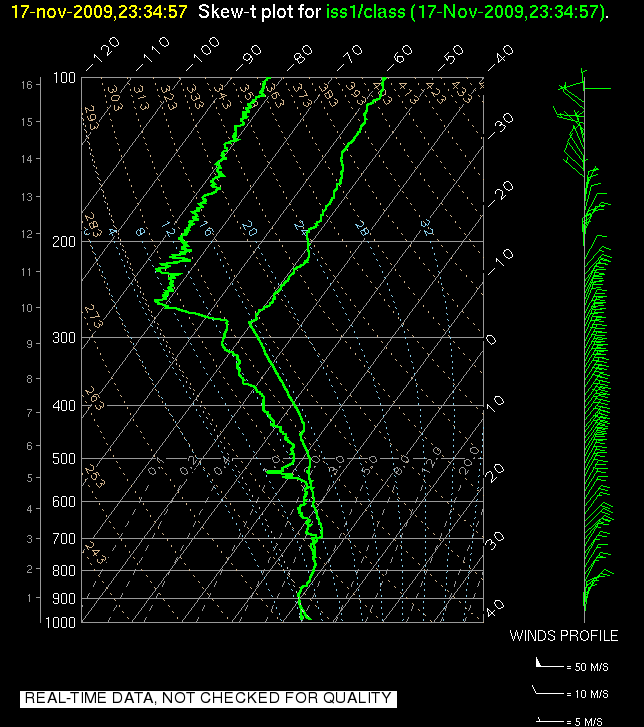
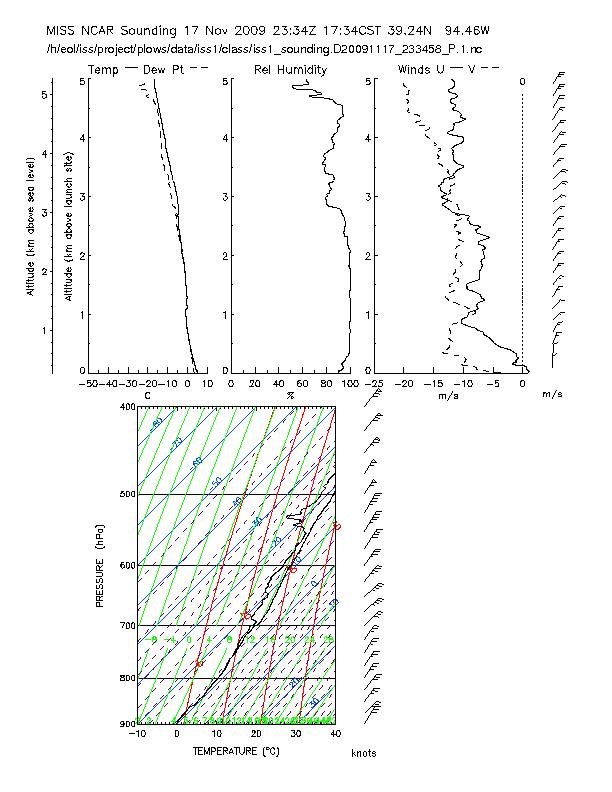
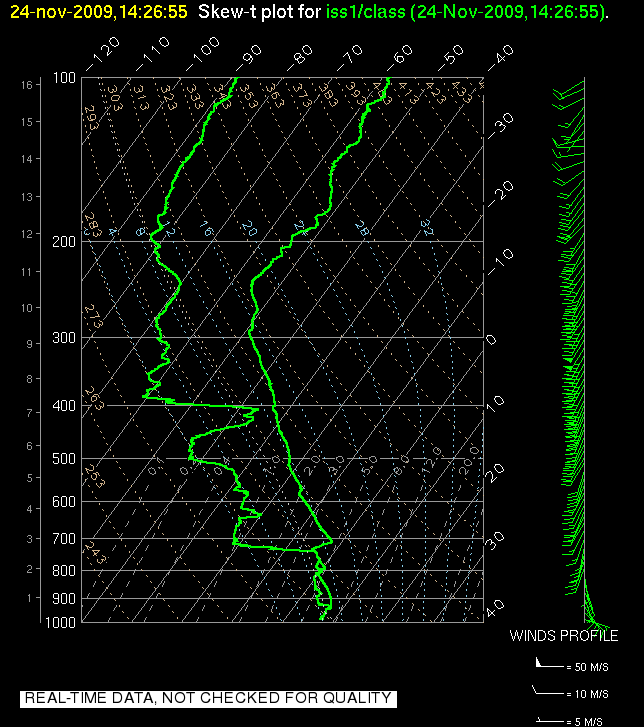
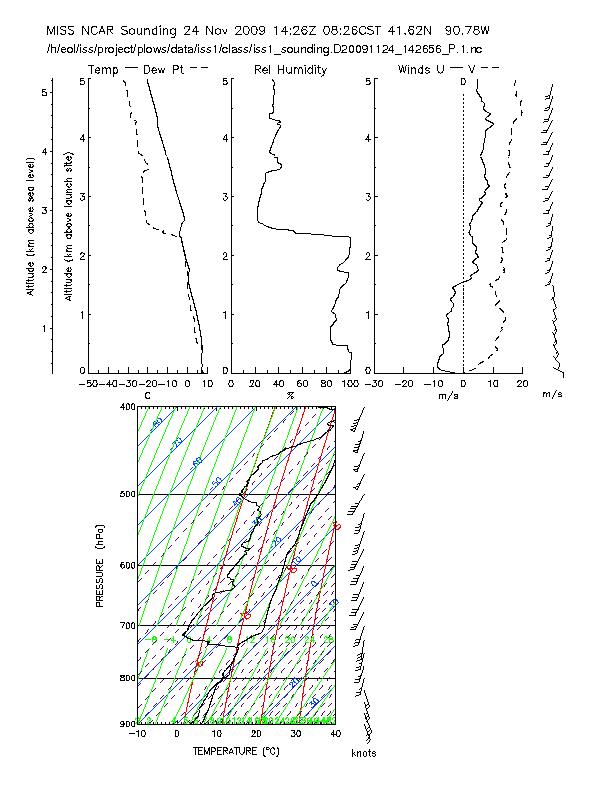
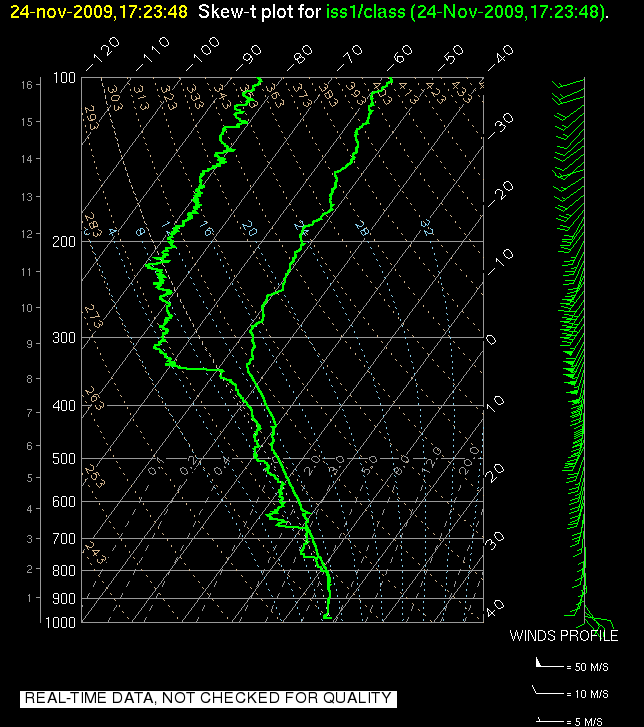
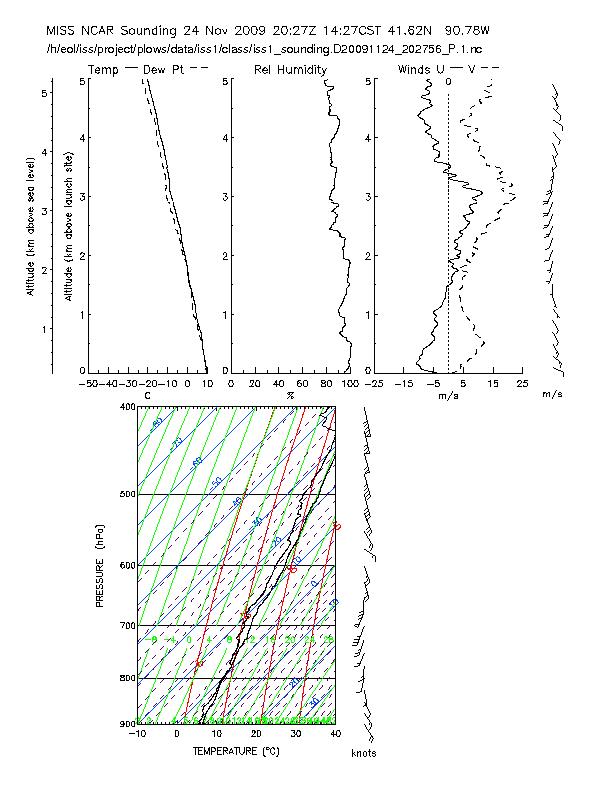
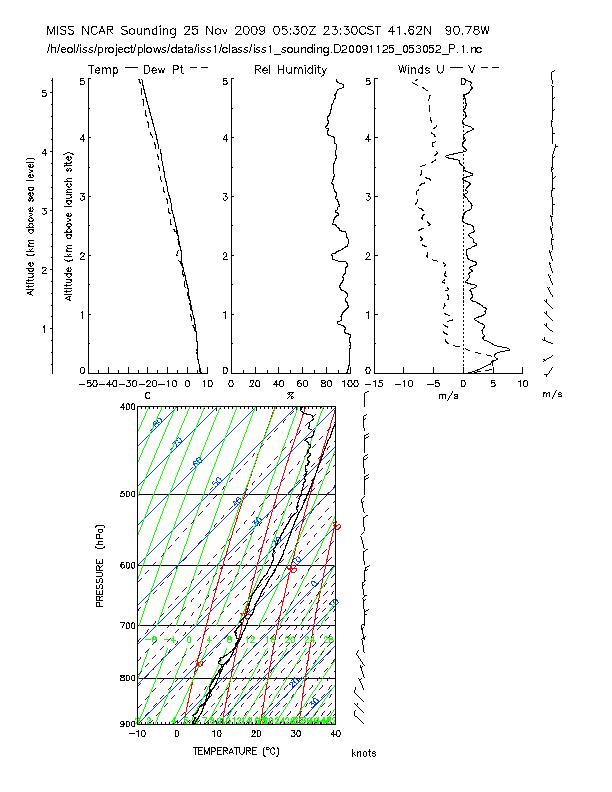
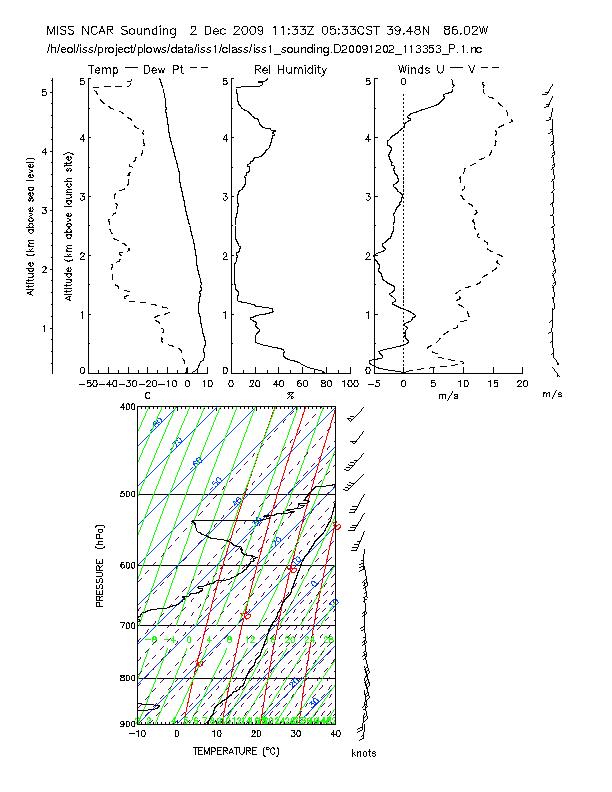
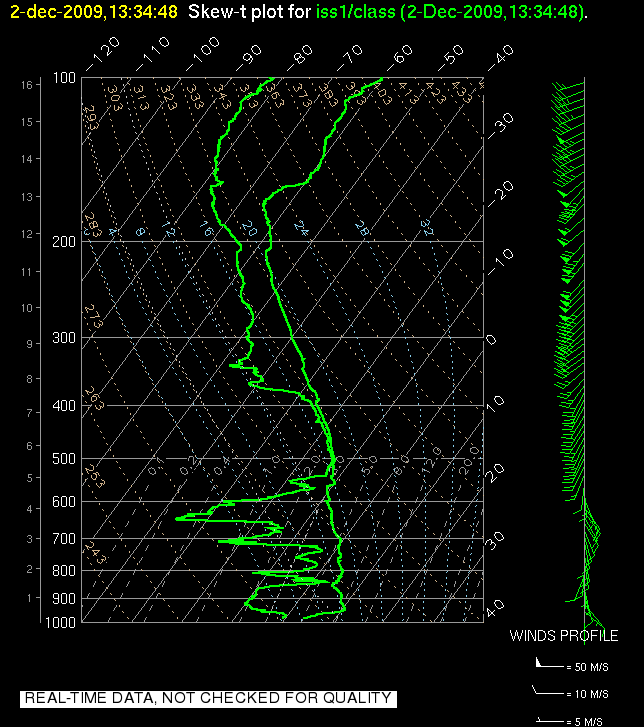
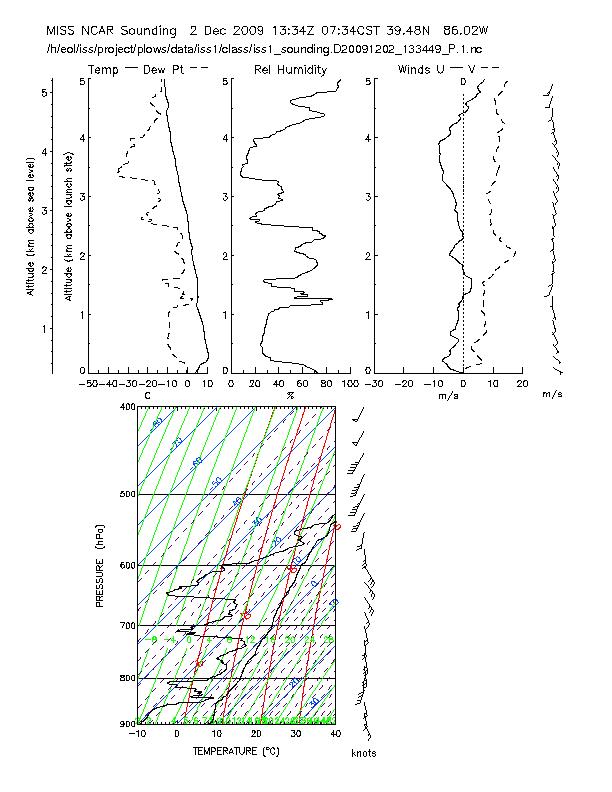
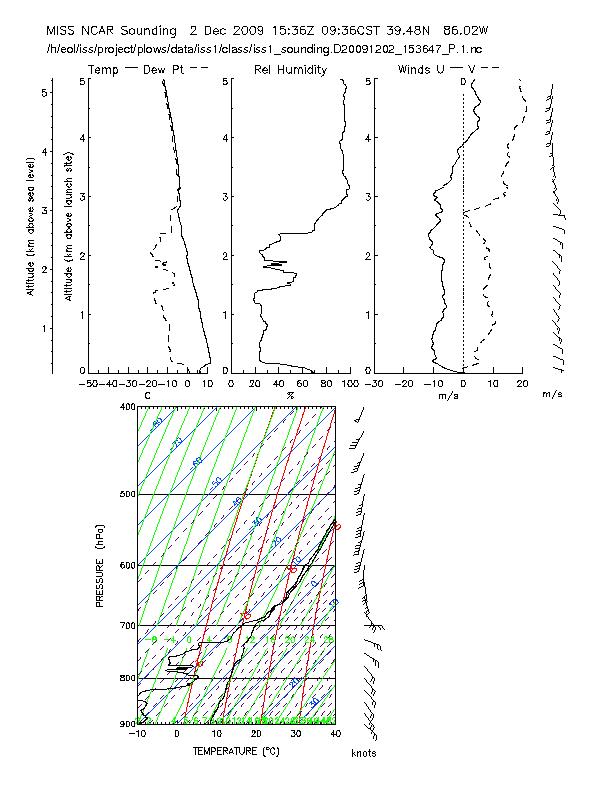
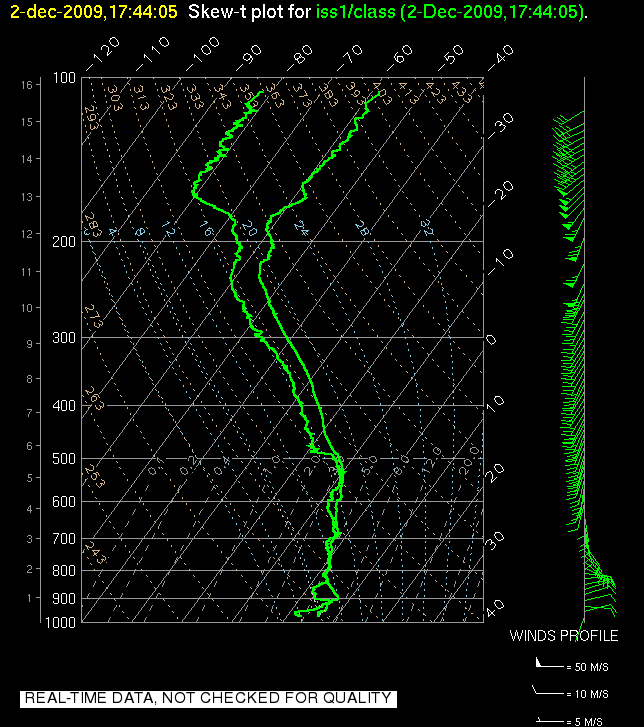
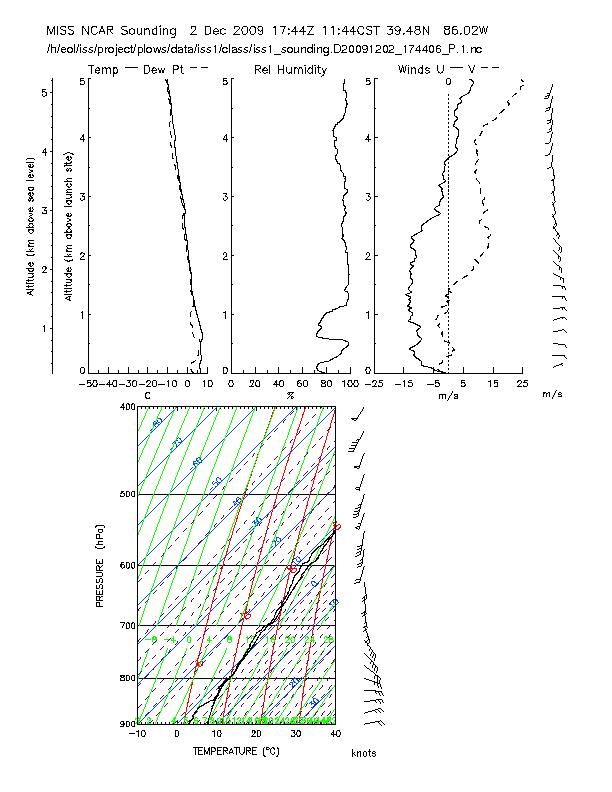
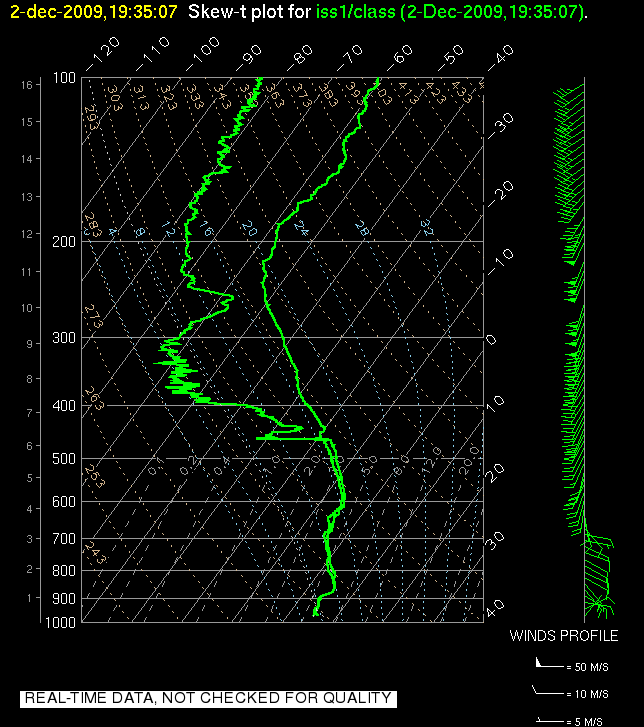
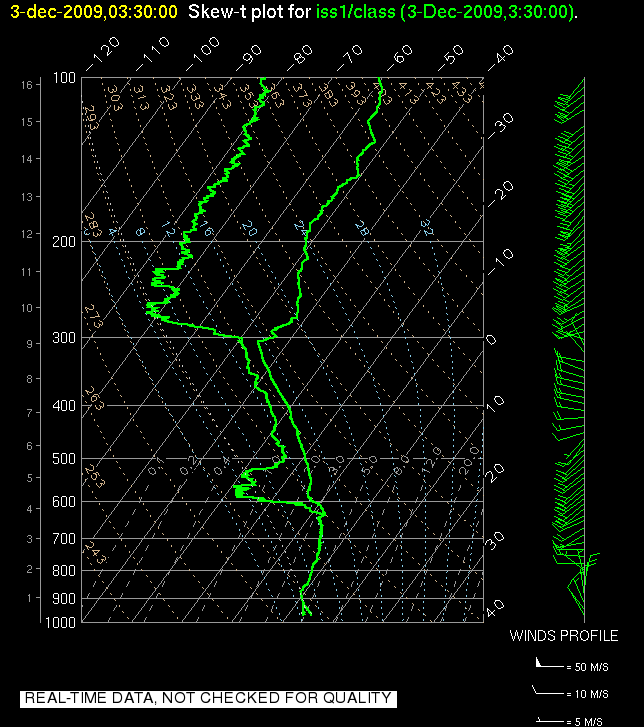
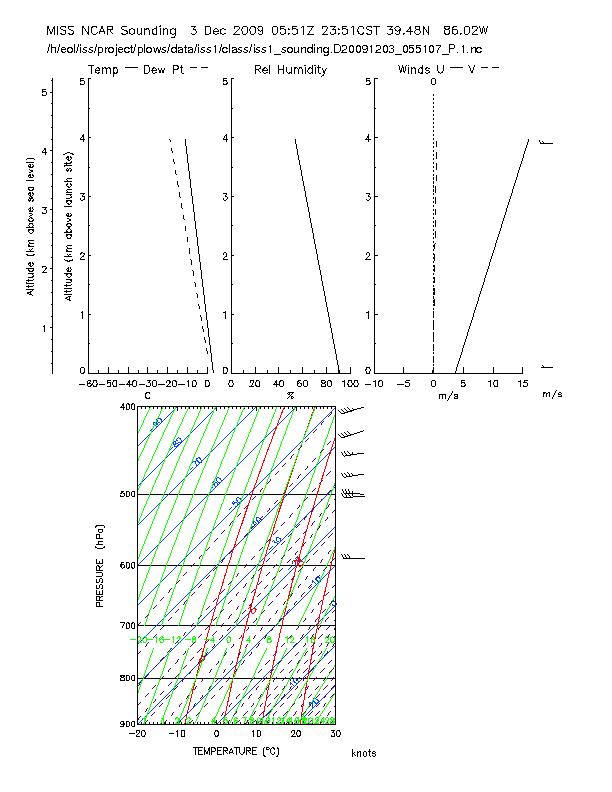
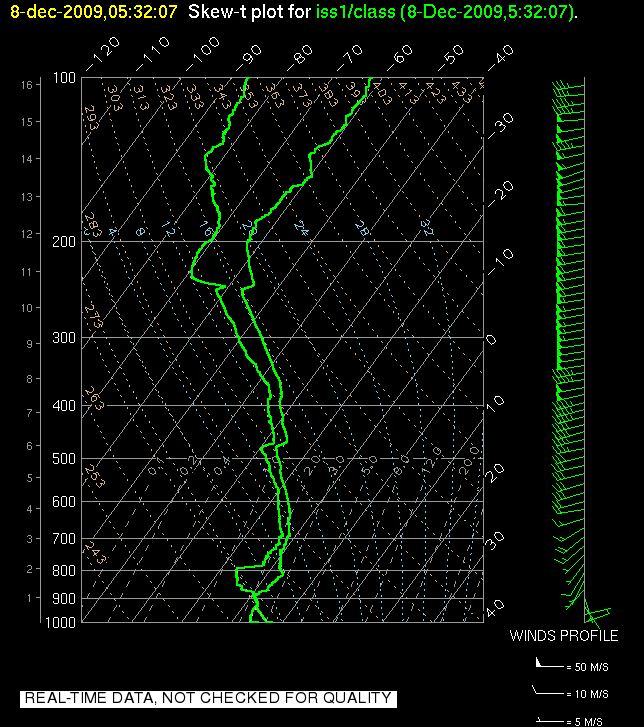
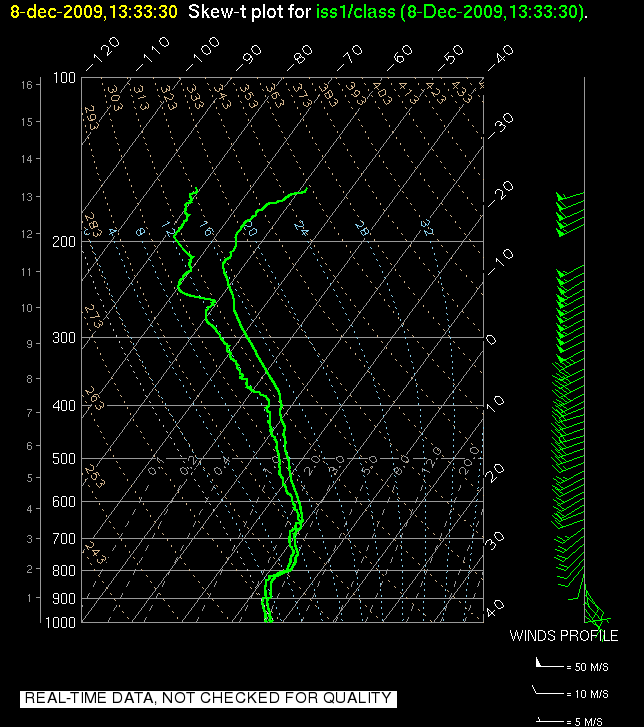
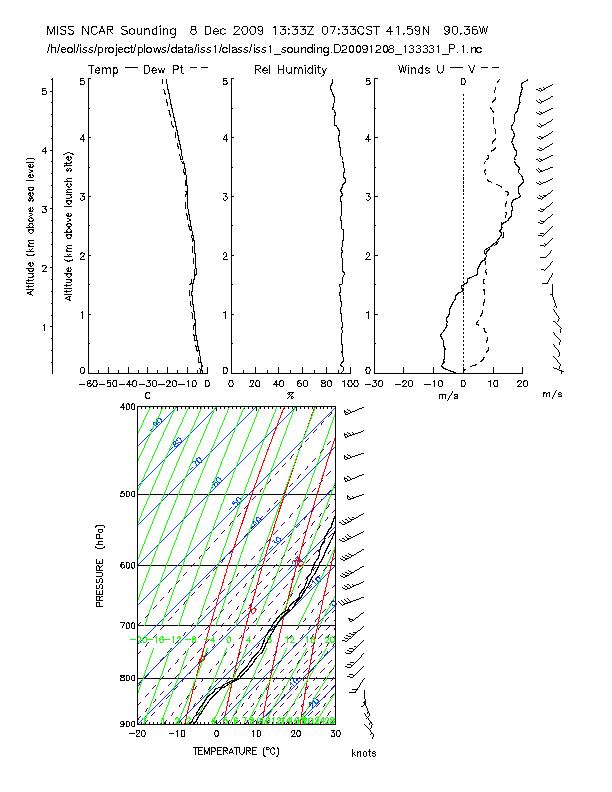
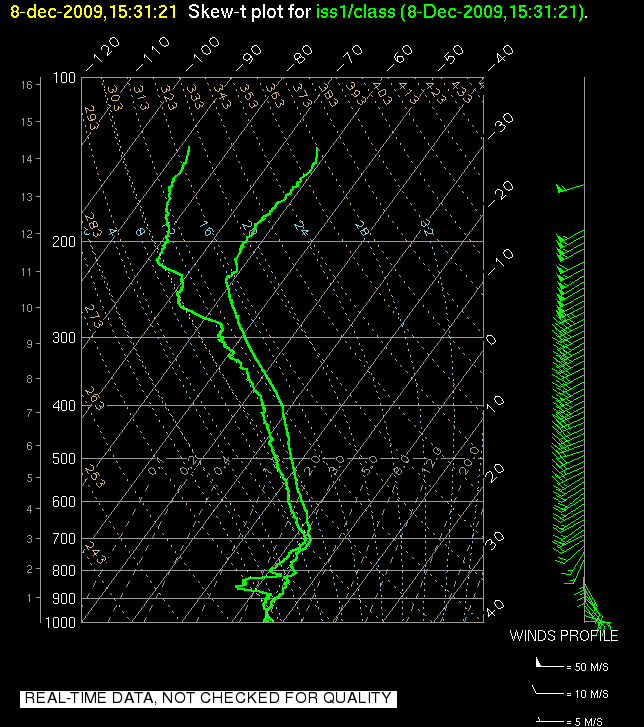
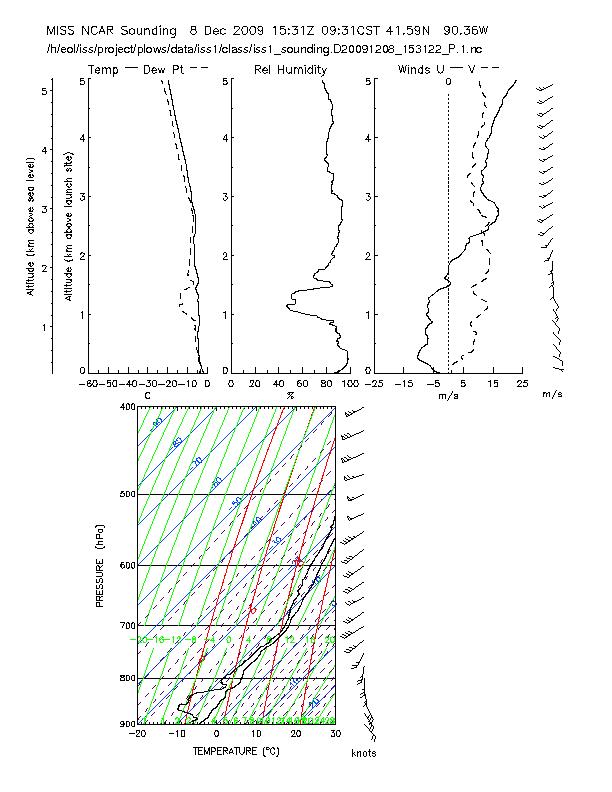
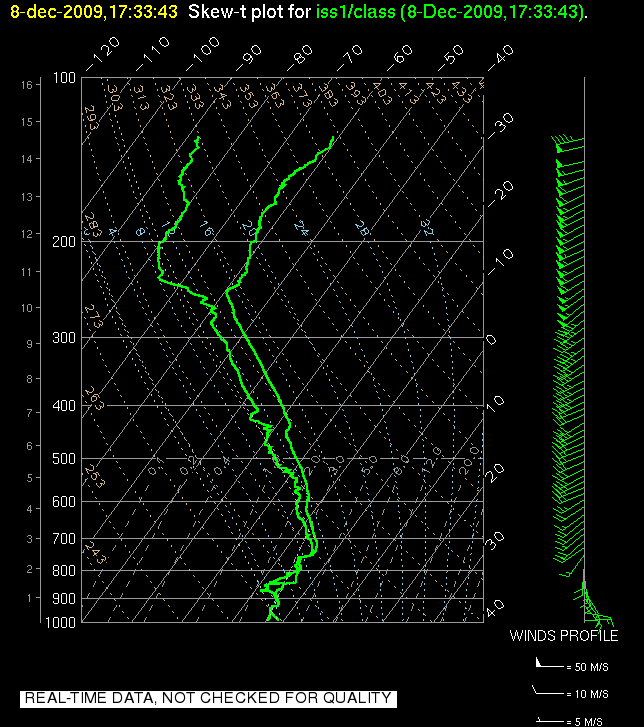
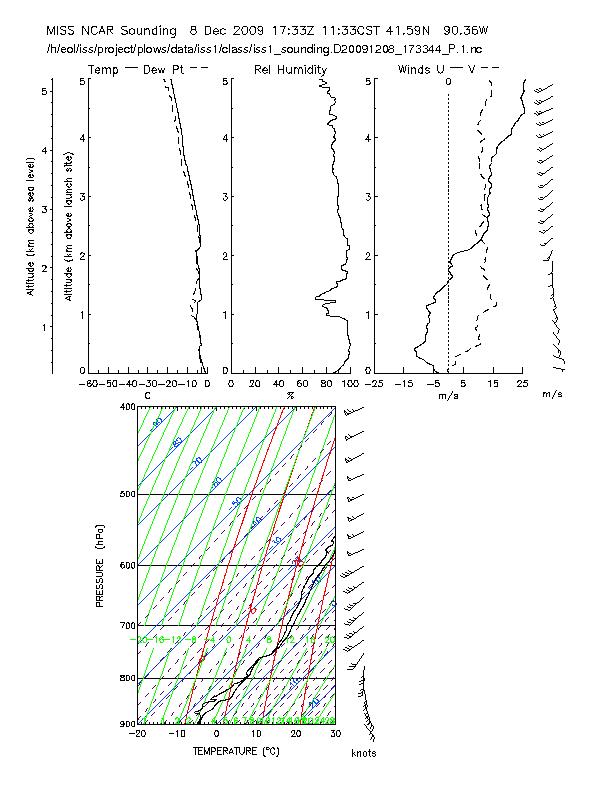
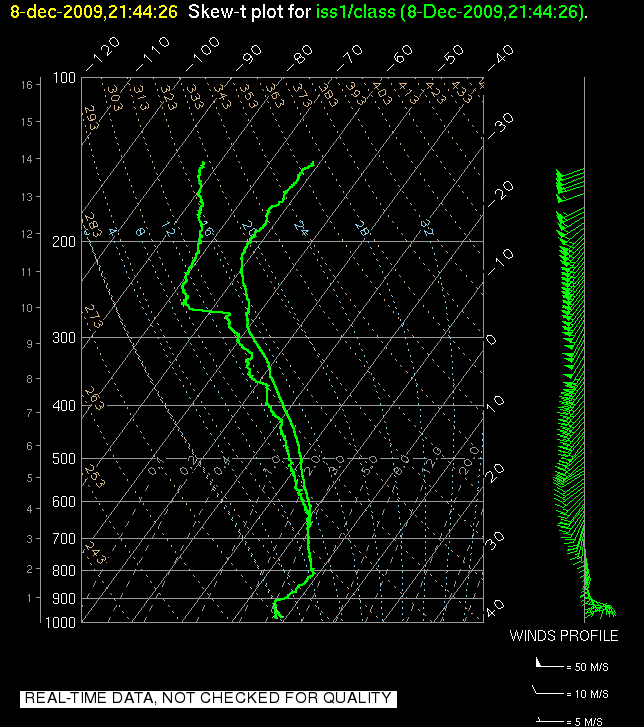
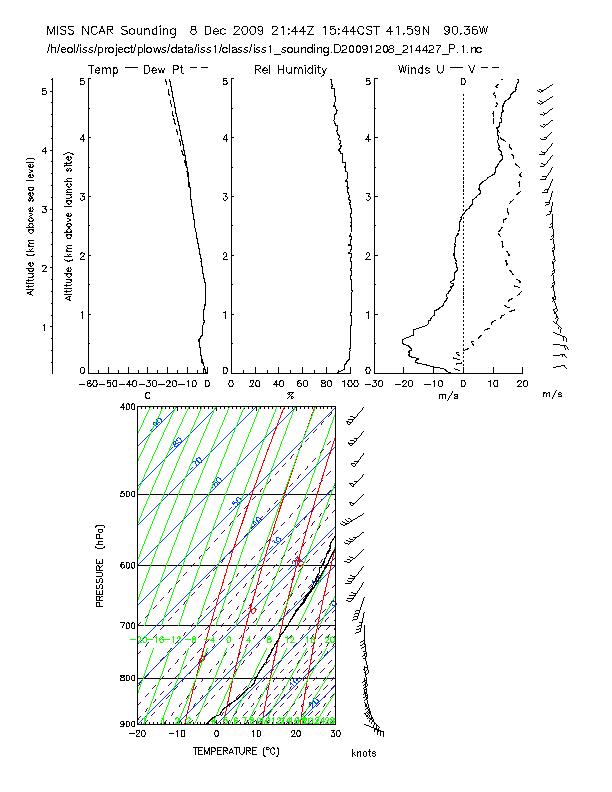
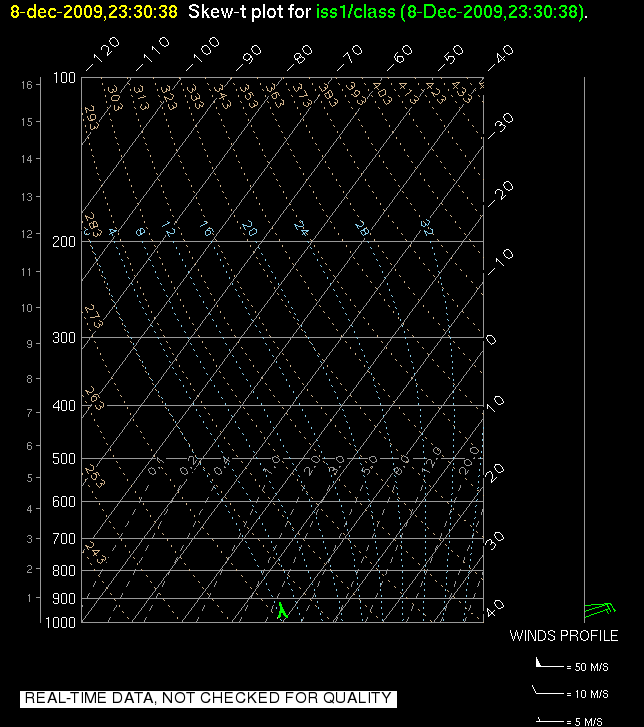
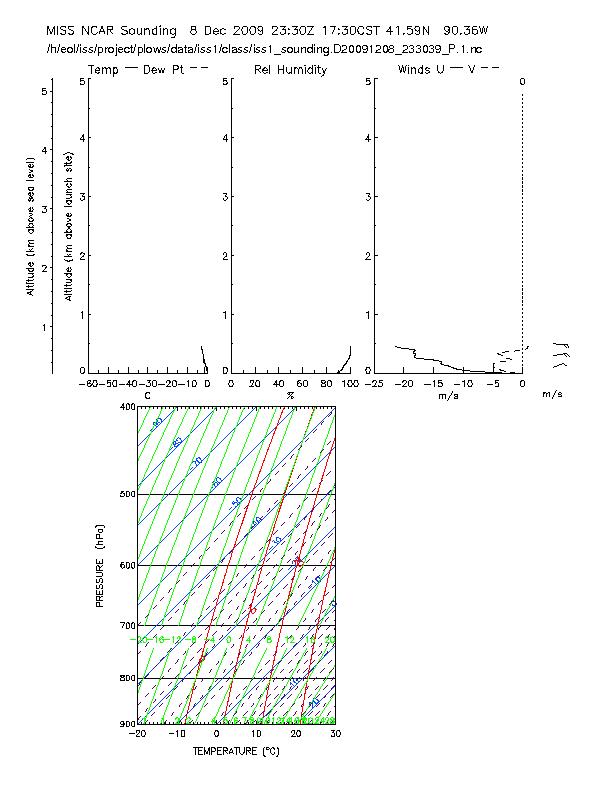
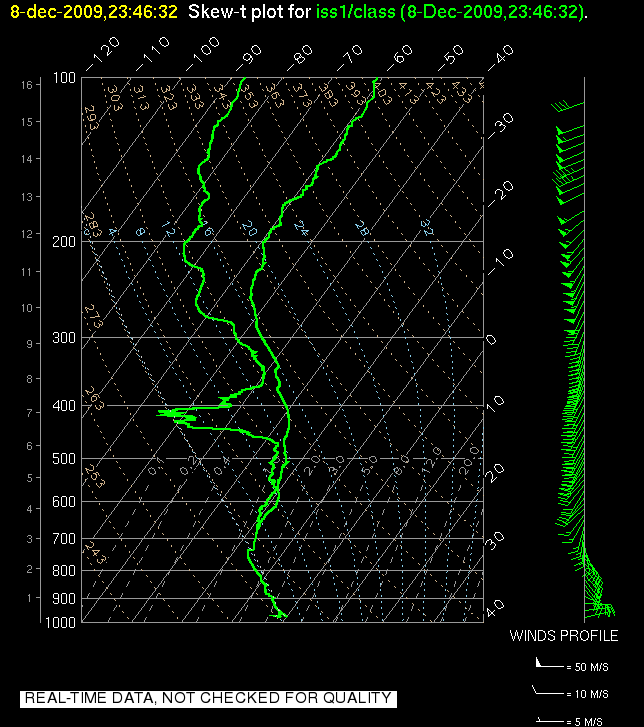
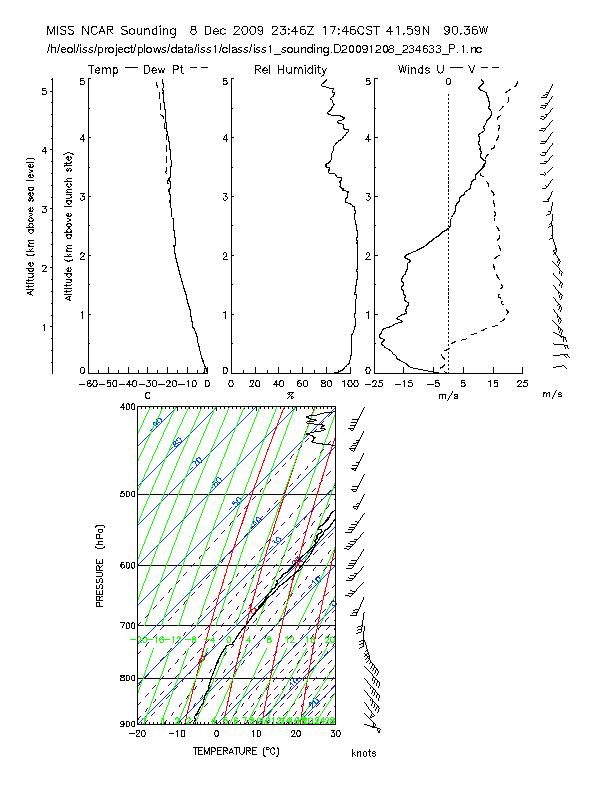
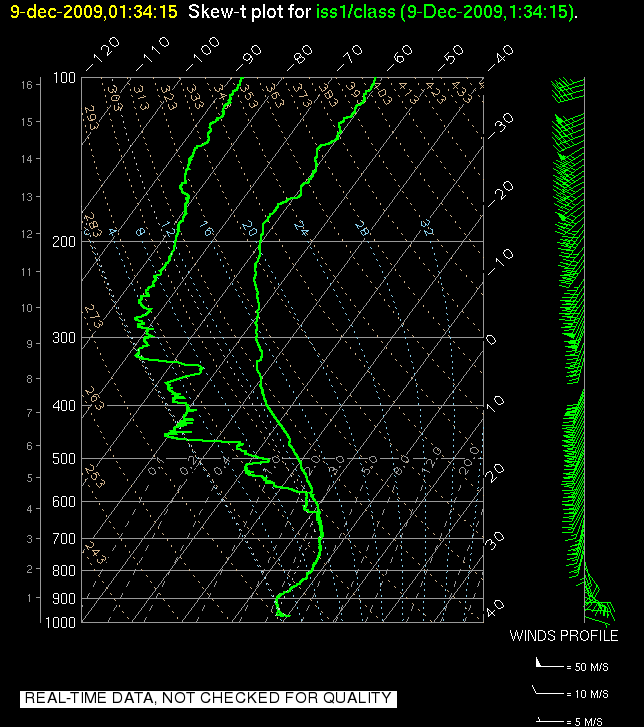
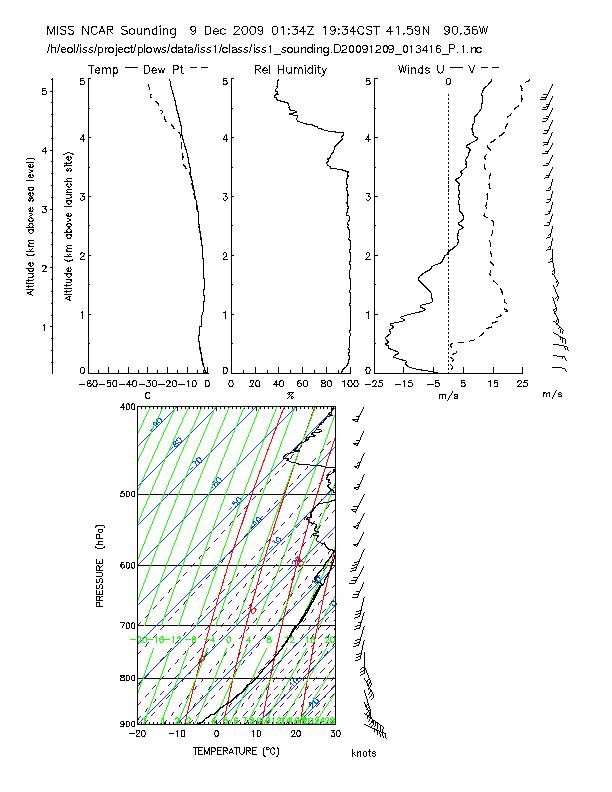
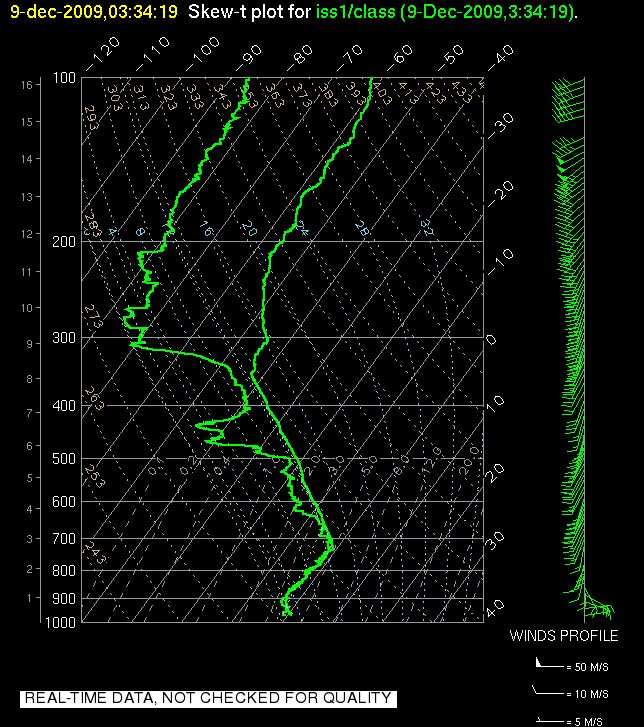
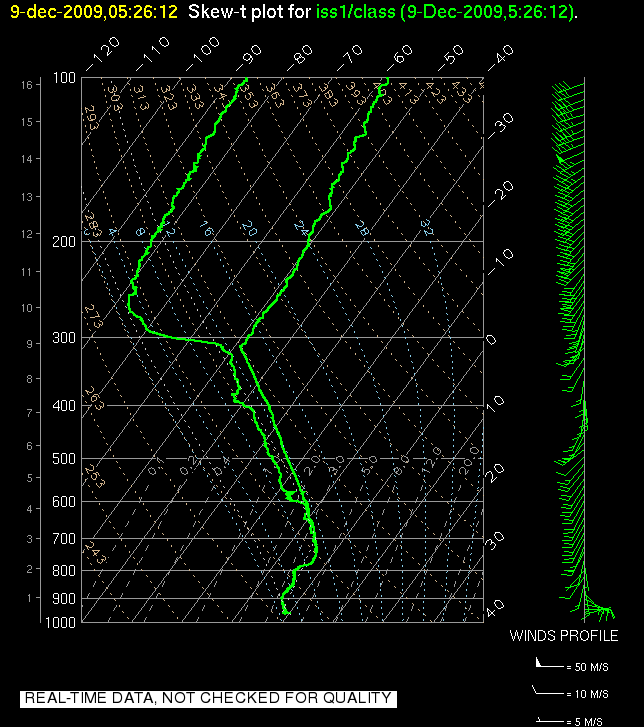
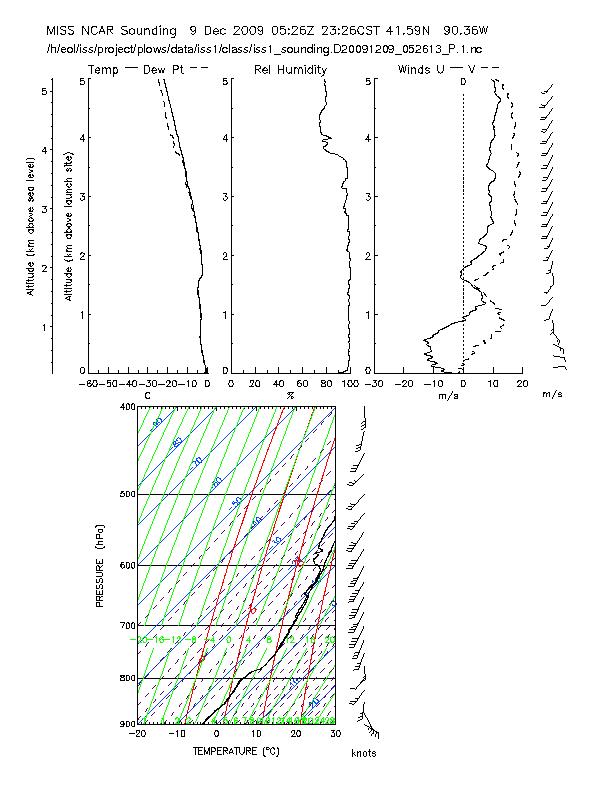
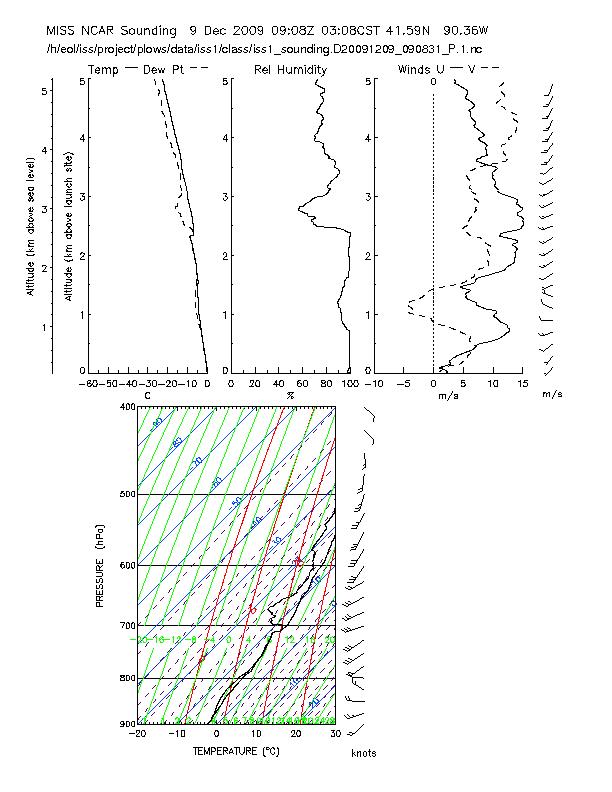
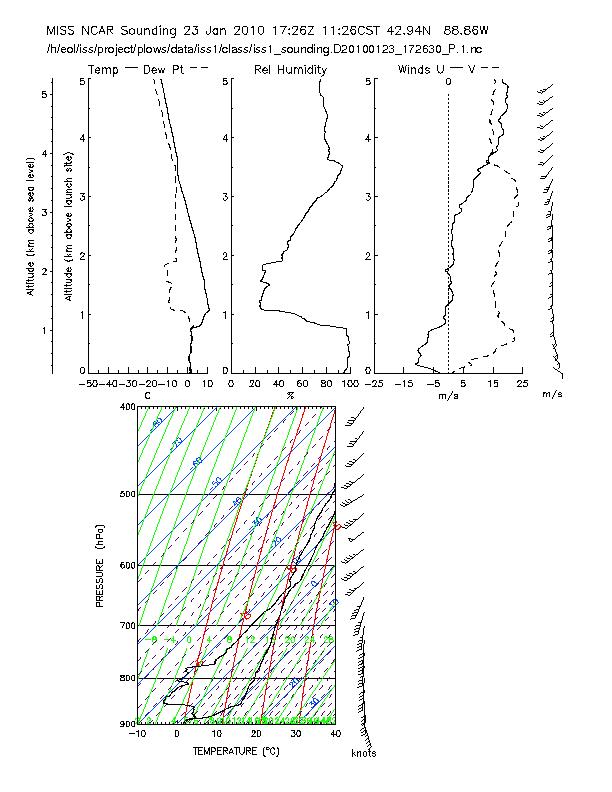
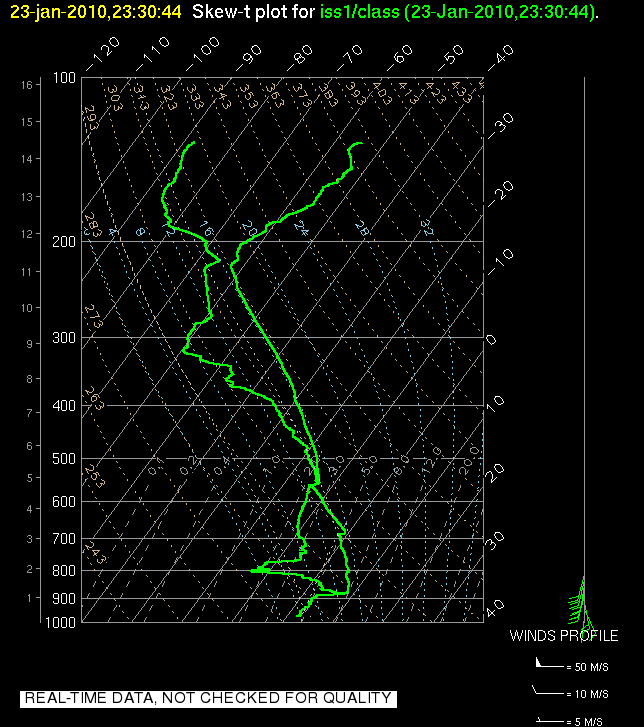
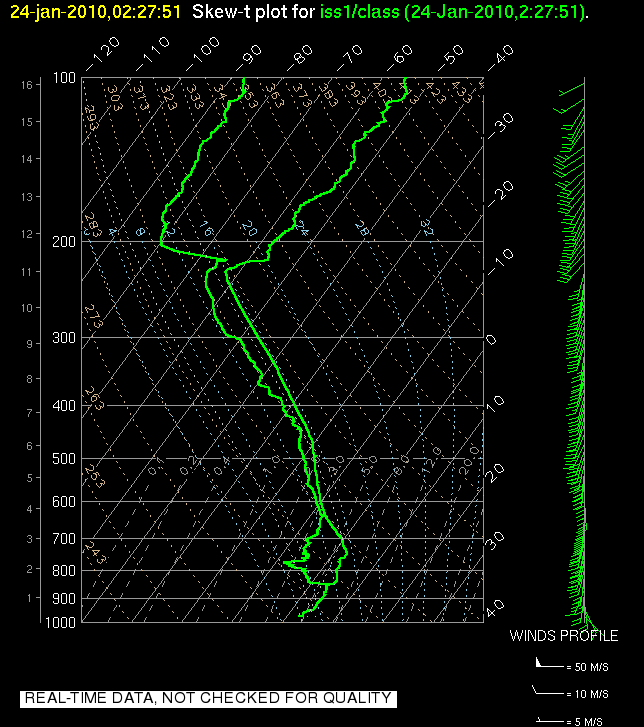
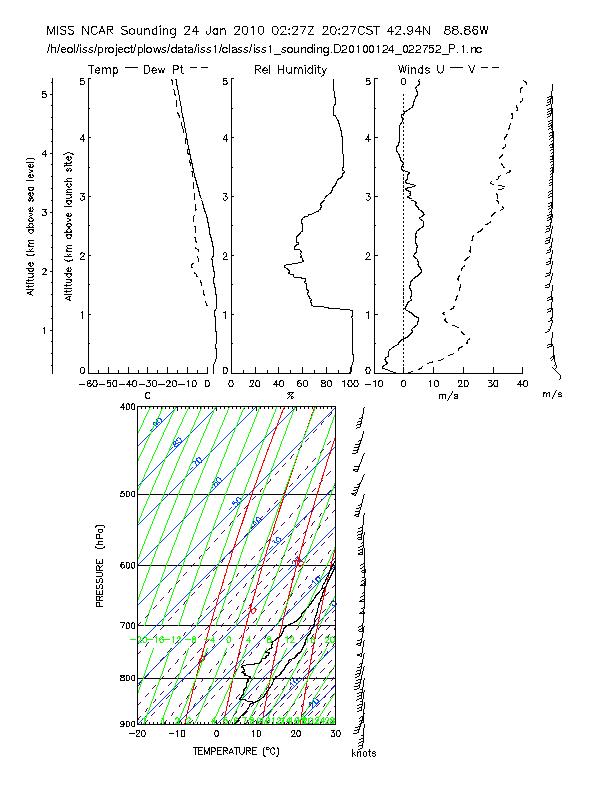
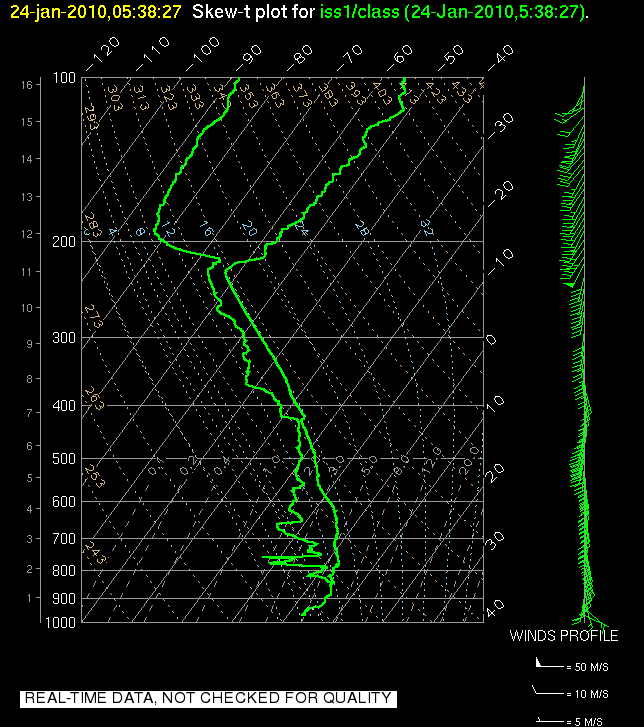
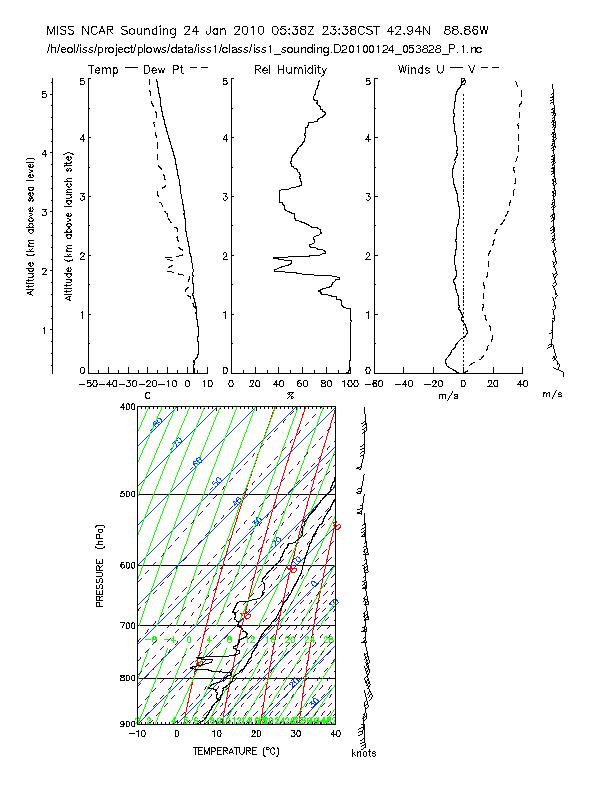
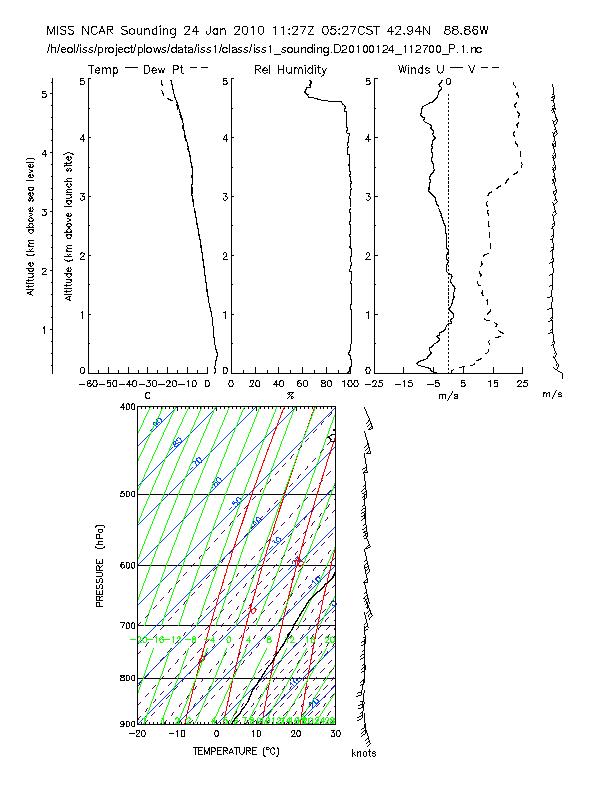
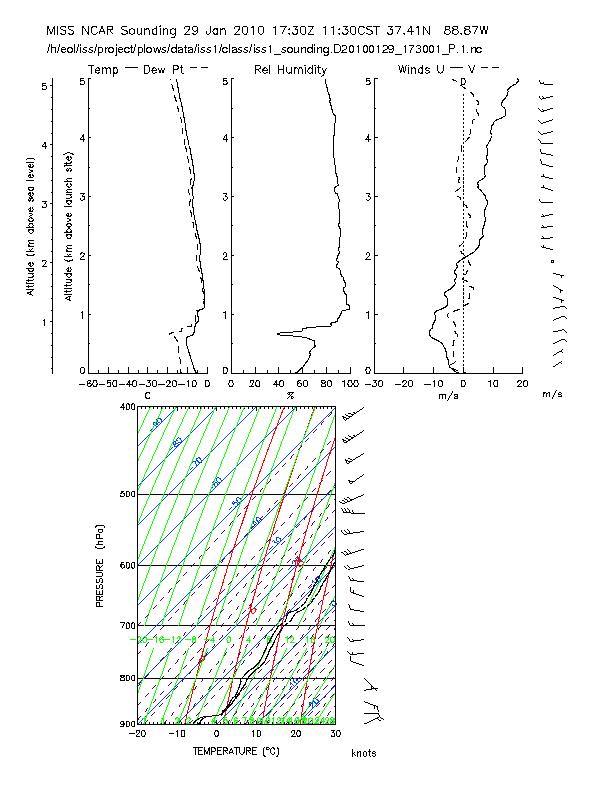
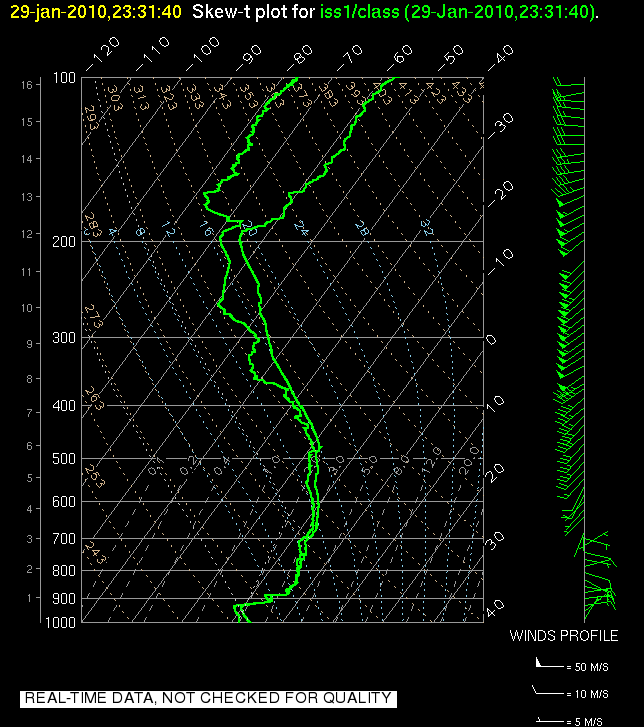
This table links to two plots for each sounding : a standard Skew-T plot (click on the "SkewT" link) and a Profile Plot in which parameters are plotted as a function of altitude up to 5 km (click on "Profile Plot").
Soundings
| MISS (PLOWS) | |
| 16-Nov-09 (day 319) |
23:44 UTC (18:44 CDT)
SkewT
/ Profile Plot
02:45 UTC (21:45 CDT) SkewT / Profile Plot 05:34 UTC (00:34 CDT) SkewT / Profile Plot 08:37 UTC (03:37 CDT) SkewT / Profile Plot 11:38 UTC (06:38 CDT) SkewT / Profile Plot |
| 17-Nov-09 (day 320) |
14:40 UTC (09:40 CDT)
SkewT
/ Profile Plot
17:35 UTC (12:35 CDT) SkewT / Profile Plot 20:26 UTC (15:26 CDT) SkewT / Profile Plot 23:34 UTC (18:34 CDT) SkewT / Profile Plot 02:43 UTC (21:43 CDT) SkewT / Profile Plot 05:33 UTC (00:33 CDT) SkewT / Profile Plot 08:28 UTC (03:28 CDT) SkewT / Profile Plot 11:32 UTC (06:32 CDT) SkewT / Profile Plot |
| 17-Nov-09 (day 321) |
14:29 UTC (09:29 CDT)
SkewT
/ Profile Plot
17:28 UTC (12:28 CDT) SkewT / Profile Plot 20:28 UTC (15:28 CDT) SkewT / Profile Plot 23:27 UTC (18:27 CDT) SkewT 23:34 UTC (18:34 CDT) SkewT / Profile Plot |
| 24-Nov-09 (day 328) |
05:19 UTC (00:19 CDT)
SkewT
08:27 UTC (03:27 CDT) SkewT 08:31 UTC (03:31 CDT) SkewT / Profile Plot 11:18 UTC (06:18 CDT) SkewT 11:30 UTC (06:30 CDT) SkewT / Profile Plot |
| 25-Nov-09 (day 328) |
14:17 UTC (09:17 CDT)
SkewT
14:26 UTC (09:26 CDT) SkewT / Profile Plot 17:23 UTC (12:23 CDT) SkewT 17:35 UTC (12:35 CDT) SkewT / Profile Plot 20:22 UTC (15:22 CDT) SkewT 20:27 UTC (15:27 CDT) SkewT / Profile Plot 23:11 UTC (18:11 CDT) SkewT 23:30 UTC (18:30 CDT) SkewT / Profile Plot 02:24 UTC (21:24 CDT) SkewT 02:30 UTC (21:30 CDT) SkewT / Profile Plot 05:30 UTC (00:30 CDT) SkewT / Profile Plot |
| 02-Dec-09 (day 336) | 11:33 UTC (06:33 CDT) SkewT / Profile Plot |
| 03-Dec-09 (day 336) |
13:34 UTC (08:34 CDT)
SkewT
/ Profile Plot
15:36 UTC (10:36 CDT) SkewT / Profile Plot 17:44 UTC (12:44 CDT) SkewT / Profile Plot 19:35 UTC (14:35 CDT) SkewT / Profile Plot 21:35 UTC (16:35 CDT) SkewT / Profile Plot 23:32 UTC (18:32 CDT) SkewT / Profile Plot 01:42 UTC (20:42 CDT) SkewT / Profile Plot 03:30 UTC (22:30 CDT) SkewT / Profile Plot 05:51 UTC (00:51 CDT) SkewT / Profile Plot |
| 08-Dec-09 (day 342) | 05:32 UTC (00:32 CDT) SkewT / Profile Plot |
| 09-Dec-09 (day 342) |
13:33 UTC (08:33 CDT)
SkewT
/ Profile Plot
15:31 UTC (10:31 CDT) SkewT / Profile Plot 17:33 UTC (12:33 CDT) SkewT / Profile Plot 19:34 UTC (14:34 CDT) SkewT / Profile Plot 21:44 UTC (16:44 CDT) SkewT / Profile Plot 23:30 UTC (18:30 CDT) SkewT / Profile Plot 23:46 UTC (18:46 CDT) SkewT / Profile Plot 01:34 UTC (20:34 CDT) SkewT / Profile Plot 03:34 UTC (22:34 CDT) SkewT / Profile Plot 05:26 UTC (00:26 CDT) SkewT / Profile Plot 09:08 UTC (04:08 CDT) SkewT / Profile Plot |
| 24-Jan-10 (day 023) |
17:26 UTC (12:26 CDT)
SkewT
/ Profile Plot
23:30 UTC (18:30 CDT) SkewT / Profile Plot 02:27 UTC (21:27 CDT) SkewT / Profile Plot 05:38 UTC (00:38 CDT) SkewT / Profile Plot 11:26 UTC (06:26 CDT) SkewT / Profile Plot |
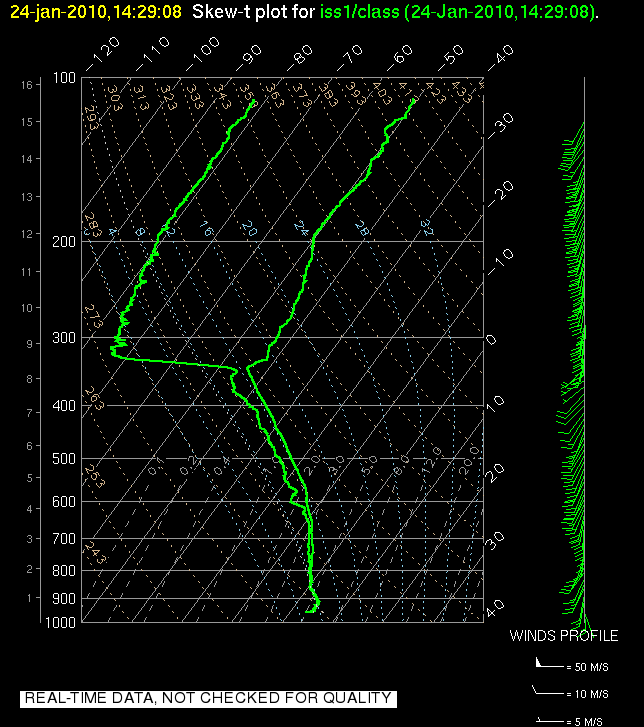
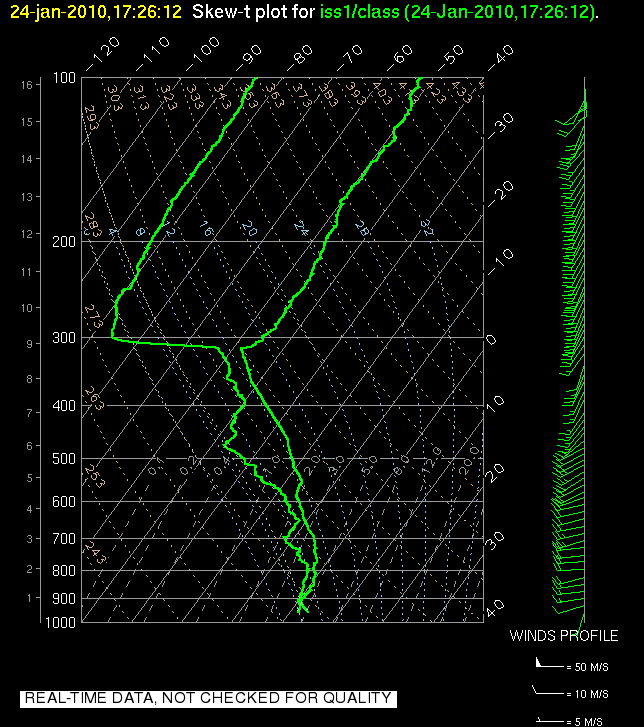
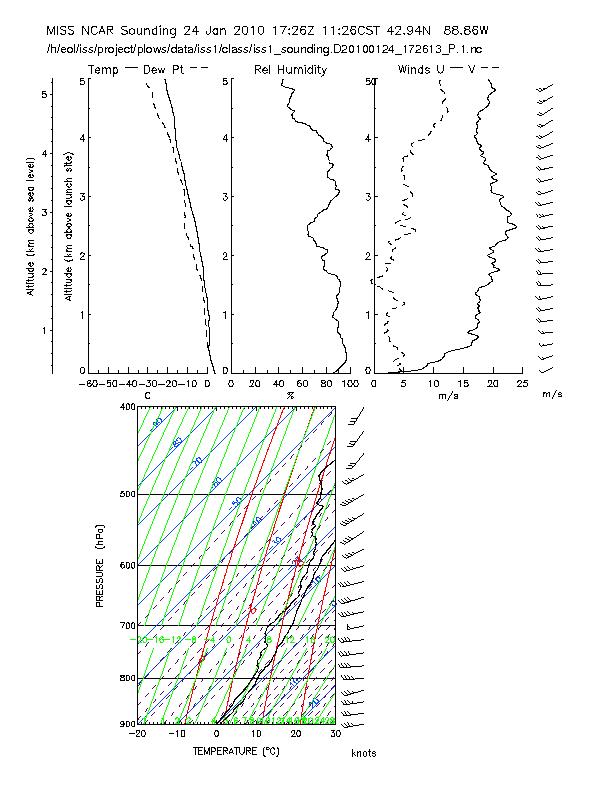
| 24-Jan-10 (day 024) |
14:29 UTC (09:29 CDT)
SkewT
/ Profile Plot
17:26 UTC (12:26 CDT) SkewT / Profile Plot |
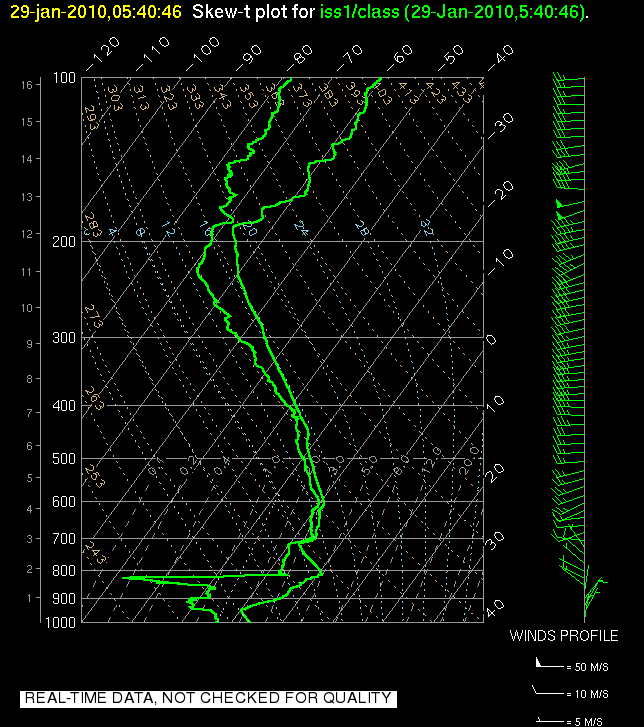
| 29-Jan-10 (day 029) |
05:40 UTC (00:40 CDT)
SkewT
/ Profile Plot
08:30 UTC (03:30 CDT) SkewT / Profile Plot 11:29 UTC (06:29 CDT) SkewT / Profile Plot |
| 29-Jan-10 (day 029) |
14:26 UTC (09:26 CDT)
SkewT
/ Profile Plot
17:30 UTC (12:30 CDT) SkewT / Profile Plot 20:22 UTC (15:22 CDT) SkewT 20:41 UTC (15:41 CDT) SkewT / Profile Plot 23:21 UTC (18:21 CDT) SkewT 23:31 UTC (18:31 CDT) SkewT / Profile Plot |
| Count n= 72 | 72 |
Plots are updated about 15 minutes past the hour after the flight is completed.
The SkewT sounding plots are also available on the : ISS Skew-T plots and PLOWS MISS data pages.