
 MM5 Convection Fields for 20020530 - Domain #1
MM5 Convection Fields for 20020530 - Domain #1
MM5 Convection Fields for 20020530 - Domain #1
Click on an image to view the full-size plot.
cape20020530_d1_09.png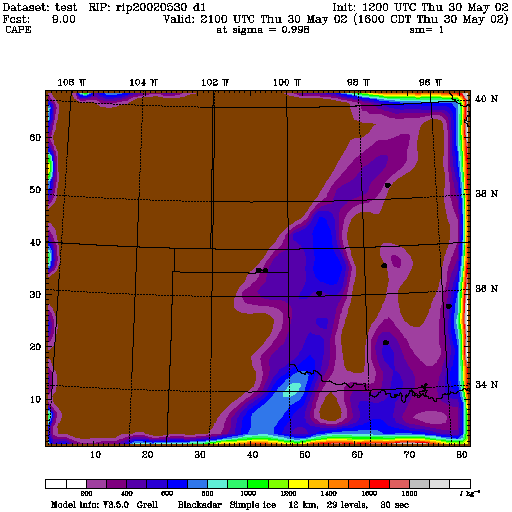
|
cin20020530_d1_09.png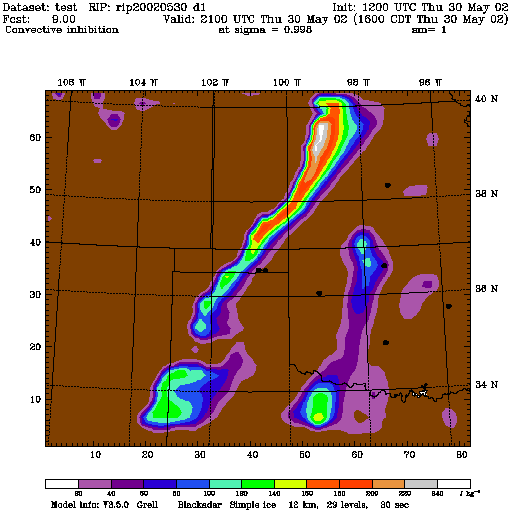
|
ept20020530_d1_09.png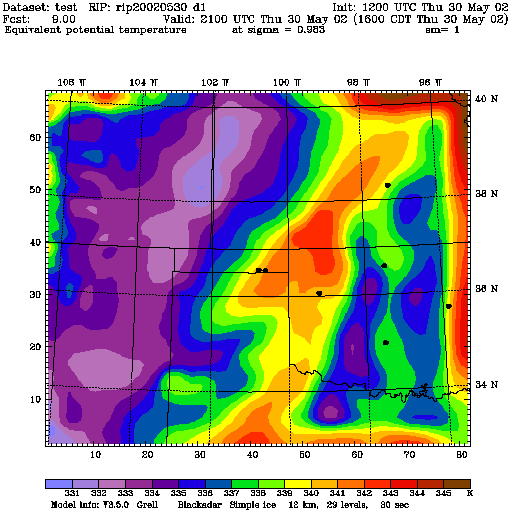
|
cape20020530_d1_10.png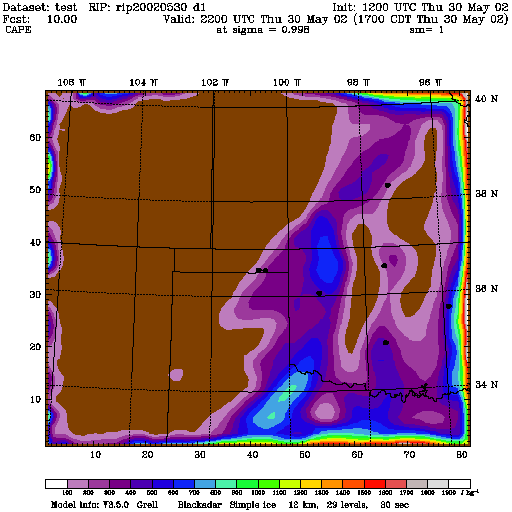
|
cin20020530_d1_10.png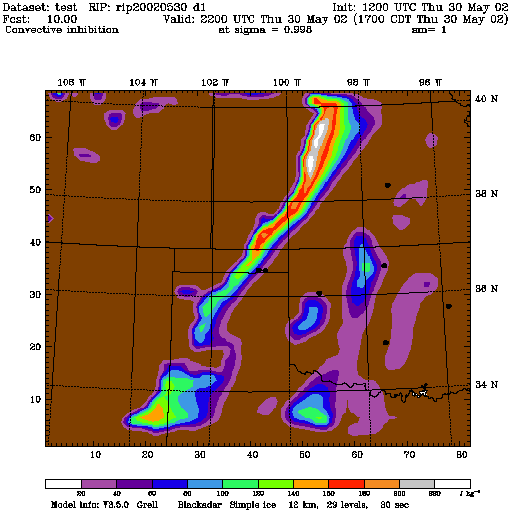
|
ept20020530_d1_10.png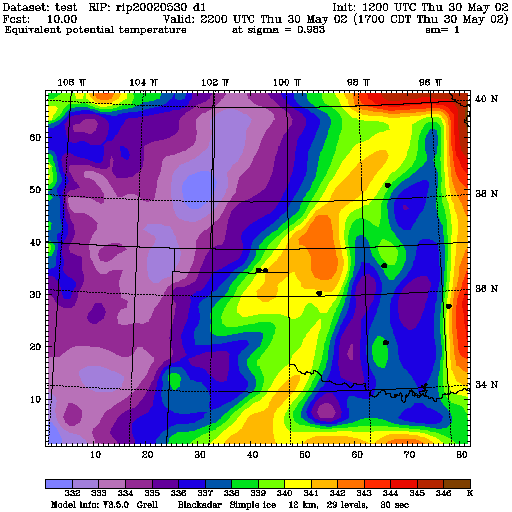
|
cape20020530_d1_11.png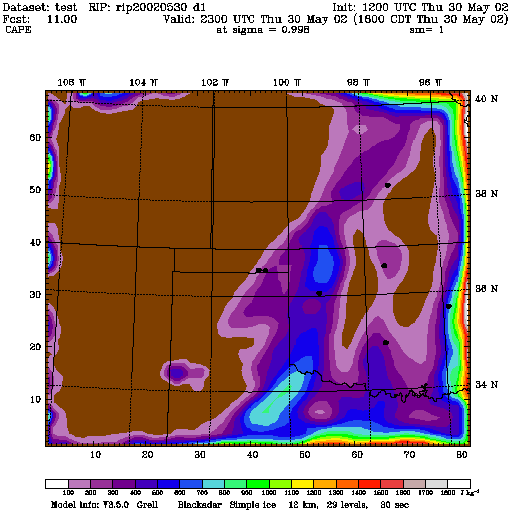
|
cin20020530_d1_11.png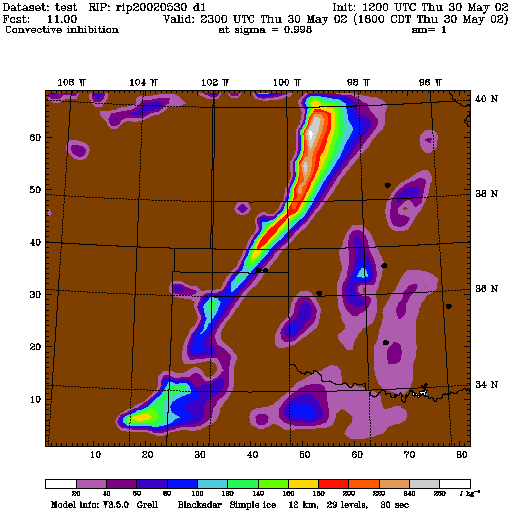
|
ept20020530_d1_11.png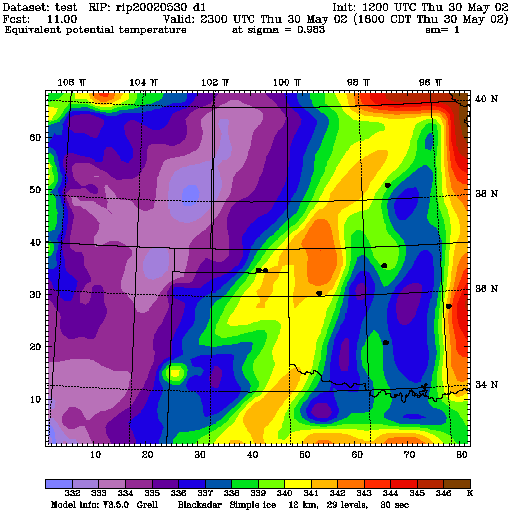
|
cape20020530_d1_12.png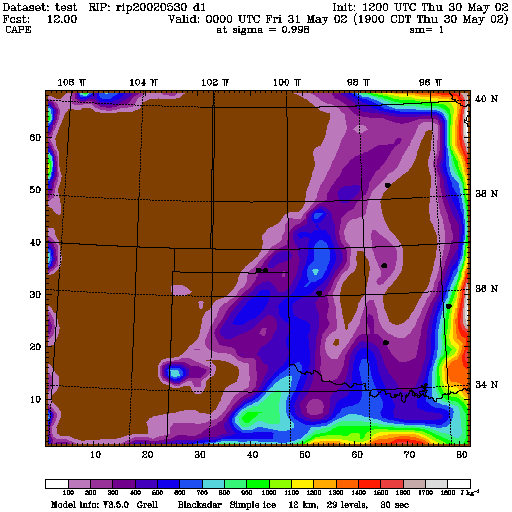
|
cin20020530_d1_12.png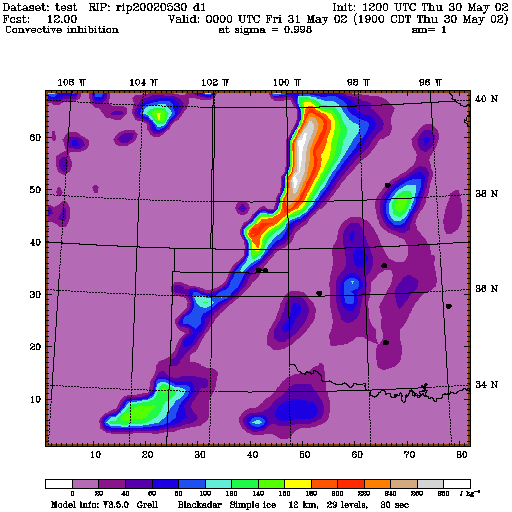
|
ept20020530_d1_12.png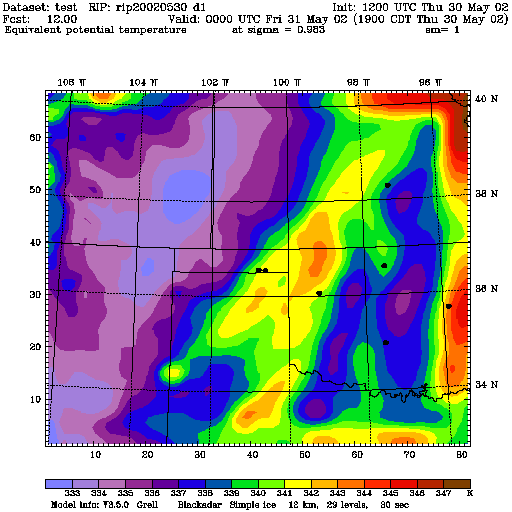
|
cape20020530_d1_13.png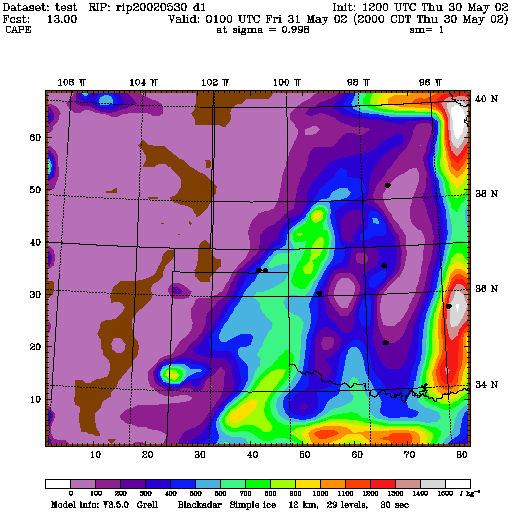
|
cin20020530_d1_13.png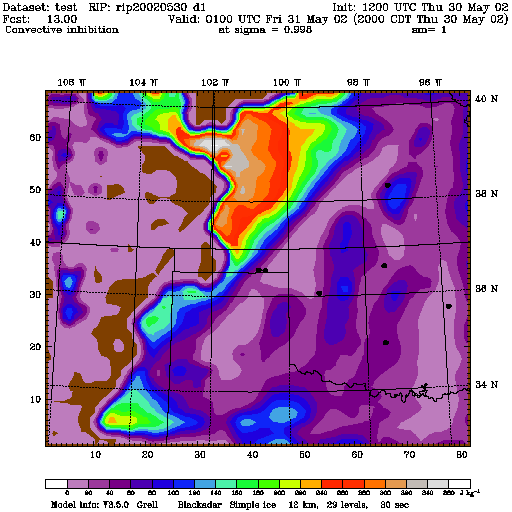
|
ept20020530_d1_13.png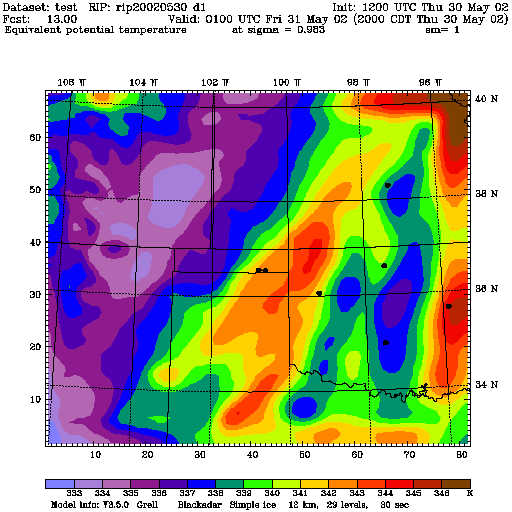
|
cape20020530_d1_14.png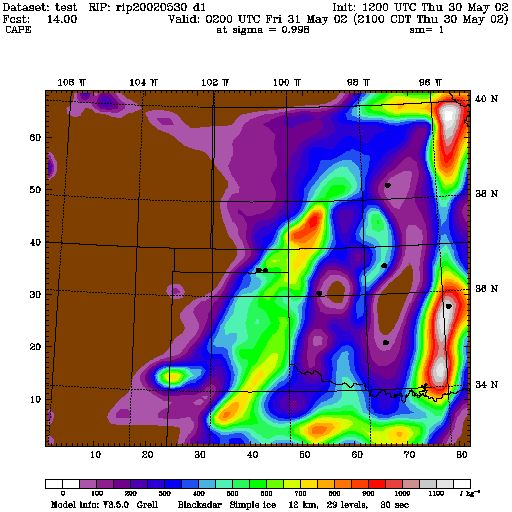
|
cin20020530_d1_14.png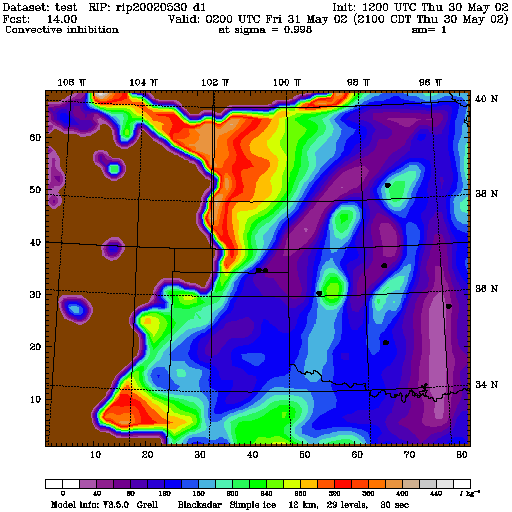
|
ept20020530_d1_14.png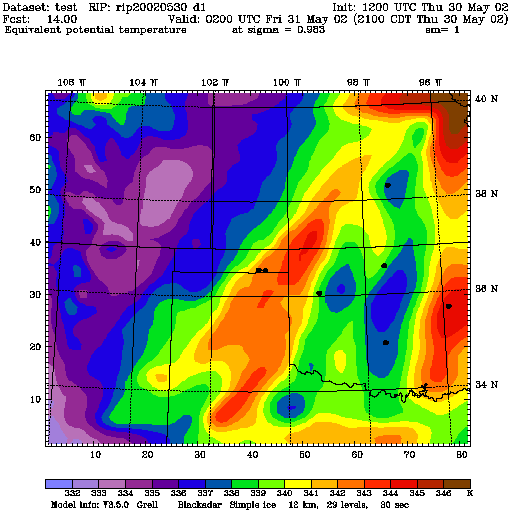
|
cape20020530_d1_15.png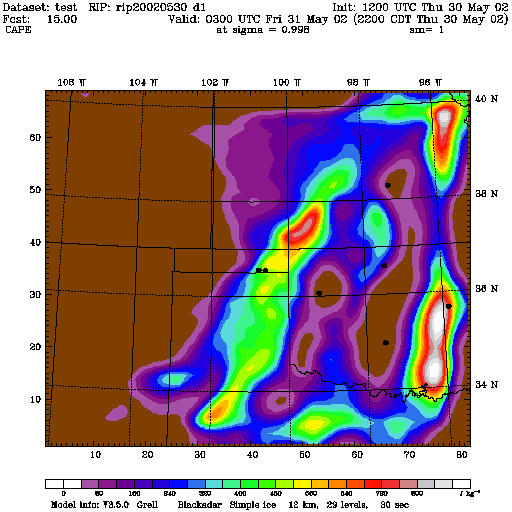
|
cin20020530_d1_15.png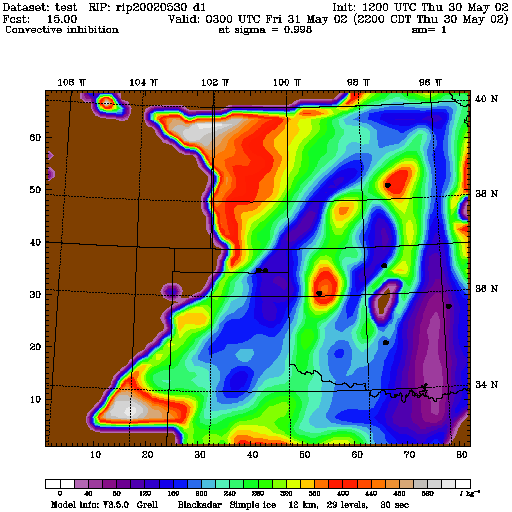
|
ept20020530_d1_15.png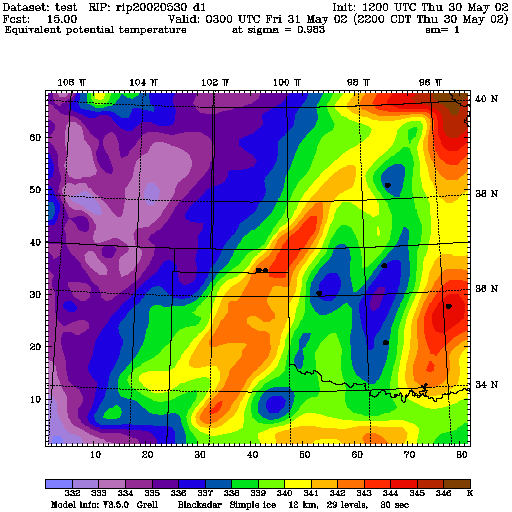
|
Created Thu May 30 19:16:46 MDT 2002