
 MM5 Horizontal Plots for 20020516 - Domain #3
MM5 Horizontal Plots for 20020516 - Domain #3
MM5 Horizontal Plots for 20020516 - Domain #3
Click on an image to view the full-size plot.
tclw_vec20020516_d3_09.png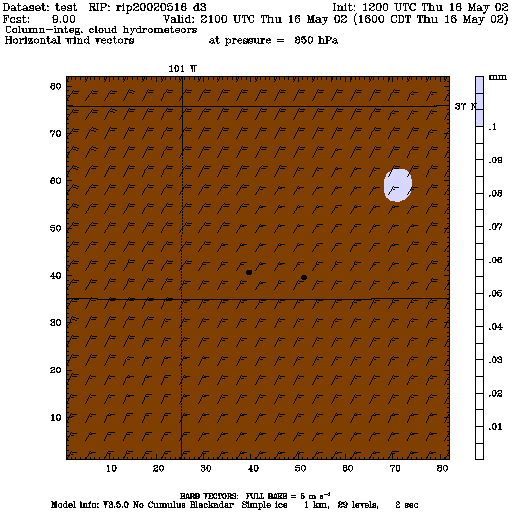
|
pcp20020516_d3_09.png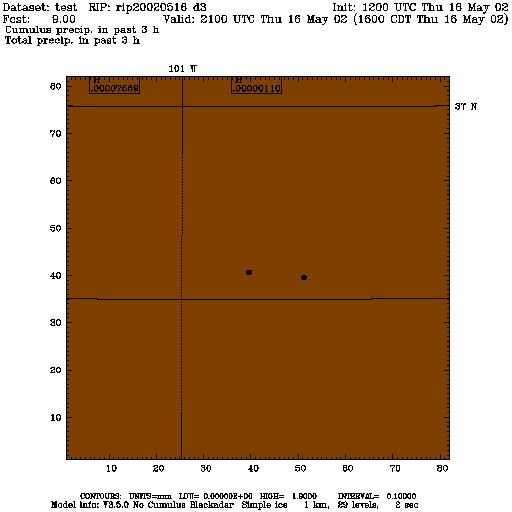
|
tclw_vec20020516_d3_10.png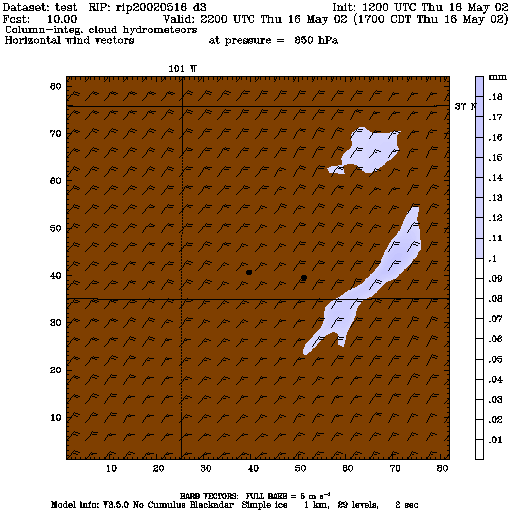
|
pcp20020516_d3_10.png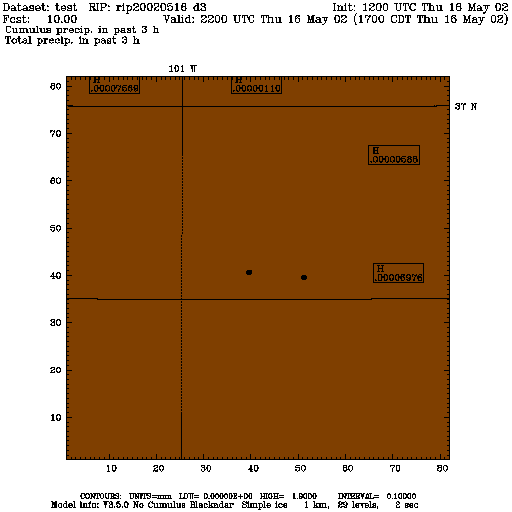
|
tclw_vec20020516_d3_11.png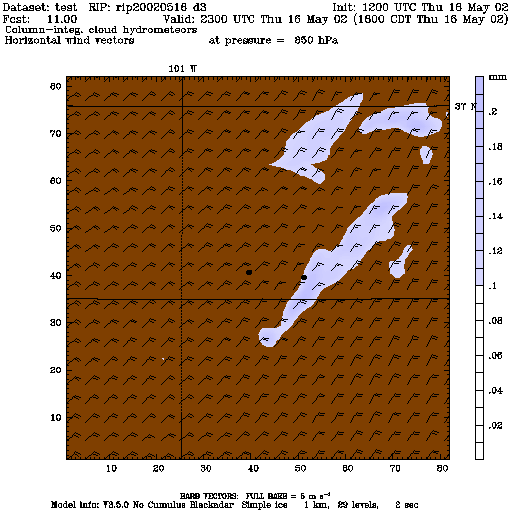
|
pcp20020516_d3_11.png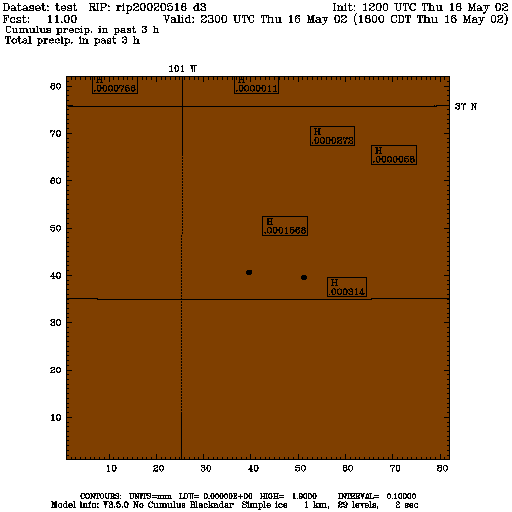
|
tclw_vec20020516_d3_12.png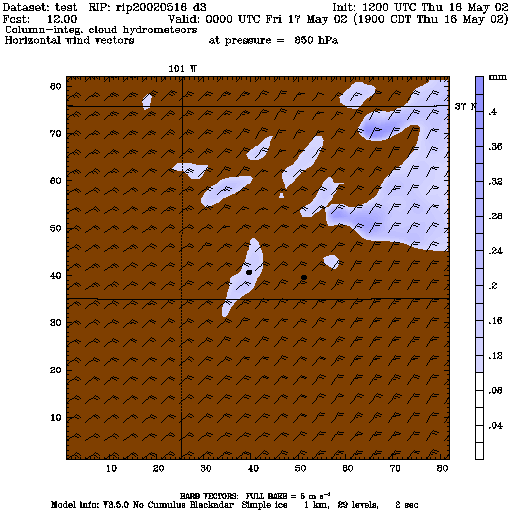
|
pcp20020516_d3_12.png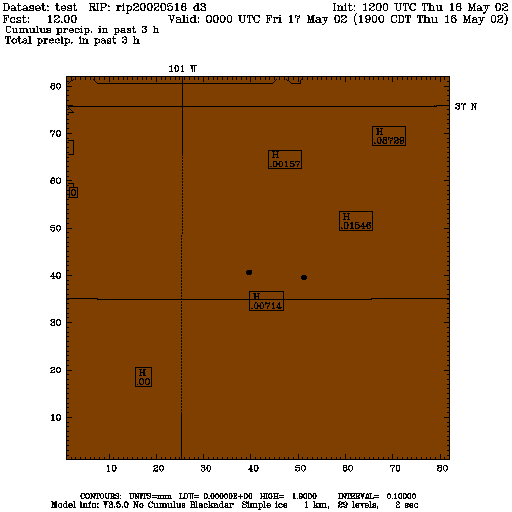
|
tclw_vec20020516_d3_13.png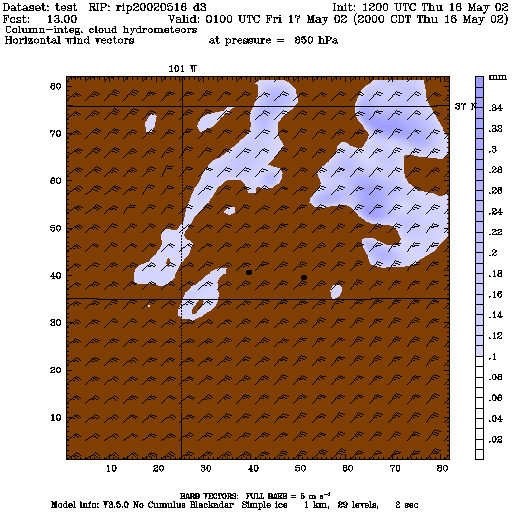
|
pcp20020516_d3_13.png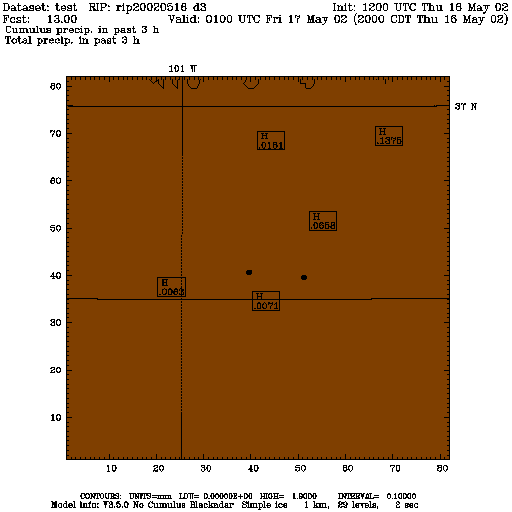
|
tclw_vec20020516_d3_14.png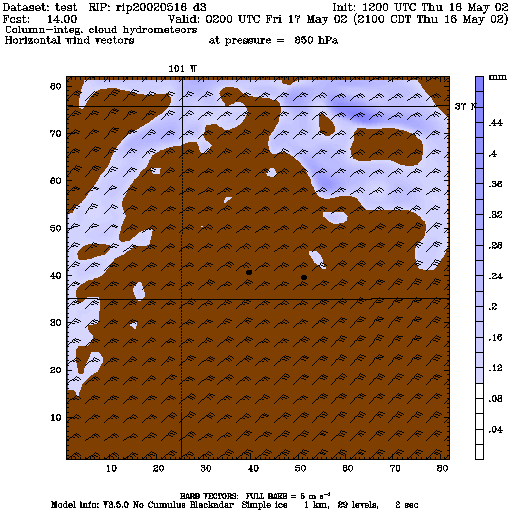
|
pcp20020516_d3_14.png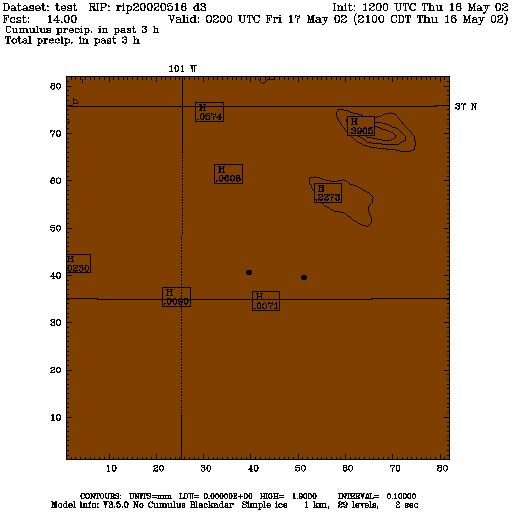
|
tclw_vec20020516_d3_15.png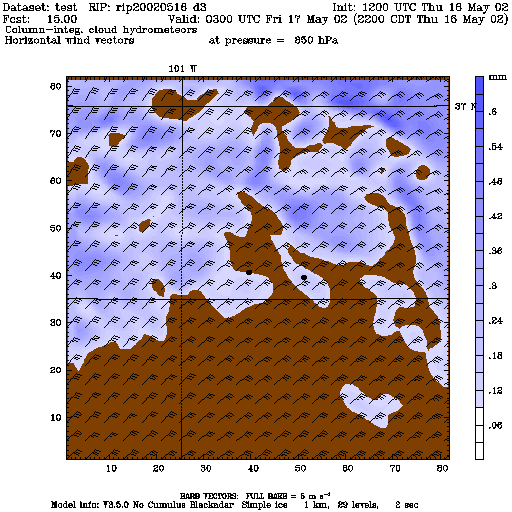
|
pcp20020516_d3_15.png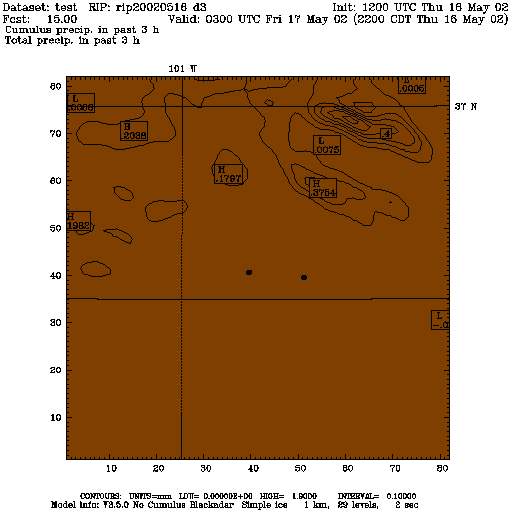
|
Created Fri May 17 11:29:26 MDT 2002