
 MM5 Time-Height Plots for 20020514
MM5 Time-Height Plots for 20020514
MM5 Time-Height Plots for 20020514
Click on an image to view the full-size plot.
| SPOL | ||||
|---|---|---|---|---|
spol_tht_tt20020514_12.png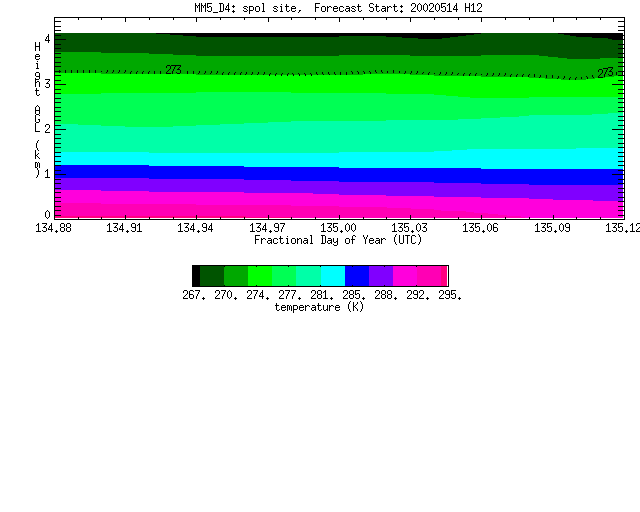
|
spol_tht_qv20020514_12.png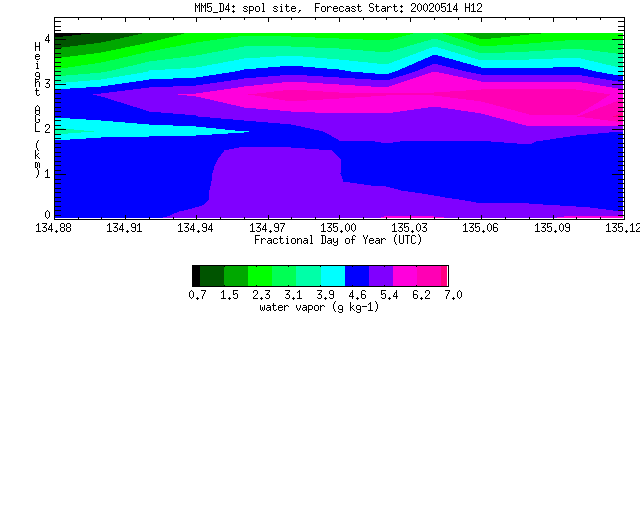
|
spol_tht_rh20020514_12.png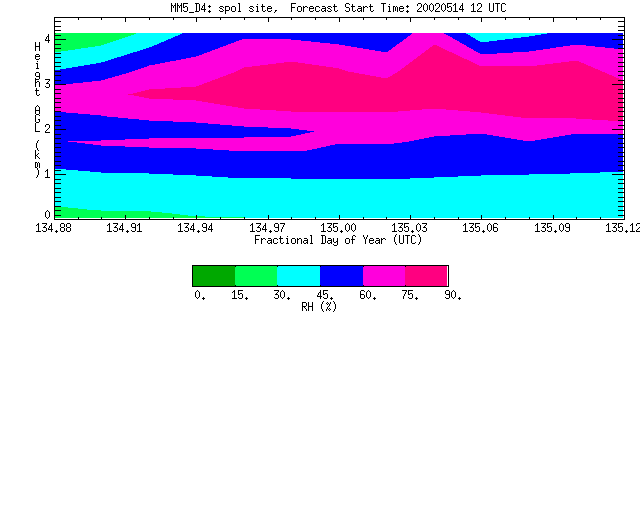
|
spol_tht_uu20020514_12.png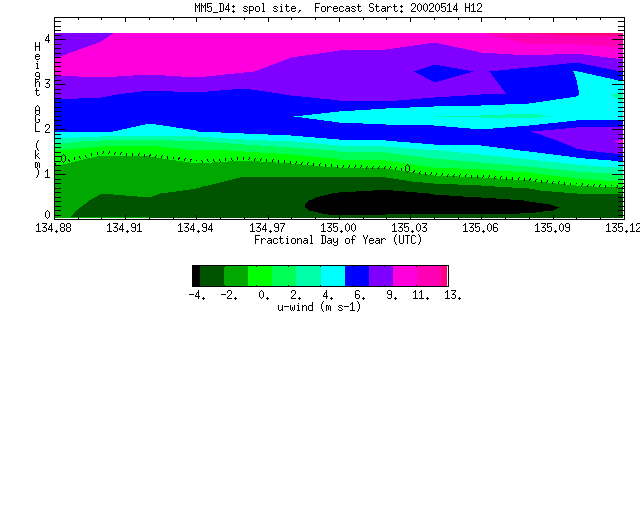
|
|
spol_tht_vv20020514_12.png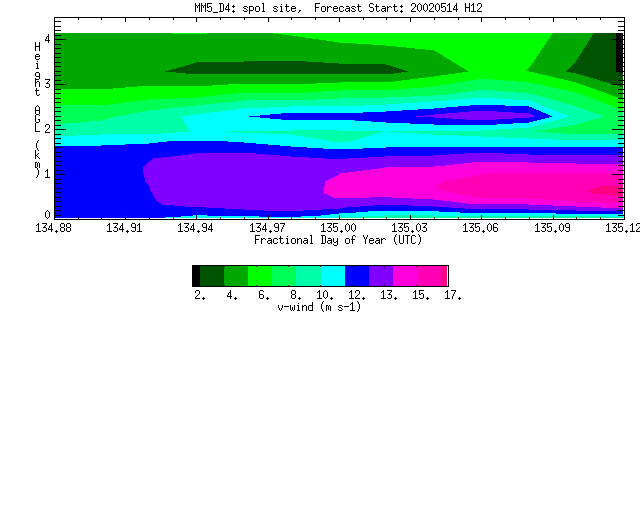
|
spol_tht_ww20020514_12.png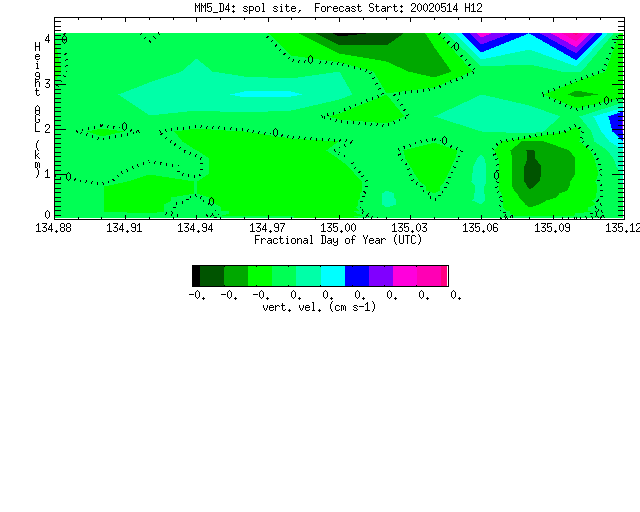
|
spol_tht_vec20020514_12.png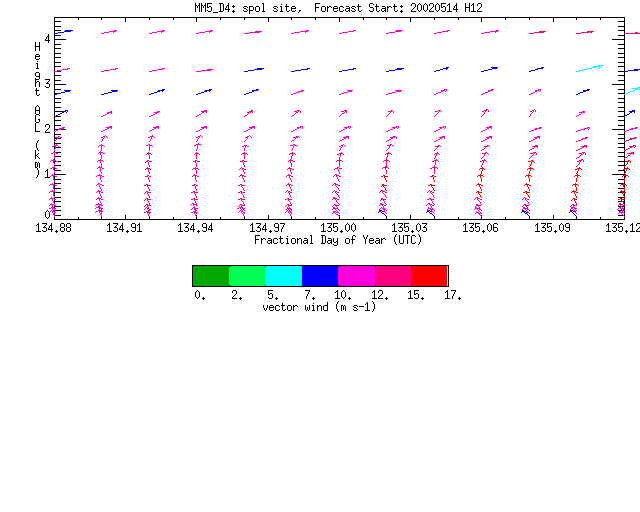
|
spol_tht_clw20020514_12.png
|
|
spol_tht_snw20020514_12.png
|
spol_tht_wpth20020514_12.png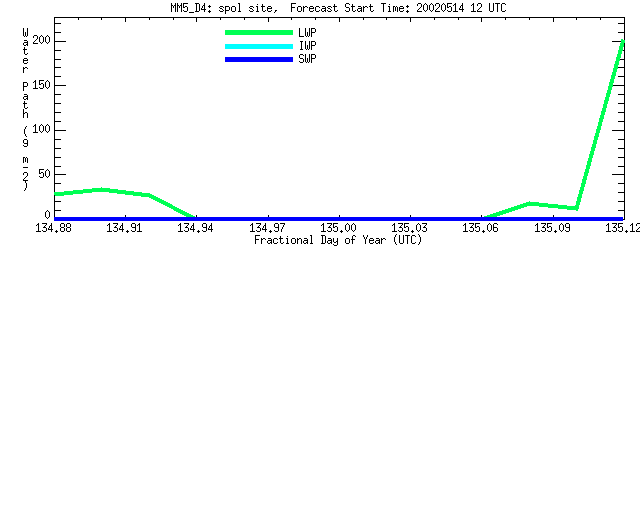
|
|||
| Homestead | ||||
hills_tht_tt20020514_12.png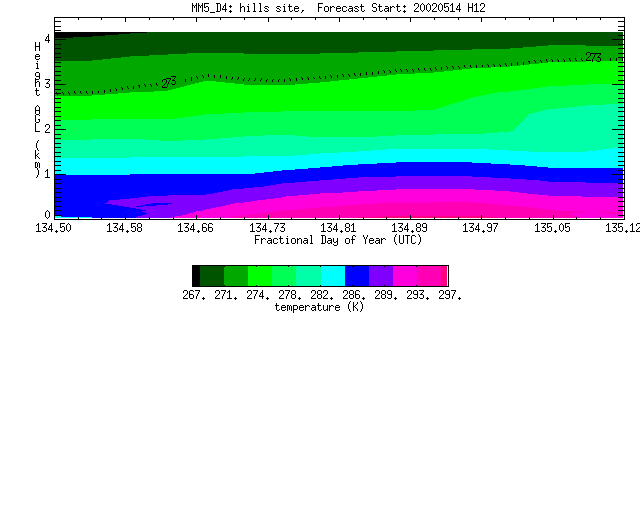
|
hills_tht_qv20020514_12.png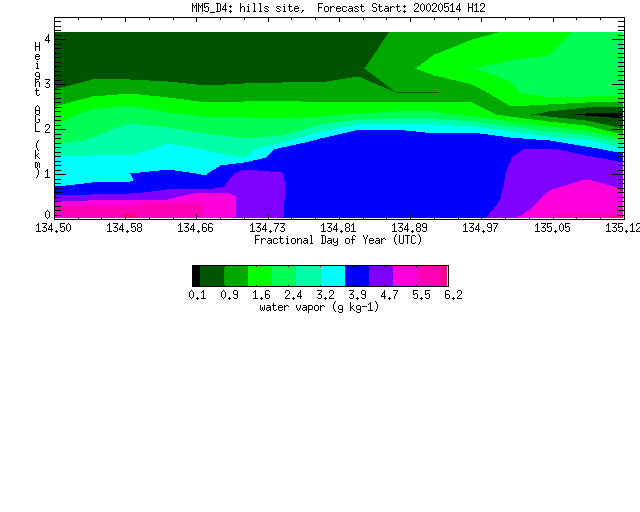
|
hills_tht_rh20020514_12.png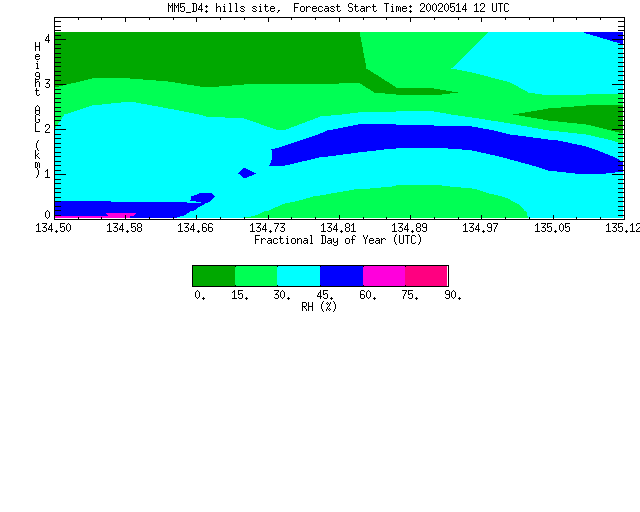
|
hills_tht_uu20020514_12.png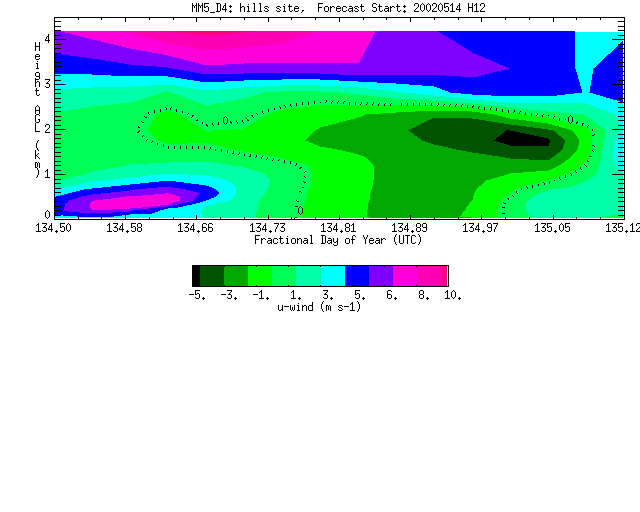
|
|
hills_tht_vv20020514_12.png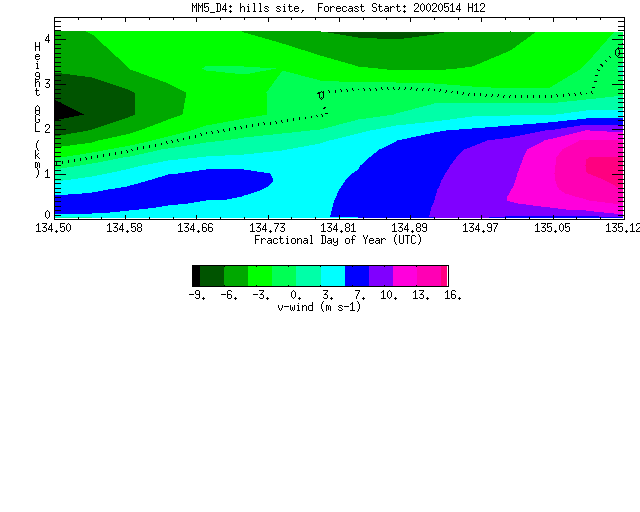
|
hills_tht_ww20020514_12.png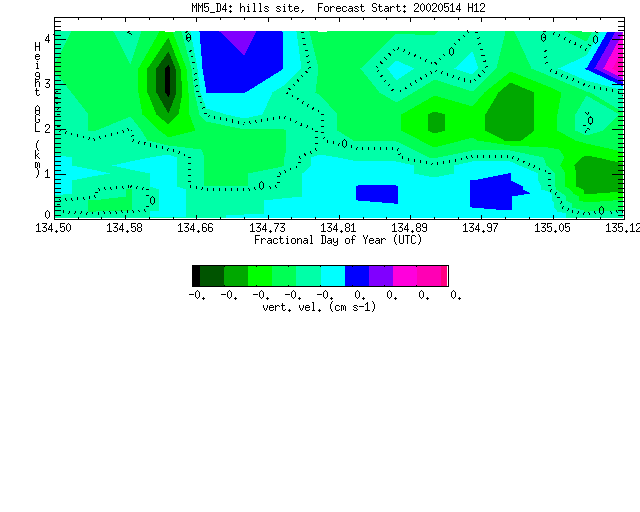
|
hills_tht_vec20020514_12.png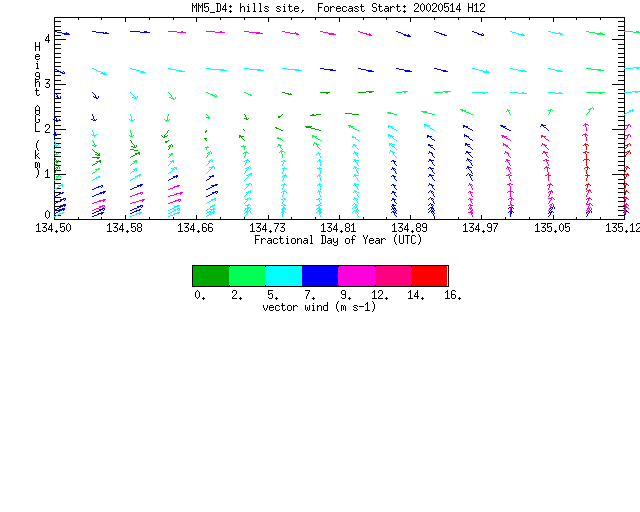
|
hills_tht_clw20020514_12.png
|
|
hills_tht_snw20020514_12.png
|
hills_tht_wpth20020514_12.png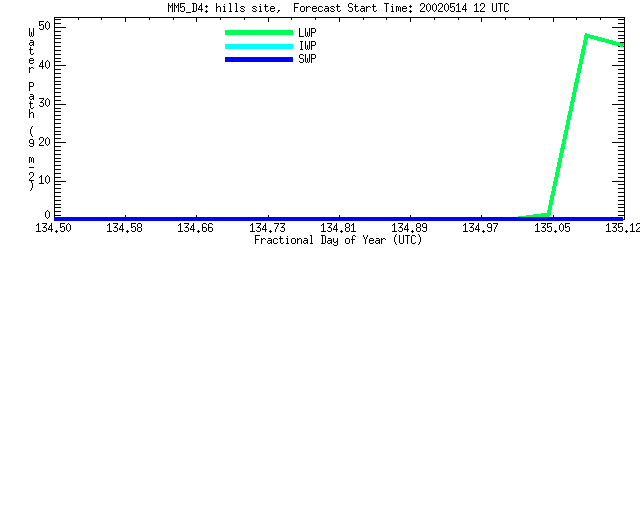
|
|||
Created Wed May 15 17:42:55 MDT 2002