
If you reached this page from a search engine, click here to see the full report, with frames.
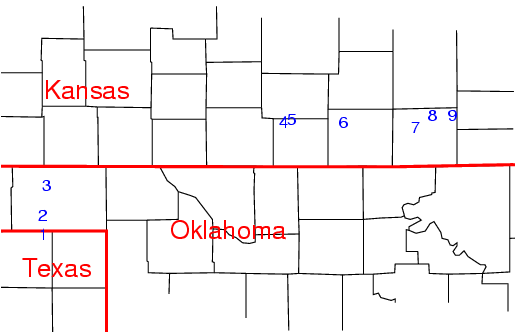
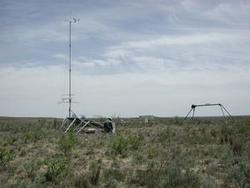
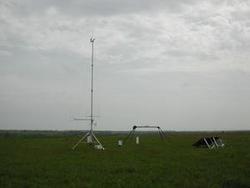
Stations 1-3, comprising the West leg, were aligned south to north in the Oklahoma panhandle.
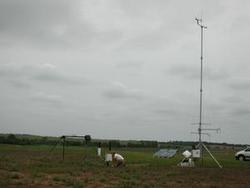
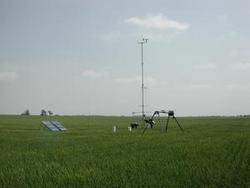
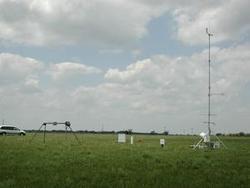
Stations 4-6, comprising the Central leg, were aligned roughly west to east, southwest of Wichita, Kansas.
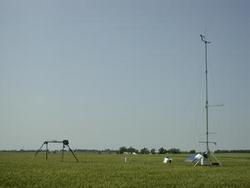
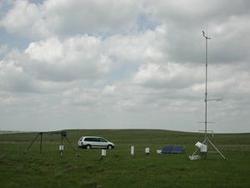
Stations 7-9, comprising the East leg, were aligned roughly west to east, southeast of Wichita.
 Station 1 Station 1
|  Station 2 Station 2
|  Station 3 Station 3
|
 Station 4 Station 4
|  Station 5 Station 5
|  Station 6 Station 6
|
 Station 7 Station 7
|  Station 8 Station 8
|  Station 9 Station 9
|
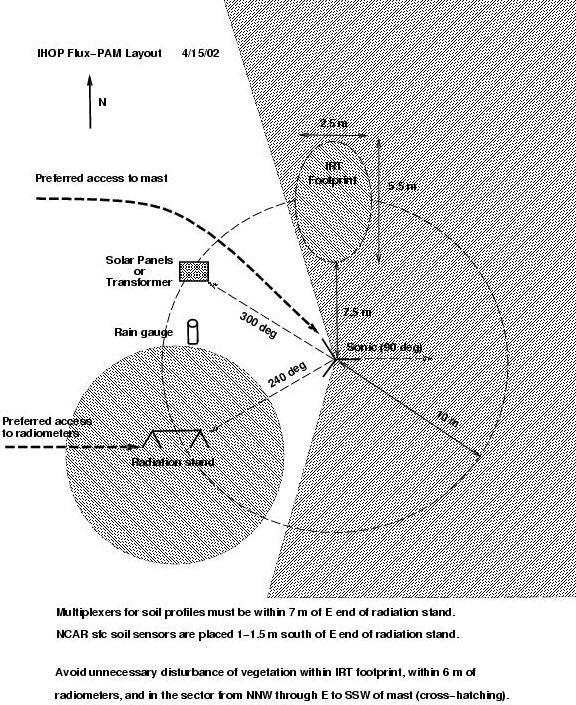
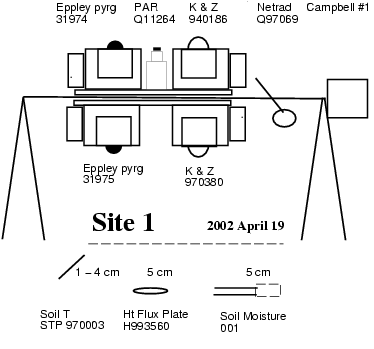
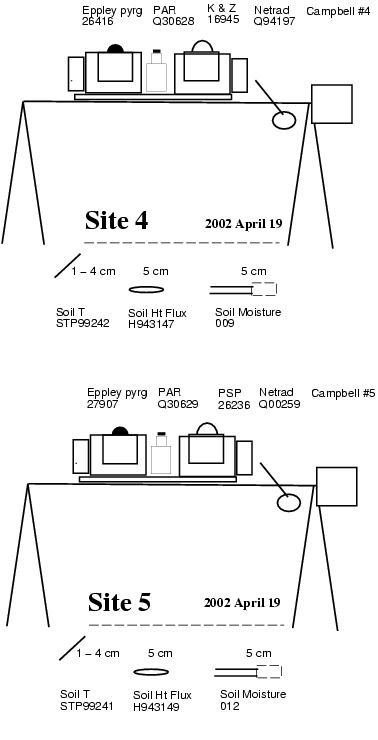
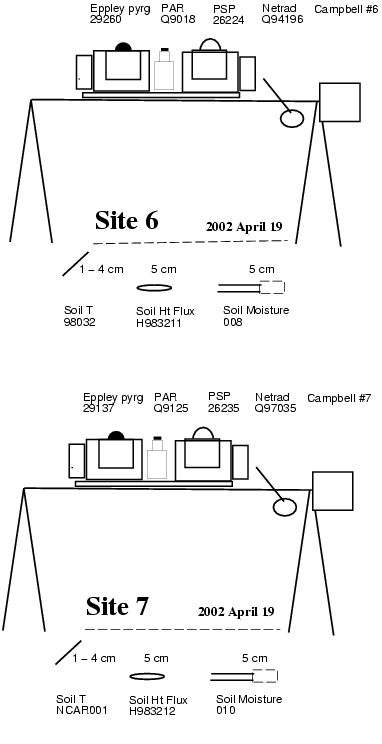
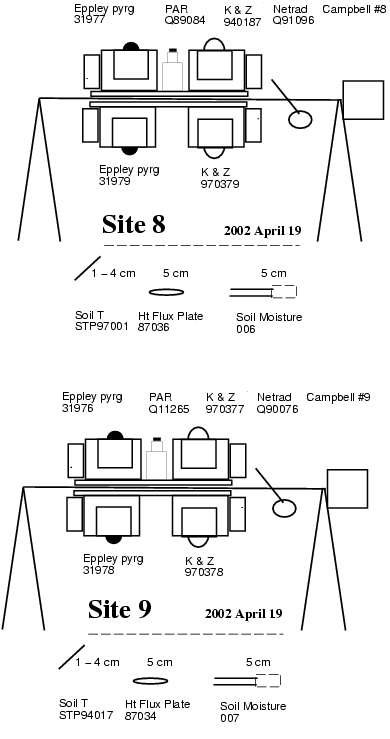
The basic instrumentation at each site consists of:
Specific IHOP documentation for all ISFF sensors is found under Sensor Notes below.
| Station# | Nearby Town | Latitude (deg min N) | Longitude (deg min W) | Elevation (m) | Environment | Instrumentation |
|---|---|---|---|---|---|---|
| 1 | Booker TX | 36° 28.370' | 100° 37.075' | 872 | fallow | basic w/ CSAT3 sonic, 2 additional soil profiles 4 comp radiation LI-7000 CO2 high-rate data archival |
| 2 | Elmwood OK | 36° 37.327' | 100° 37.619' | 859 | grassland | basic w/ CSAT3 sonic |
| 3 | Beaver OK | 36° 51.662' | 100° 35.670' | 780 | sagebrush | basic w/ CSAT3 sonic |
| 4 | Zenda KS | 37° 21.474' | 98° 14.679' | 509 | grassland | basic w/ CSAT3 sonic |
| 5 | Spivey KS | 37° 22.684' | 98° 9.816' | 506 | winter wheat | basic w/ ATI-NUW sonic |
| 6 | Conway Spgs KS | 37° 21.269' | 97° 39.200' | 417 | winter wheat | basic w/ ATI-NUW sonic |
| 7 | New Salem KS | 37° 18.792' | 96° 56.323' | 382 | grassland | basic w/ CSAT3 sonic |
| 8 | Atlanta KS | 37° 24.418' | 96° 45.937' | 430 | grassland | basic w/ ATI-NUW sonic,
4 component radiation, LI-6251 CO2, high-rate data archival |
| 9 | Grenola KS | 37° 24.618' | 96° 34.028' | 447 | grassland | basic w/ ATI-NUW sonic,
2 additional soil profiles 4 component radiation |
Following are notes on the deployment, operation, and post-project processing of data from each of the sensors. In general, these notes have been summarized from the field logbook. Additional details can be found in the individual logbook entries.
Prior to deployment of the stations, each of the propellors was spun manually to detect bad bearings; all of the prop vanes passed this test. After the field project, the prop vanes were operated in the NCAR Sensor Calibration Laboratory wind tunnel to determine the starting threshold of the propellors. With the exception of serial number 35500, the starting speeds were in the range of 0.3 - 0.77 m/s. For details, see logbook entry 317.
The post-project threshold starting speed for serial number 35500, located at site 2, was 2.2 m/s. By examining the ratio of prop-vane and sonic wind speeds, it appears that the prop-vane wind speeds at site 2 may have been degraded at low wind speeds as early as May 25.
During a visit to site 8 on May 29, it was noticed that the propellor bearings were noisy. The prop-vane speed head, which includes the bearings, was replaced around 17:00 CDT, May 31. By examining the ratio of prop-vane and sonic wind speeds, it is quite apparent that the propellor starting threshold approached 2 m/s as early as May 25, and it also appears that the prop-vane wind speeds at site 8 may have been degraded for wind speeds below 2 m/s as early as May 14. No attempt has been made to edit or correct the data to account for the high prop-vane wind speed thresholds found at sites 2 and 8.
At sites 5 and 6, the calibration coefficients stored in RAM for the prop-vane wind direction encoders were occasionally corrupted, causing the wind direction reading to become stuck at roughly 260 degrees. This problem was fixed in the field by simply cycling power on the prop vanes. The erroneous wind direction data have been eliminated from the Quality-Controlled (QC) data set provided to investigators. Since the prop-vane data are reported as orthogonal wind components (U,V) and the wind speed measurement was valid during these periods, an additional variable Spd=(U2+V2)1/2 was created to provide that data.
Following the field program, a second calibration data set was collected with each 50Y, and the hygrothermometer outputs using the pre-project calibration coefficients were compared to the laboratory standards. A summary of the results is found in logbook entry 316. In general the 50Y temperatures agreed with the laboratory standard within ± 0.05°, the exception being s/n 001 deployed at site 4 and having an apparent offset on the order of -0.1°. The 50Y relative humidities agreed with the laboratory standards within ± 2 %RH, with the exception of s/n 003-005 deployed at sites 7, 3, and 2 and having maximum differences of 2.5-4 %RH.
P8 = (P7 + P9)/2 - 1.72 mb
P8 = P7 - 5.26 mb
P8 = P9 + 1.82 mb
The pressure offsets in each of the preceding formulas was calculated from IHOP data when it was available from all of the required barometers. A comparison of the measured and estimated values of P8 finds that the errors in the estimated values are generally considerably less than 1 mb. The mean absolute error of the first formula is 0.1 mb, while those of the second and third formulas are 0.2 mb.
| Site | 1 | 2 | 3 | 4 | 5 | 6 | 7 | 8 | 9 |
|---|---|---|---|---|---|---|---|---|---|
| Height, m agl | 2.5 | 3.43 | 2.7 | 2.6 | 5.0 | 4.9 | 2.7 | 4.6 | 4.7 |
These heights did not change during IHOP. The original deployment included only CSAT and ATI-NUW sonics, and when maintenance required replacing an ATI-NUW sonic by an ATI-K sonic, the sonic height was not changed. The CSAT sonics did not require maintenance during IHOP.
The sonic anemometer at site 6, ATI-K serial number 980202, output increasingly high wind speeds beginning around 16:15 CDT, June 17. The sonic was replaced around 19:00 CDT, June 20. Based on the data, the problem appears to have been a wind speed offset in the u and/or v paths of the sonic. Since the turbulent fluxes appear to be unaffected, only the mean horizontal wind components have been eliminated from the QC sonic data.
The sonic anemometer originally deployed at site 9, ATI-NUW serial number 7, had an intermittent failure of its "a" path. This sonic was replaced around 19:00 CDT, May 15. The erroneous sonic data have been eliminated from the QC data set.
The sonic anemometer data have also been edited to remove data that both look anomolous and also have concurrent diagnostic warning flags set by the sonic firmware. For the CSAT3 sonics this required that both bits 14 and 15 in the fourth word of the data message were set high during at least one sample within a 5-minute period. These bits indicate poor signal lock (bit 14) and a difference in the speed of sound between the three measurement axes greater than 2.36 m/s, equivalent to about a 4 °C difference in inferred temperature (bit 15). For the NUW and ATIK sonics this required that the number of pulses per data sample per axis dropped below the set value, generally 11 pulses per data sample.
The coordinates of the three-dimensional sonic wind data have been rotated during data post-processing to align the vertical axis of the sonic anemometers normal to the mean wind field and to align the horizontal axes with geographic coordinates (u is a wind from the west, v is a wind from the south). The tilt angles for each sonic have been estimated from its wind data using the planar fit technique. The tilt angles, as well as the calculated vertical velocity offset, are tabulated in the logbook for each sonic. This table also includes the azimuths of the sonic booms.
U(z) = (u*/k)ln((z-D)/zo)
where U is the mean wind speed measured at height z (above ground level), u* is friction velocity, and k=0.4 is the von Karman constant. zo and D have been calculated for IHOP using the prop-vane and sonic wind speed measurements, along with the sonic measurement of friction velocity. Also included in the following table are values of 2/3 the vegetation height, h, measured during 4 or 5 spatial surveys taken periodically at each site between the beginning and end of IHOP, with each site survey composed of measurements at 14-18 locations. For most sites, the table lists the range, over the period of the project, of the mean vegetation height for each survey. For sites 5 and 6, the pair of h values are the average heights of the wheat crop before and after harvest.
| Site | 1 | 2 | 3 | 4 | 5 | 6 | 7 | 8 | 9 |
|---|---|---|---|---|---|---|---|---|---|
| z0, cm | 0.24 | 2.4 | 2.9 | 1.1 | 5.9 | 4.9 | 2.3 | 1.8 | 1.2 |
| D, cm | 1 | 86 | 40 | -13 | 156 | 126 | 2 | 55 | 37 |
| 2h/3, cm | 0 | 6-12 | 23-29 | 11-24 | 45, 16 | 41, 17 | 19-24 | 17-24 | 7-21 |
The values calculated for the roughness length are consistent with the perceptions of those who visited the sites. However the zero-plane displacement is commonly estimated to be 2/3 the height of the vegetation canopy. Thus, with the exception of site 1, the calculated values of the zero-plane displacement are not consistent with either the measured vegetation heights or the qualitative perceptions of those who visited the sites. Therefore, the displacement heights were taken to be 2/3 the height of the vegetation. The resulting values are listed in logbook entry 325.
Soon after the start of the project, it was discovered that water had infiltrated into the electronics of the KH2O and corroded the connector carrying the supply voltage. Subsequently, attempts were made to clean the connector, seal the electronics container, and eventually to replace the connector. The corroded connector caused various degrees of data contamination. The KH2O data at site 3 were particularly noisy until the connector was cleaned on May 22.
The KH2O data were also contaminated during transmission of data to the GOES satellite. Fortunately, the error in the computed water vapor fluxes is negligible. The median fractional error was found to be less than 1% and the median absolute error was found to be less than 10-4 m/s gm/m3, equivalent to a latent heat flux of 0.25 W/m2.
The KH2O data were edited to remove anomolous data. These data were identified by comparing the water vapor density measured by the Krypton hygromter, kh2o, to the water vapor density H2O calculated from the measurements of temperature, pressure, and relative humidity. KH2O data were deleted whenever kh2o was not correlated with H2O. After this editing based on mean values, stations 7-9 still had extended periods of low variance of the water vapor signal. In the case of stations 8 and 9 these periods ended when the krypton sensors were changed. The periods 14-24 May (stn7), 14 May - 8 Jun (stn8), and 27 May - 10 Jun (stn9) will be removed from the final data set.
The soil heat flux G was measured with a heat flux plate at a depth of 5 cm, with the convention that an upward heat flux is positive. In order to obtain the soil heat flux at the surface, this measurement needs to be corrected with the subtraction of the energy storage in the overlying soil,
Gsfc = G5cm - zG dT/dt Cs
where Gsfc and G5cm are the heat fluxes at the surface and a depth of 5 cm, zG is the depth of the heat flux plate, dT/dt is the time rate of change of soil temperature in the top 5 cm, and Cs is the volumetric heat capacity of the soil. The latter is calculated as
Cs = rhos/rhom*1.9e6 + Qs*4.2e6 , Joule/(m3 °C)
where rhos is the soil bulk density, rhom is the density of mineral particles (2.65 gm/cm3), and Qs is the soil volumetric water content. The soil bulk density at each of the IHOP ISFF sites was measured by Richard Cuenca at Oregon State University. The IHOP ISFF measurements of the soil heat flux at 5 cm, the soil volumetric water content, and the soil temperature are described below. The soil bulk densities reported by OSU on October 30, 2002, were
| Site | 1 | 2 | 3 | 4 | 5 | 6 | 7 | 8 | 9 |
|---|---|---|---|---|---|---|---|---|---|
| rhos, gm/cm3 | 1.23 | 1.30 | 1.54 | 1.69 | 1.18 | 1.55 | 1.31 | 1.15 | 1.14 |
Prior to the field program, it was thought that soil surface temperatures would not fall below 0 °C. Consequently, surface temperature data were lost at site 1 roughly from 02:00 - 07:00 CDT, May 13, and from 05:30 - 06:30 CDT, May 14.
The Everest at site 1 had an intermittent noise problem, apparently due to a bad connector that was not repaired until the morning of June 22. The Everest connectors at sites 2-4 were improperly seated from June 1 until June 4. The bad data have been deleted from the QC data.
At site 1, the surface radiative temperature during the missing/bad periods can be calculated from the incoming and outgoing longwave radiation measurements. However, it should be noted that the bandwidth, field of view, and viewing angle of the pyrgeometers differ from those of the Everest IRT sensor.
The Everest data were contaminated by RF noise during the transmission of data to the GOES satellite. The contamination appears as an offset to the measured surface temperature. Since the transmission occurred for only 20 seconds every 5 minutes, it is found that the contamination of the 5-minute mean values is negligible. The induced offset in the 5-minute means is generally on the order of ± 0.1 °C or less, while the manufacturer's specification for the absolute accuracy of the sensor is ± 0.5 °C.
While examining high-rate data recorded at sites 1 and 8, it was discovered on May 29 that use of the serializer imposed an offset on the digitized analog output during GOES transmissions (AOE did not use GOES), which occur for 20 seconds every 5 minutes. This affected the KH2O fast water vapor and Everest infrared surface temperature data. A summary of the logbook entries related to this problem is here. Within a day of discovering this problem, it was determined that the contamination was related to the physical proximity of the GOES transmitter and the serializers within the EVE box. After another day, it was determined that the contamination could be significantly reduced by shielding both the analog signal cables from the EVE front panel to the serializers and the power and signal cables to the GOES transmitter. During the following 3 days, the shielding was implemented on all 9 stations, as tabulated below:
| Station | Time [logbook entry] |
|---|---|
| 1 | 6/1 14:00 [173] |
| 2 | 6/1 15:30 [174] |
| 3 | 6/1 18:00 [175] |
| 4 | 5/31 12:30 [170] + 6/2 10:30 [178] |
| 5 | 6/2 11:30 [179] |
| 6 | 6/2 13:30 [180] |
| 7 | 5/31 17:00 [172] |
| 8 | 5/31 18:00 [172] |
| 9 | 6/3 12:00 [184, 188] |
In order to quantify the contamination at each site and for each analog sensor processed by the serializer, high-rate data was collected for 14-48 hours at each site, both with and without the RF shielding discussed above. This data was then processed to calculate 5-minute mean values, both including and excluding the 20-25 second interval of GOES transmission during each 5-minute period, and the contamination was determined from the difference between the two 5-minute means.
The long and short wave radiometers were run through a calibration sequence at NOAA in March and April, before IHOP. However, due to a heavy workload, NOAA was not able to send us the new calibration coefficients for the long and short wave thermopiles before the beginning of IHOP. Therefore we operated using the previous set of coefficients for all the radiometer thermopiles during the project. The thermopile calibrations are linear, so the correct values were applied to the averaged data in post-processing.
The long wave radiation has been calculated from pyrgeometer measurements as
Rlw = Rpile + SB*[T.case4 - B*(T.dome4 - T.case4)] - f*Rsw
Here Rlw and Rsw are the longwave and shortwave radiation fluxes, Rpile is the pyrgeometer thermopile output (voltage multiplied by a calibration constant to obtain radiative energy flux, W/m2), T.case and T.dome are the pyrgeometer case and dome temperatures, SB is the Stefan-Boltzmann constant, B is a coefficient obtained from the NOAA calibration, and f was determined from shading tests performed in the field.
The outgoing longwave radiometer at site 1 malfunctioned intermittently until it was replaced around 14:00 CDT, June 1. The net radiation, shortwave radiation, and longwave radiation data at site 9 were intermittently missing/noisy until the terminal screws in the data logger were tightened around 18:30 CDT, May 25. Where these data are obviously incorrect, they have been deleted from the QC data. (Where the net radiometer data are good, a comparison between the net radiometer and the sum of the incoming and outgoing shortwave and longwave radiometers was used to make judgements about the validity of the longwave and shortwave data.)
A crack was noticed along the lower margin of the upper net radiometer dome at Site 3 on June 13. The dome was replaced around 18:30 CDT June 17. A crack was noticed along the lower edge of the upper net radiometer dome at Site 8 on May 13. The radiometer was replaced around 18:00 CDT May 19.
The soil water content and heat flux sensors were inserted into the soil horizontally at a depth of 5 cm. The soil temperature sensor has a length of 10 cm and was inserted into the soil at a depth of 5 cm and at an angle of approximately 30 degrees above horizontal to provide an average temperature for the upper 5 cm of soil. The calculation of the surface soil heat flux from these measurements is described above.
The output of the CS615 water content reflectometer depends primarily on soil volumetric water content. However, the response of the CS615 to soil moisture depends on soil clay content and electrical conductivity, and thus is best calibrated for each specific site. Data for in-situ calibrations of the CS615 sensors were collected during periodic site visits by means of nearby soil moisture measurements with a Trime hand-held time-domain refractometer. The Trime was re-calibrated by the manufacturer after the field program. The pre-calibration numbers showed that the instrument was well within the required accuracy during IHOP. For reference soil moistures of 2.8% and 44.2%, the Trime read 3.0% and 44%, respectively.
The Trime measurements spanned a significant fraction of the range of soil moisture encountered during the duration of the IHOP field program. In addition, laboratory measurements at zero soil moisture were made before and after the IHOP field project with the CS615 inserted into a container of dry glass beads. A linear, least-squares fit of the Trime/lab soil moisture data versus the CS615 output was then calculated for each site to obtain the calibrations used in post-project processing of the CS615 data. The root-mean-square of the residuals for these fits were on the order of 2-3% volumetric water content. Note that the response of the CS615 at site 1 appears to have shifted significantly after 19:40 CDT on June 20, and different calibrations are used before and after that date.
The soil heat flux sensor at site 1 was inoperative from 04:00 CDT, June 17, until 20:15 CDT, June 22, due to a chewed wire. The soil heat flux and soil temperature data at site 9 were intermittently missing/noisy until the terminal screws in the data logger were tightened around 18:30 CDT, May 25. Where these data are obviously incorrect, they have been deleted from the QC data provided to the investigators.
| Station 1 | Station 2 | Station 3 | Station 4 | Station 5 |
| Station 6 | Station 7 | Station 8 | Station 9 | |
| fauna | Wichita |
High rate time series and spectra plots for stations 1 & 8, May 18, 12:00-12:30
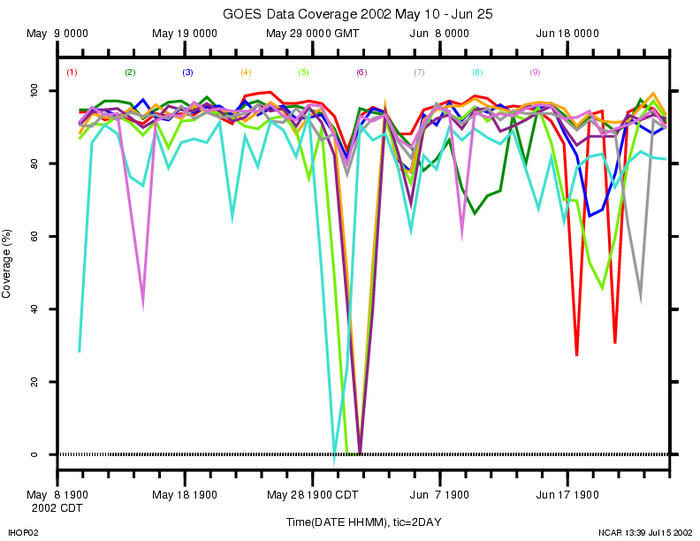 Real-time transmission of the 5-minute statistics via the
GOES-East satellite provided about a 90% data recovery rate.
More study is needed to determine why this was so low.
Click on the plot for a larger view.
Real-time transmission of the 5-minute statistics via the
GOES-East satellite provided about a 90% data recovery rate.
More study is needed to determine why this was so low.
Click on the plot for a larger view.
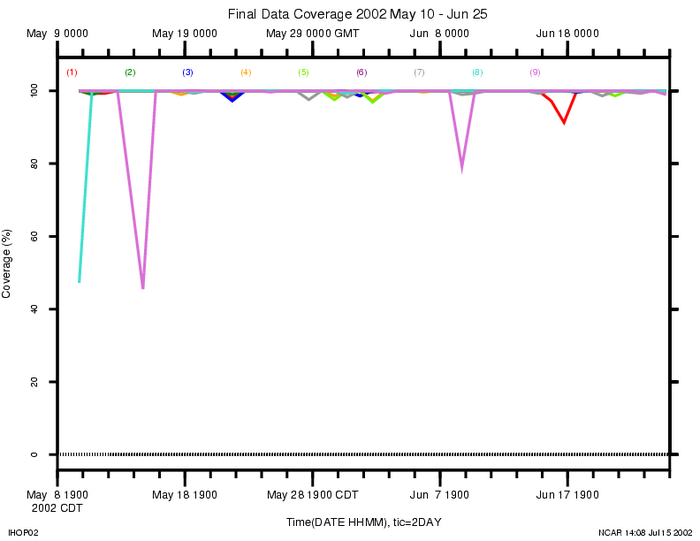 The 5-minute statistics were also stored on a local flash disk at each
station, and downloaded during maintenance visits to the station. The
final data set consists of the merged GOES and local storage data sets, and
provided a data coverage of nearly 100% at all stations.
The 5-minute statistics were also stored on a local flash disk at each
station, and downloaded during maintenance visits to the station. The
final data set consists of the merged GOES and local storage data sets, and
provided a data coverage of nearly 100% at all stations.
| Station | Total Records | GOES Recovery (%) | Final Coverage (%) |
|---|---|---|---|
| 1 | 13536 | 91.3 | 99.7 |
| 2 | 13536 | 90.7 | 99.9 |
| 3 | 13536 | 91.0 | 99.9 |
| 4 | 13536 | 89.5 | 99.9 |
| 5 | 13536 | 81.4 | 99.8 |
| 6 | 13536 | 87.4 | 100 |
| 7 | 13536 | 90 | 99.8 |
| 8 | 13536 | 77.7 | 98.9 |
| 9 | 13536 | 90.4 | 97.8 |