N.B. covariances are shown in the form w:t.100.5m where this implies w.100.10m:t.100.10m.
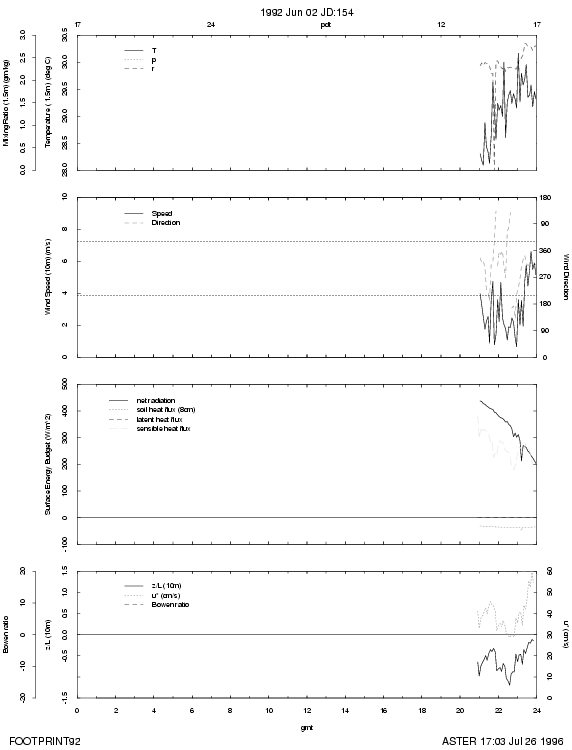
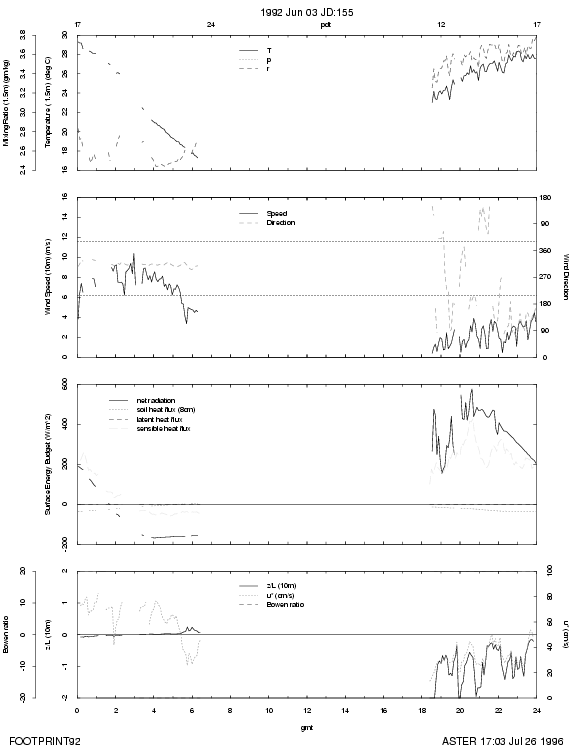
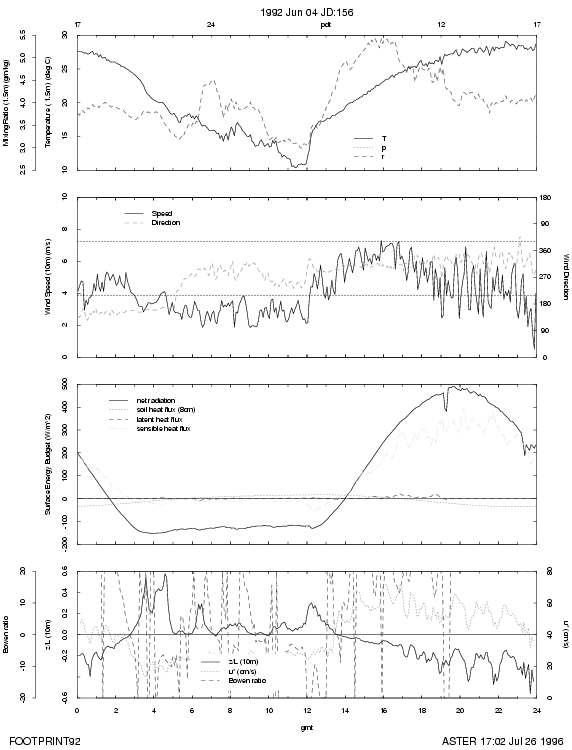
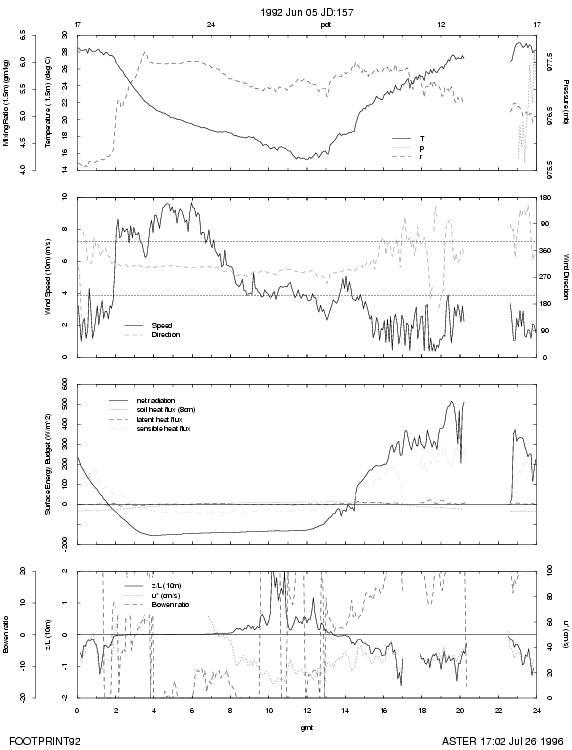
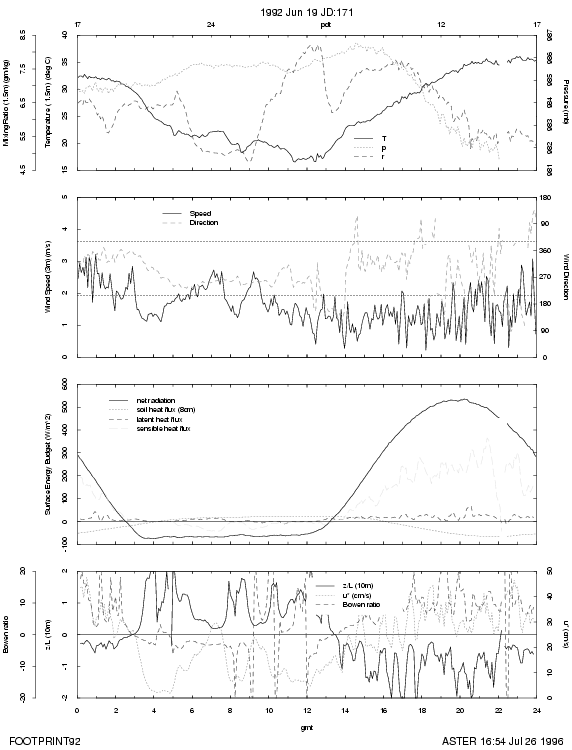
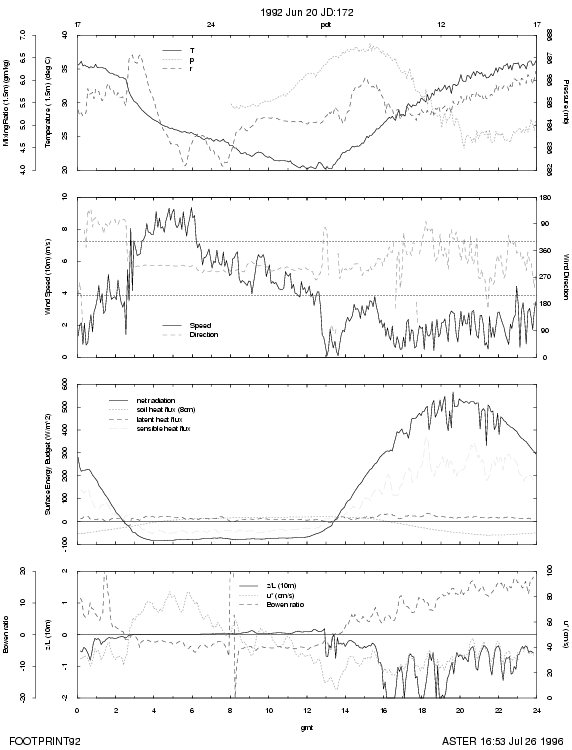
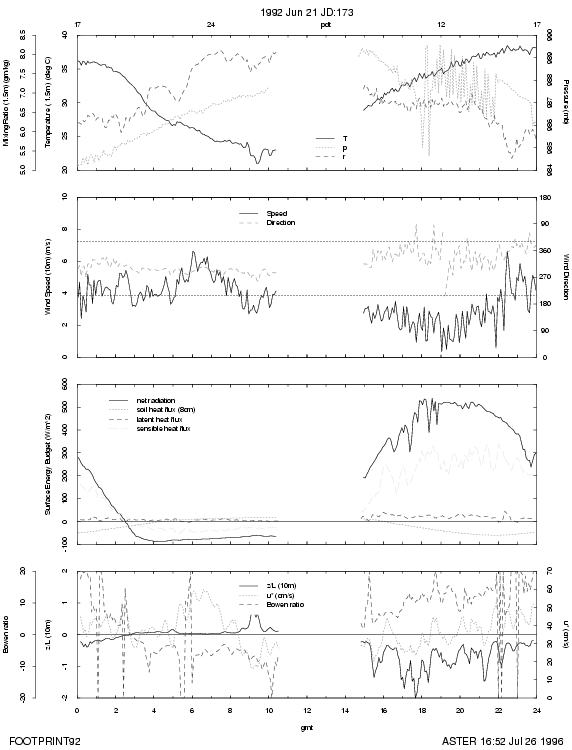
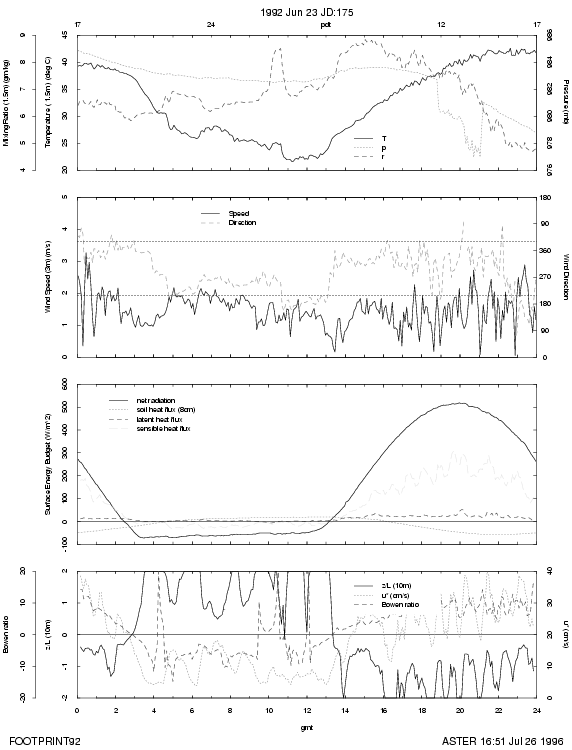
Daily weather plots
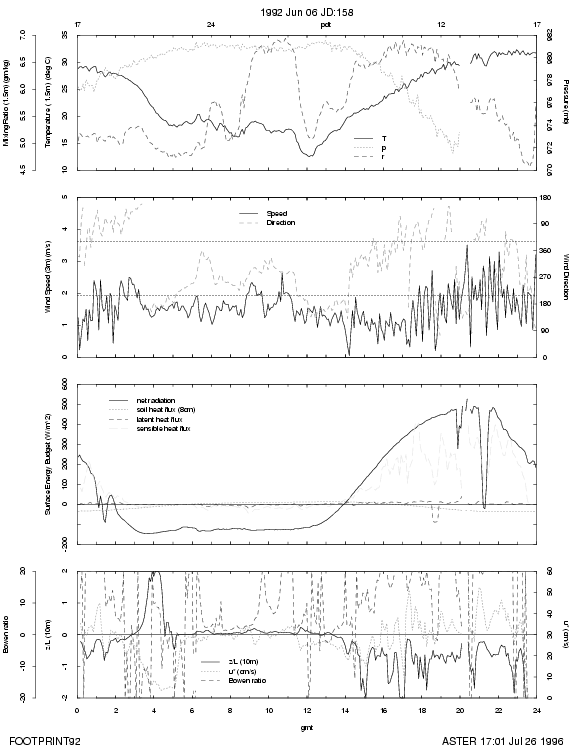
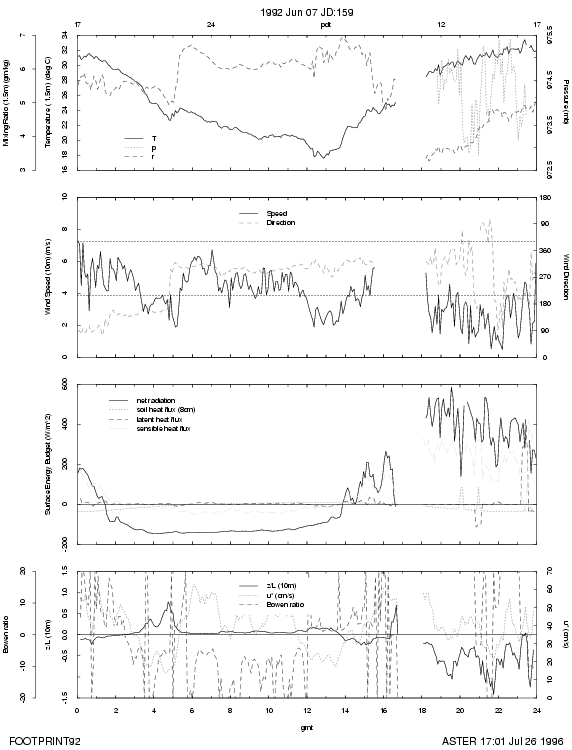
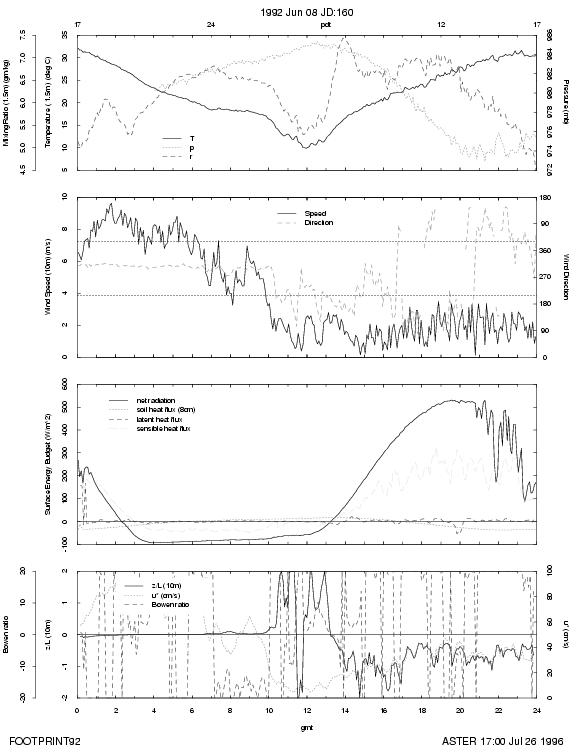
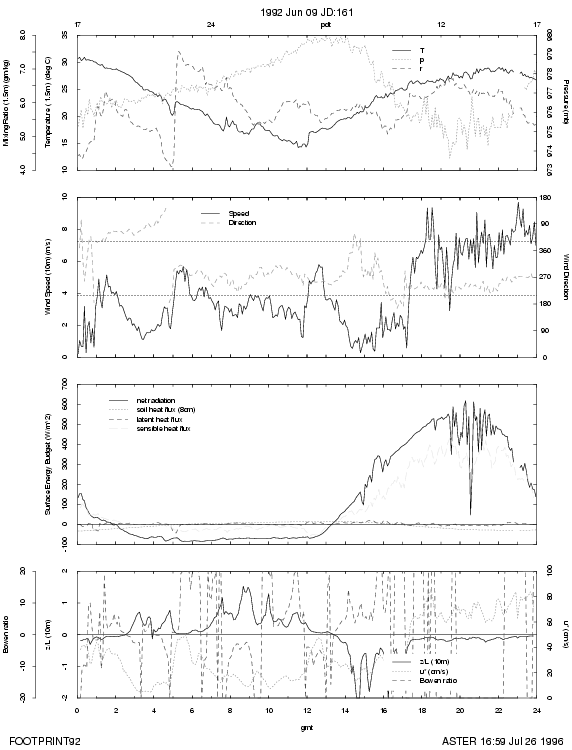
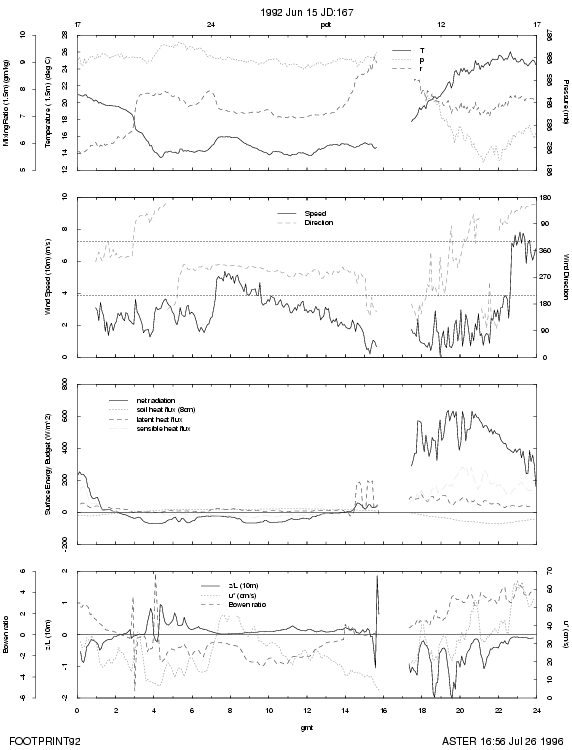
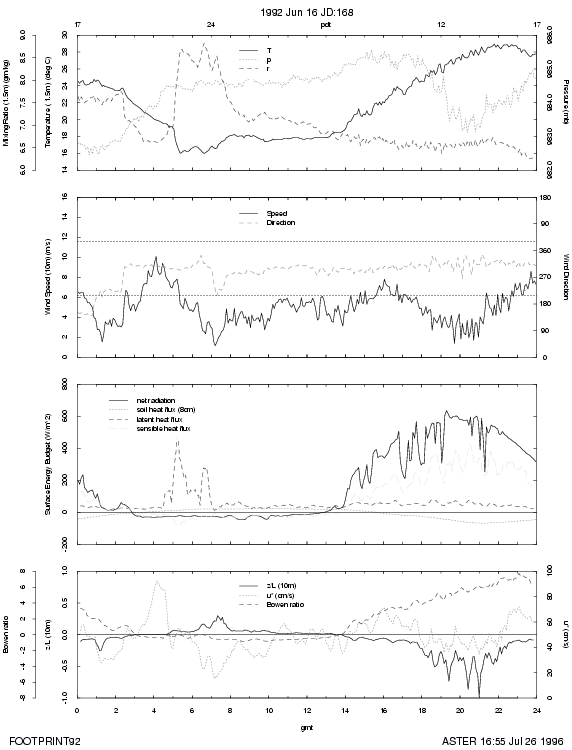
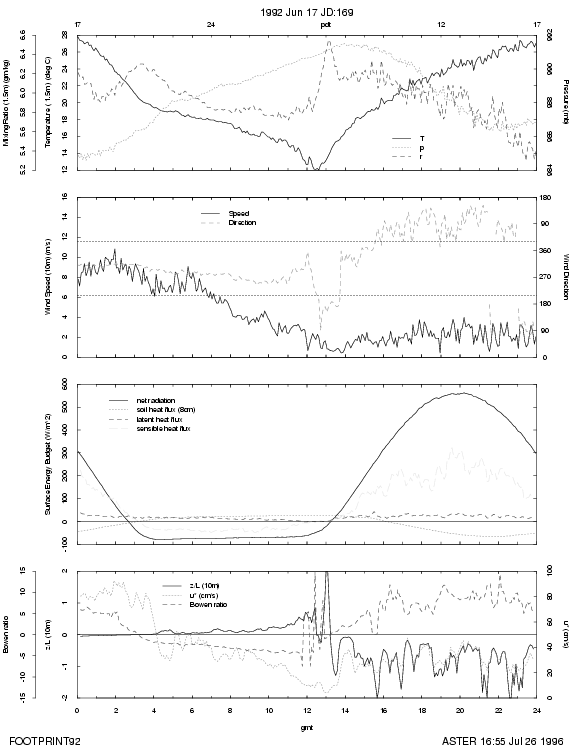
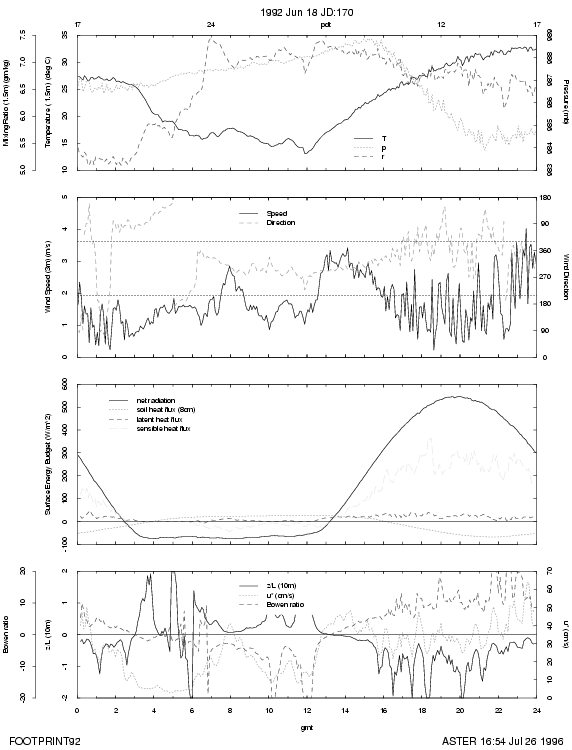
The daily weather plots presented in the appendix are:
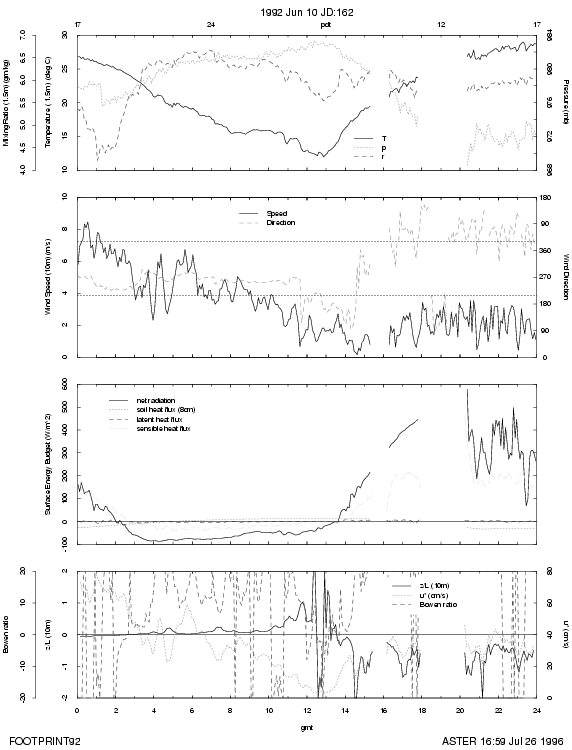
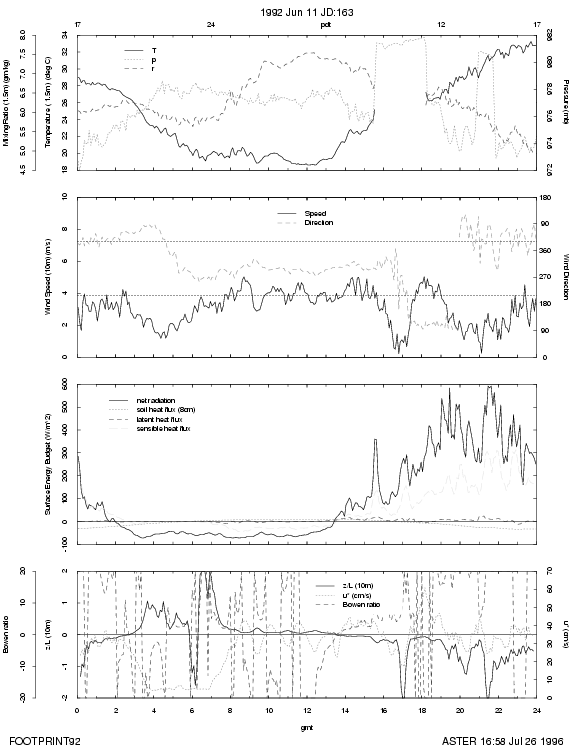
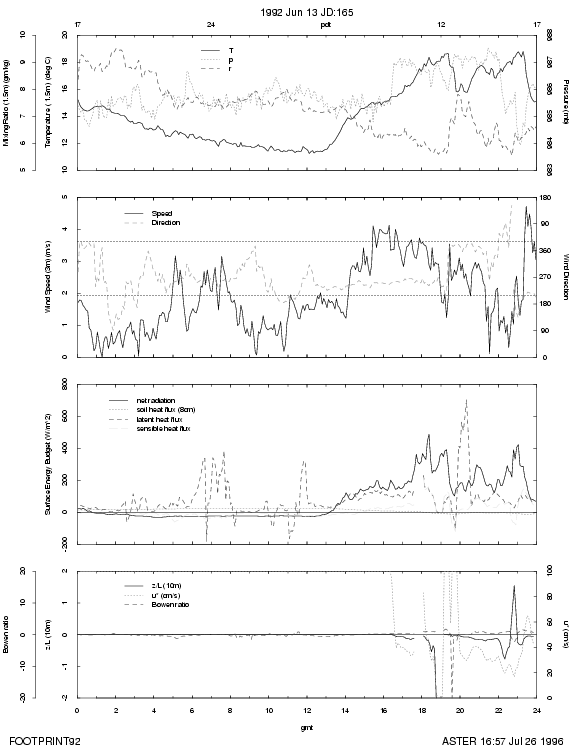
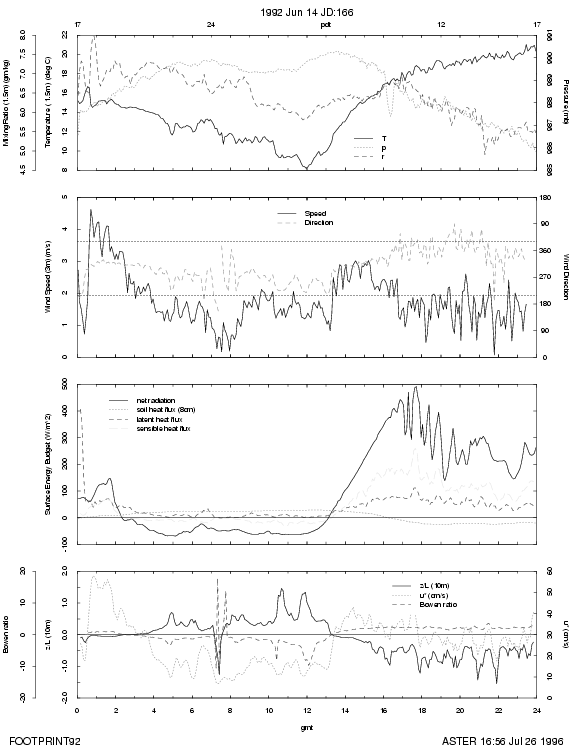
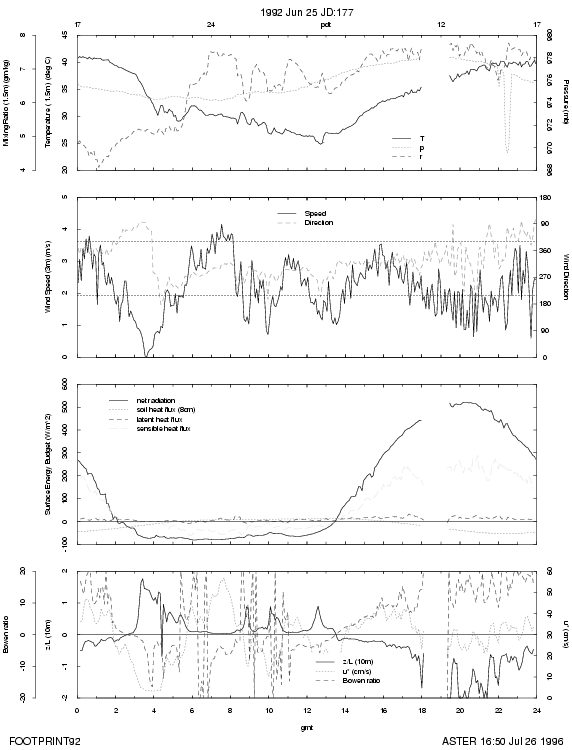
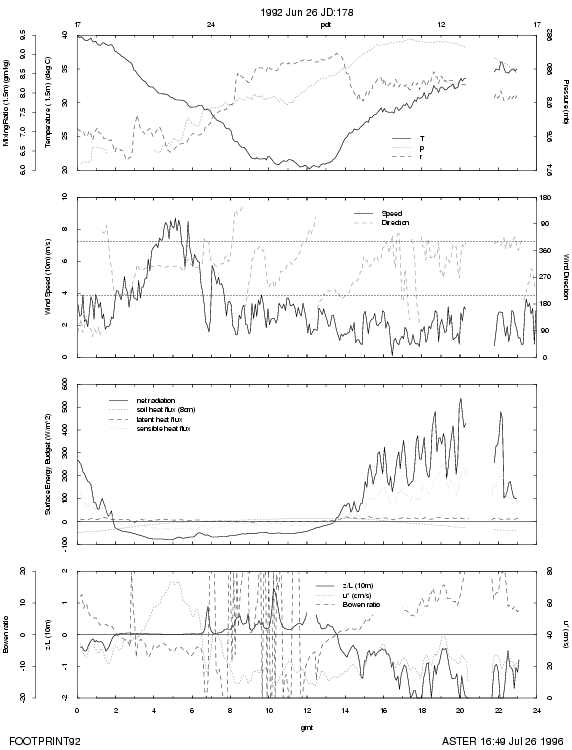
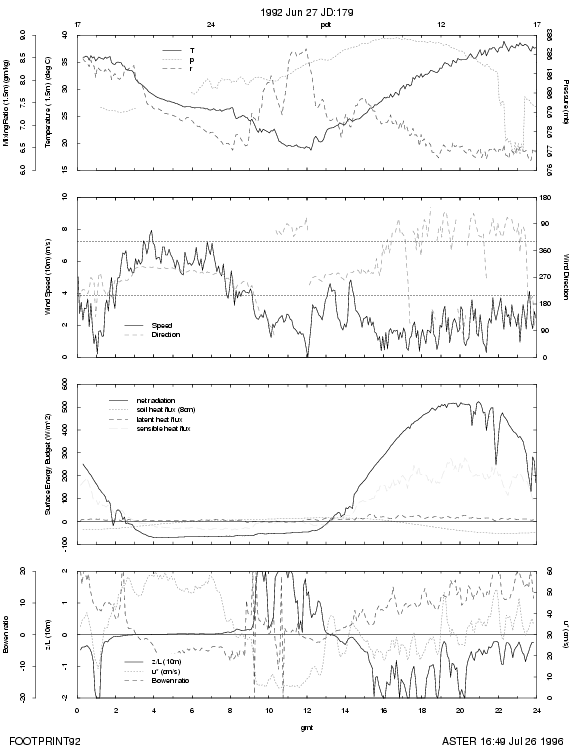
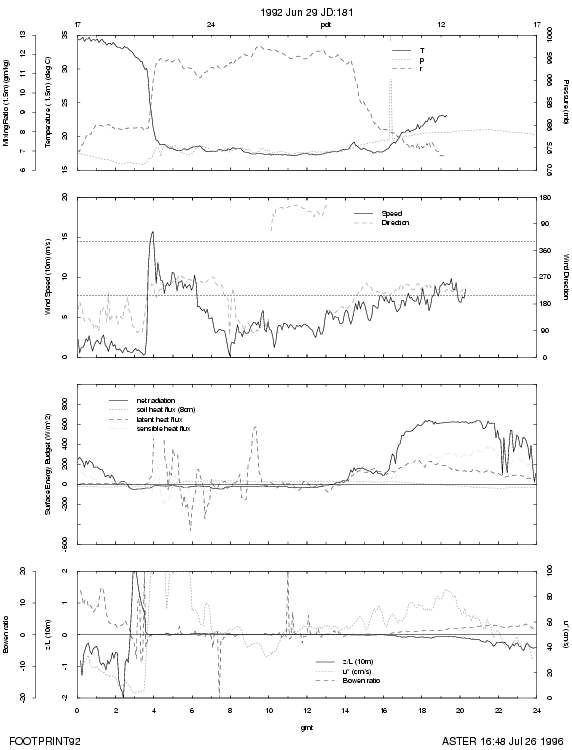
The values plotted for temperature, humidity, pressure, rainfall, wind speed and direction, net radiation and surface heat flux are 5 minute averages, while the values plotted for the sensible heat flux, the latent heat flux, Z/L and u* are 20 minute averages.
The plots are listed according to Julian day:
154 155 156 157 158 159 160 161 162 163 164 165 166 167 168 169 170 171 172 173 174 175 176 177 178 179 180 181