National Center for Atmospheric Research
EOL Integrated Surface Flux System

VERTEX ISFS Data Tables and Plots

Click on

Sun Mon Tues Wed Thur Fri Sat
      Aug 31
plots
QC table
Sep 01
plots
QC table
Sep 02
plots
QC table
Sep 03
plots
QC table
Sep 04
plots
QC table
Sep 05
plots
QC table
Sep 06
plots
QC table
Sep 07
plots
QC table
Sep 08
plots
QC table
Sep 09
plots
QC table
Sep 10
plots
QC table
Sep 11
plots
QC table
Sep 12
plots
QC table
Sep 13
plots
QC table
Sep 14
plots
QC table
Sep 15
plots
QC table
Sep 16
plots
QC table
Sep 17
plots
QC table
Sep 18
plots
QC table
Sep 19
plots
QC table
Sep 20
plots
QC table
Sep 21
plots
QC table
Sep 22
plots
QC table
Sep 23
plots
QC table
Sep 24
plots
QC table
Sep 25
plots
QC table
Sep 26
plots
QC table
Sep 27
plots
QC table
Sep 28
plots
QC table
Sep 29
plots
QC table
Sep 30
plots
QC table
Oct 01
plots
QC table
Oct 02
plots
QC table
Oct 03
plots
QC table
Oct 04
plots
QC table
Oct 05
plots
QC table
Oct 06
plots
QC table
Oct 07
plots
QC table
Oct 08
plots
QC table
Oct 09
plots
QC table
Oct 10
plots
QC table
Oct 11
plots
QC table
Oct 12
plots
QC table
Oct 13
plots
QC table
Oct 14
plots
QC table
Oct 15
plots
QC table
Oct 16
plots
QC table
Oct 17
plots
QC table
Oct 18
plots
QC table
Oct 19
plots
QC table
Oct 20
plots
QC table
Oct 21
plots
QC table
Oct 22
plots
QC table
Oct 23
plots
QC table
Oct 24
plots
QC table
Oct 25
plots
QC table
Oct 26
plots
QC table
Oct 27
plots
QC table
Oct 28
plots
QC table
Oct 29
plots
QC table
Oct 30
plots
QC table
Oct 31
plots
QC table
Nov 01
plots
QC table
Nov 02
plots
QC table
Nov 03
plots
QC table
Nov 04
plots
Nov 05
Nov 06
Nov 07
Nov 08
Nov 09
Nov 10
Nov 11
Nov 12
Nov 13
Nov 14

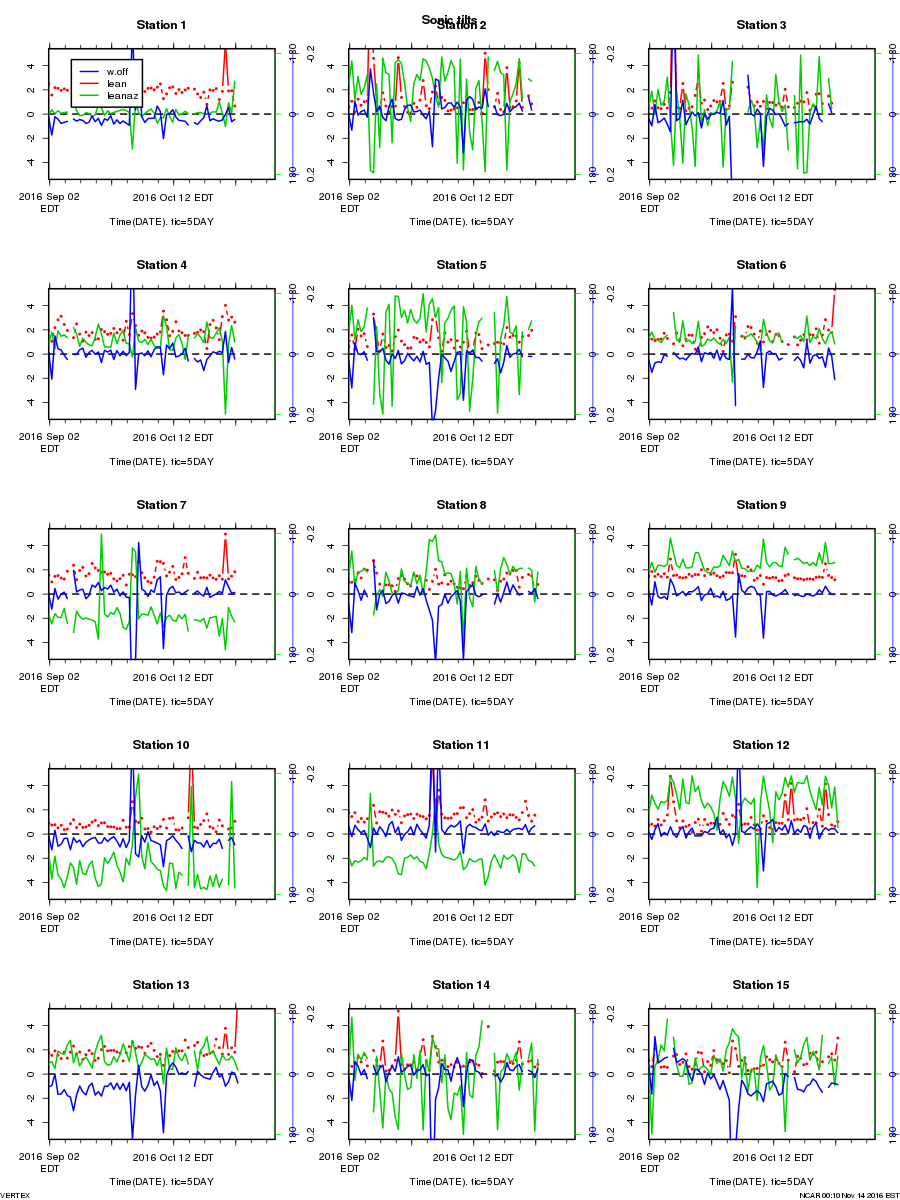
Multi-day plots are available for:

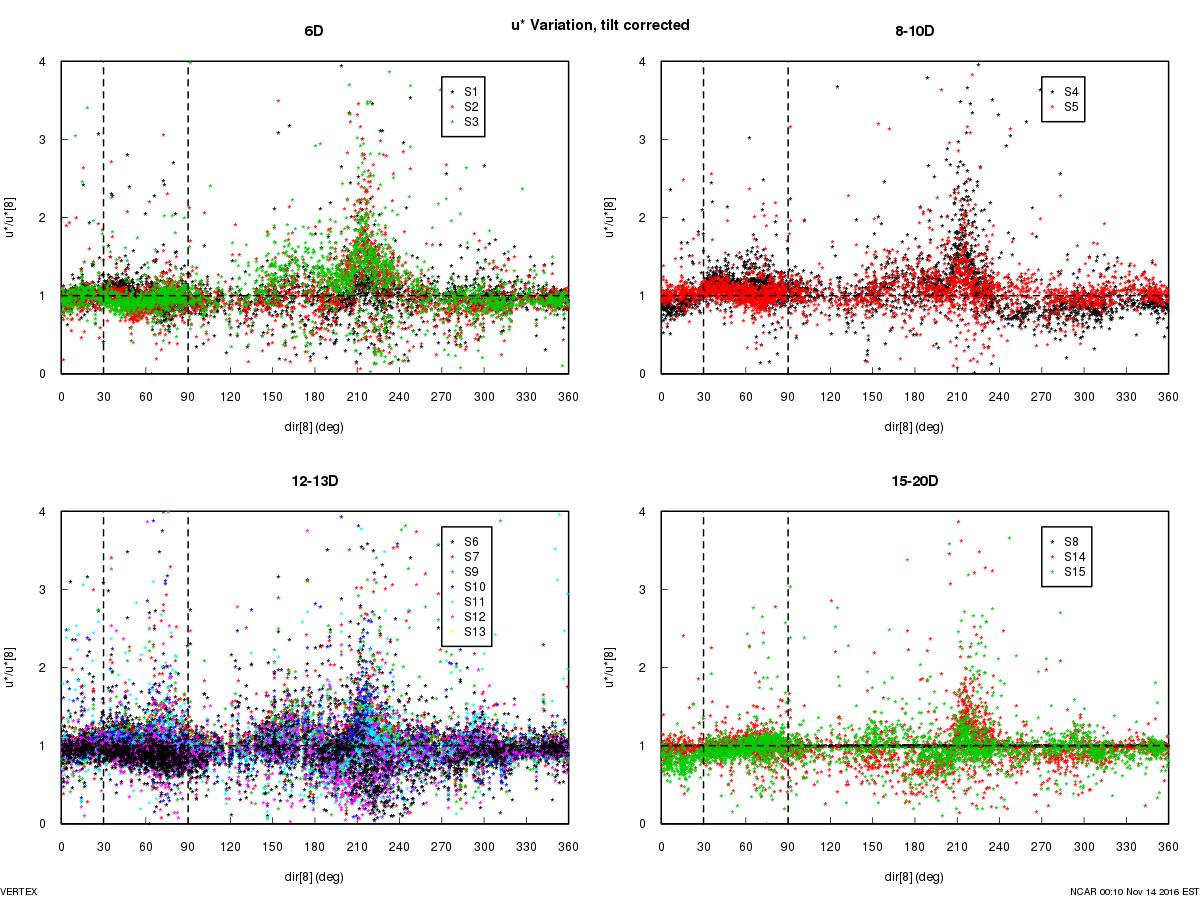
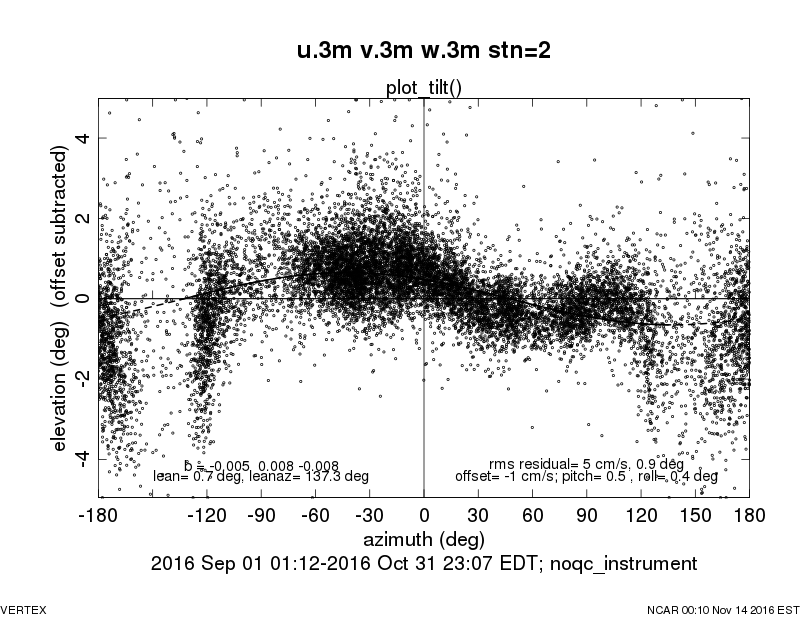
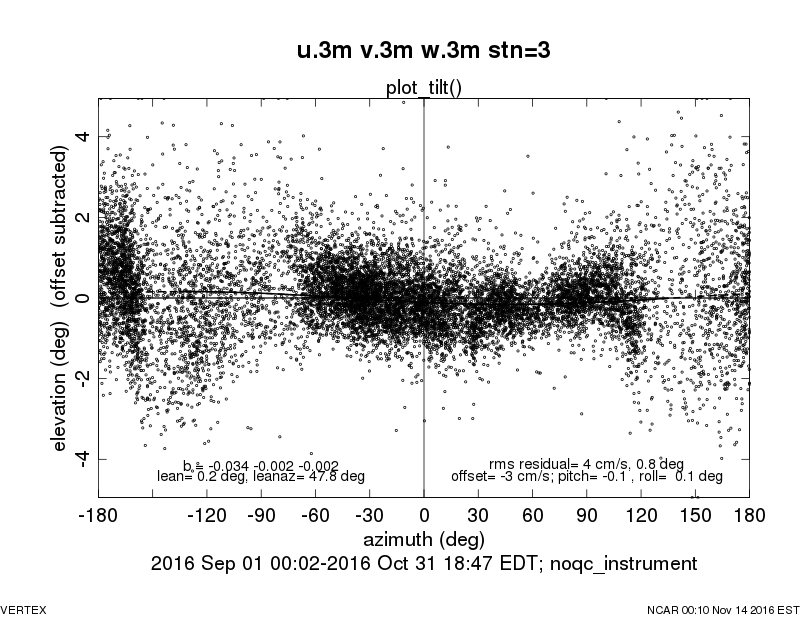
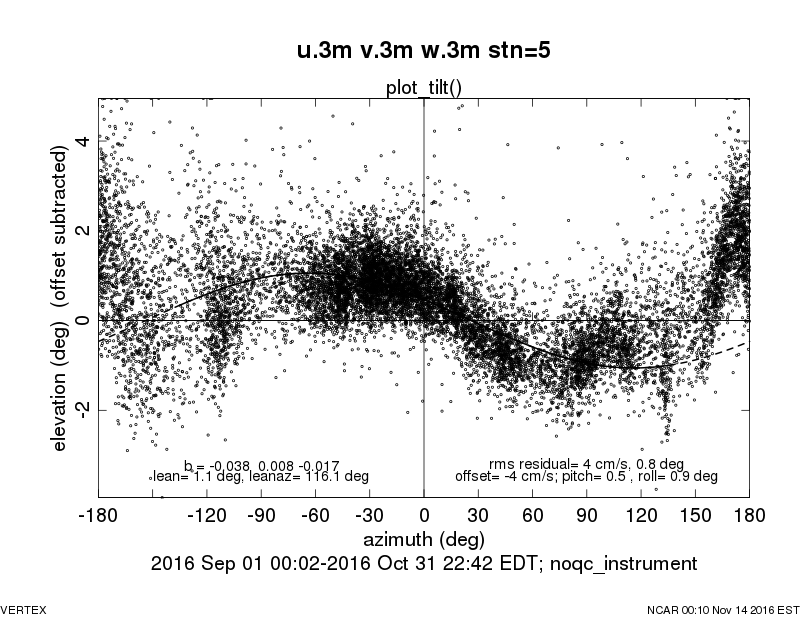
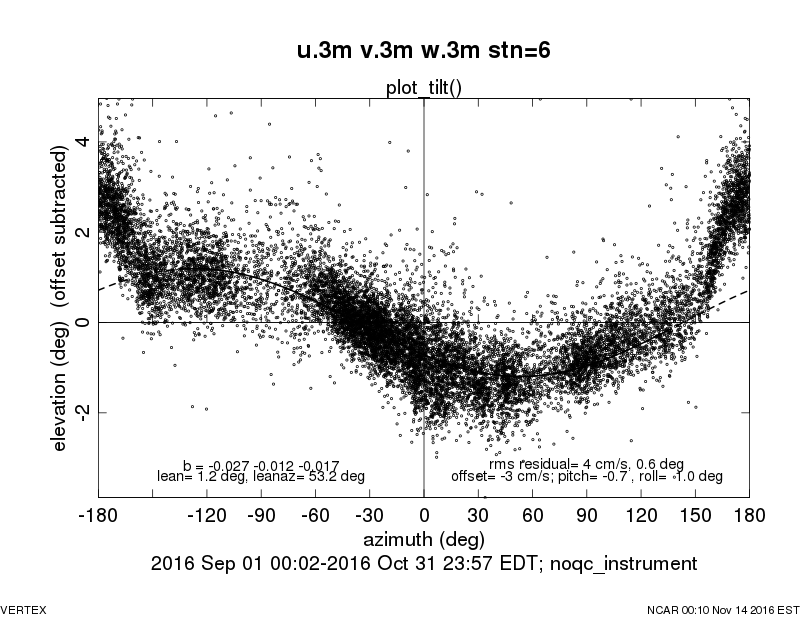
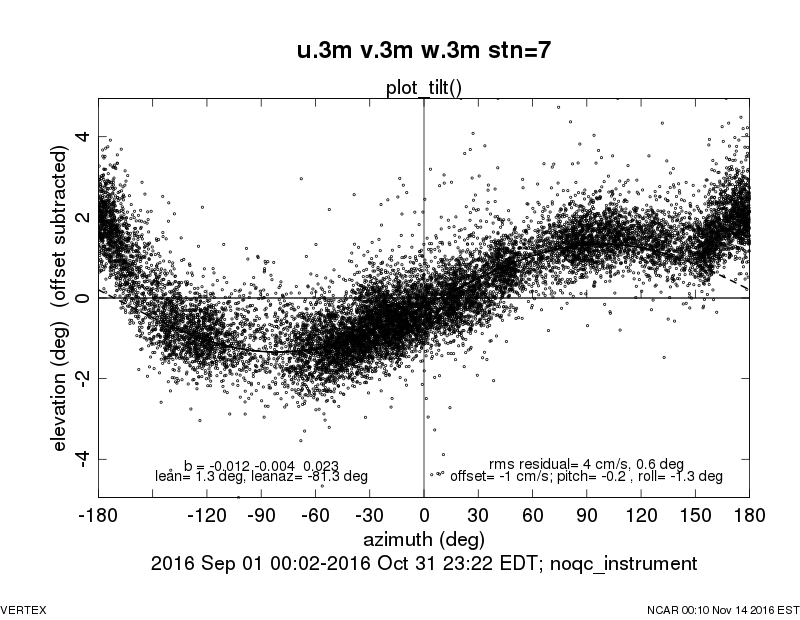
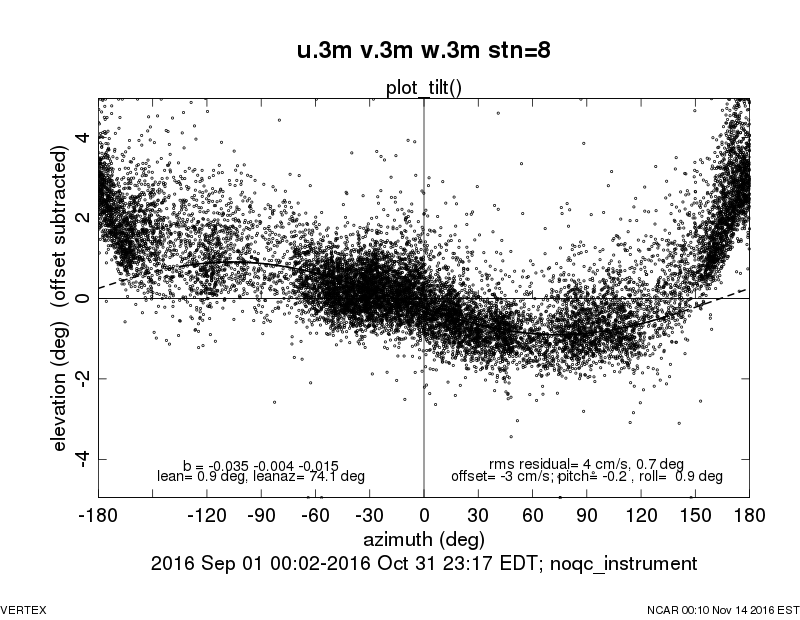
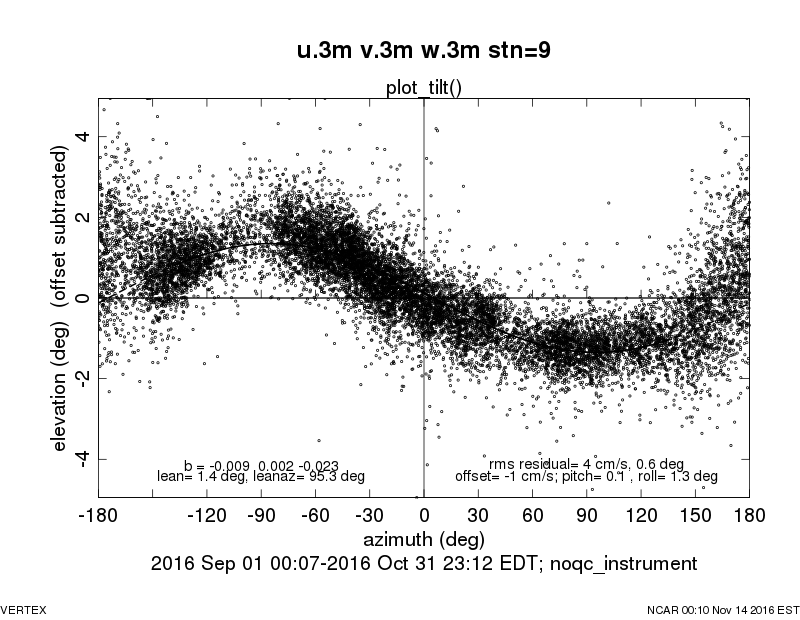
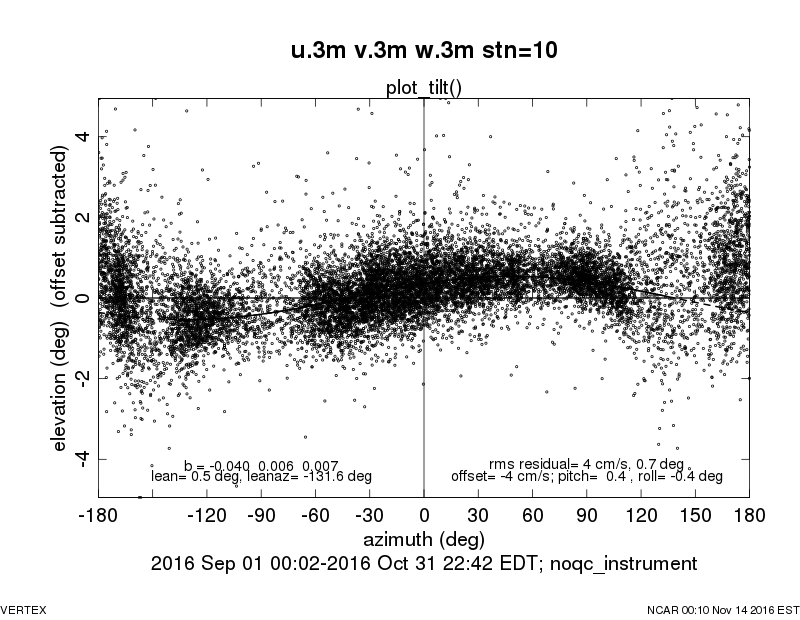
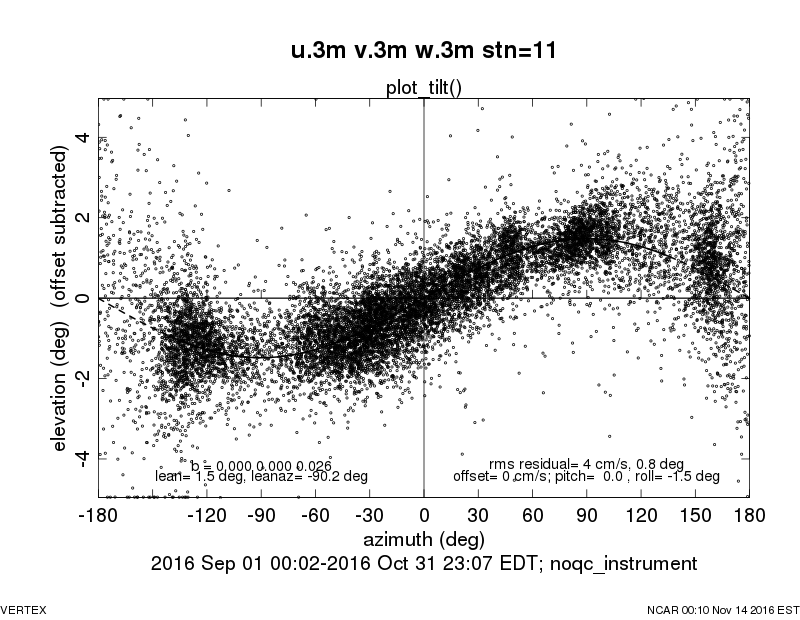
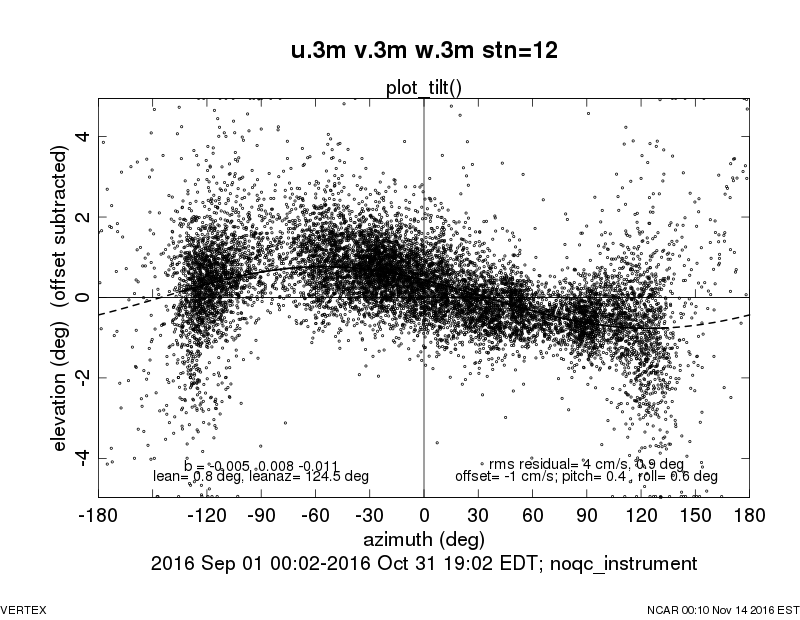
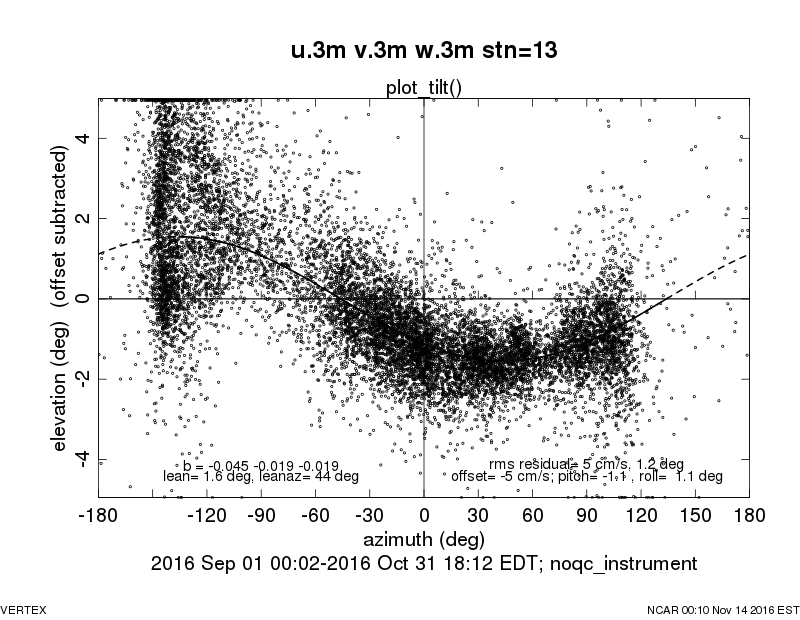
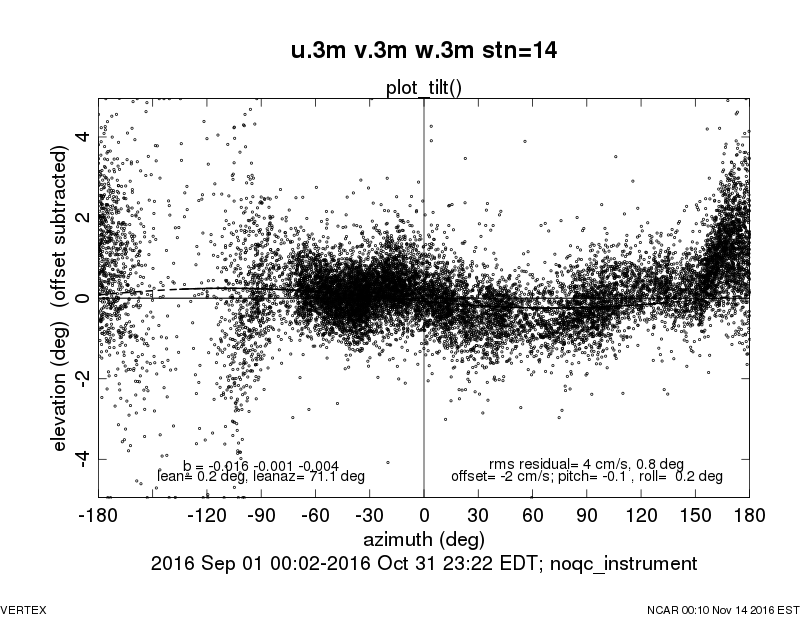
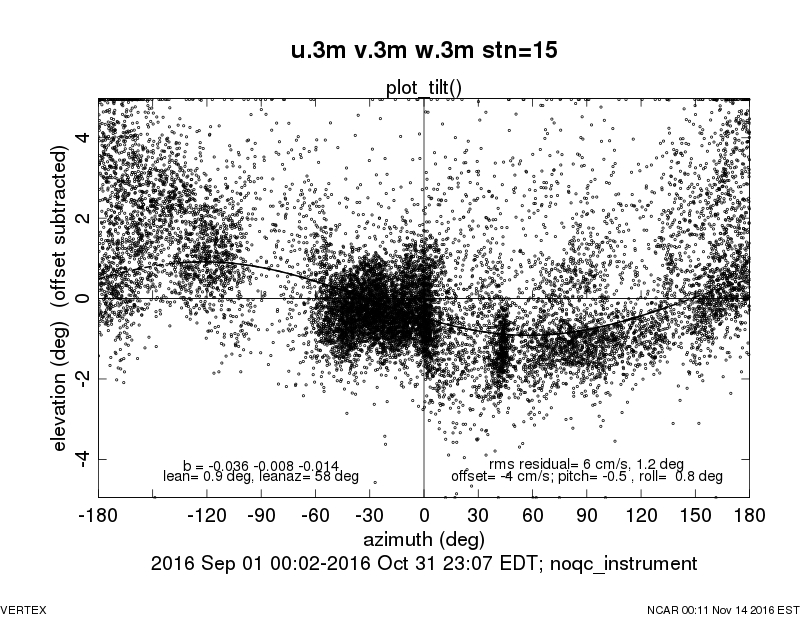
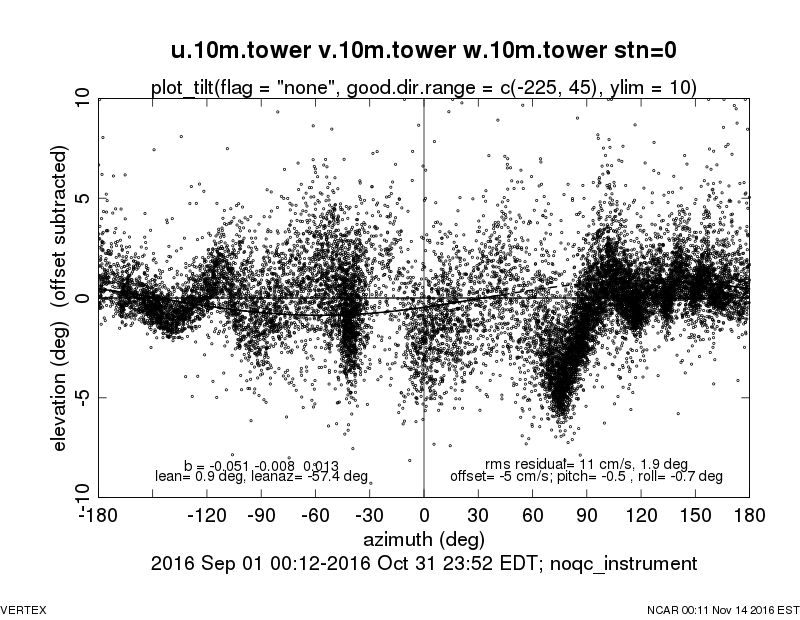
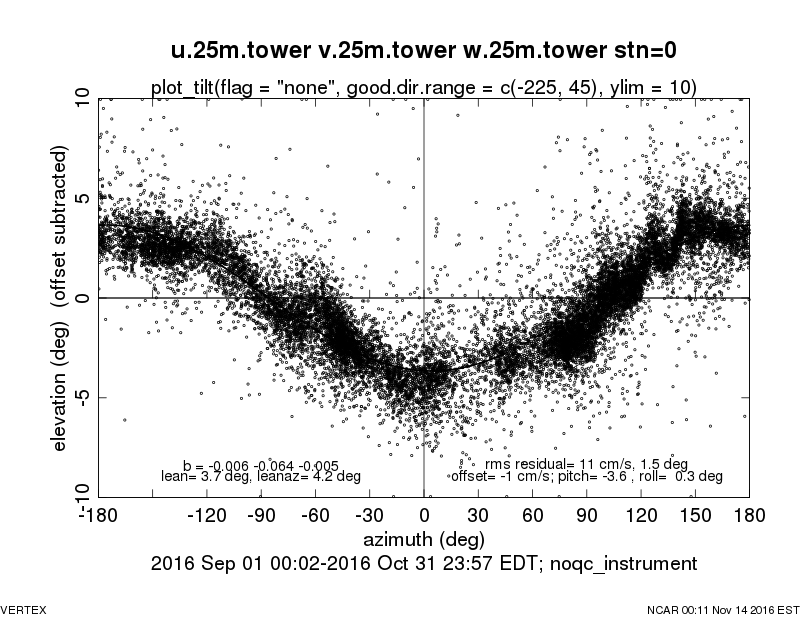
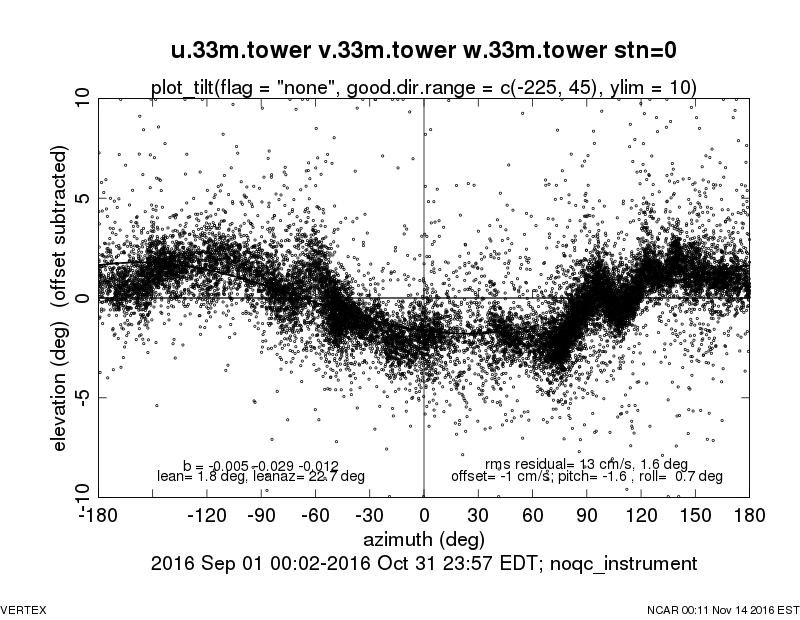
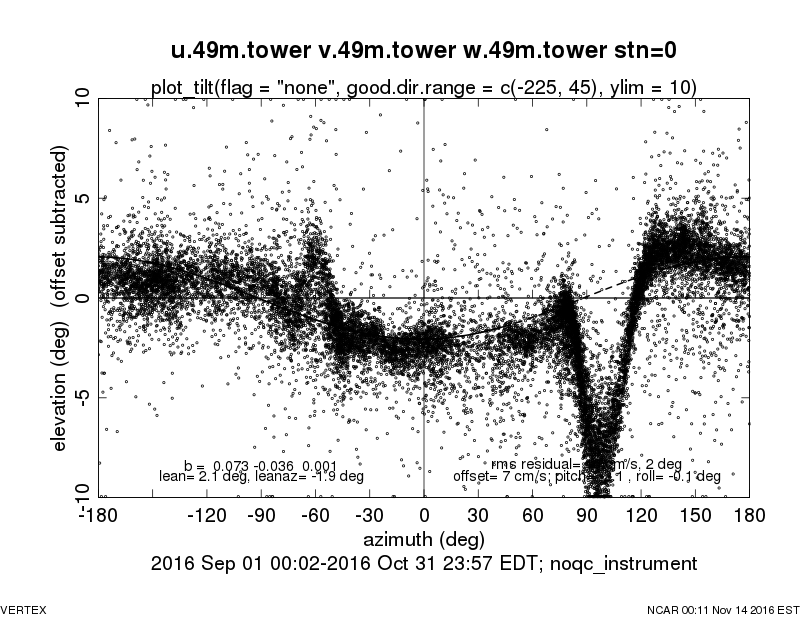
Sonic anemometer tilt analysis. See tilt corrections for more info.
s1, 3m s2, 3m s3, 3m s4, 3m s5, 3m
s6, 3m s7, 3m s8, 3m s9, 3m s10, 3m
s11, 3m s12, 3m s13, 3m s14, 3m s15, 3m
tower, 10m tower, 25m tower, 33m tower, 42m tower, 49m


Last modified: Tuesday, 22-Nov-2016
© NCAR/Earth Observing Laboratory
NCAR In situ Sensing Facility