| Previous day | Select day | Next day |
The most recent plots are generally updated every 15 minutes. Use the browser reload button to make sure you are seeing the latest version of a plot.
In order to distinquish the traces on the vertical profile plots, a slight offset in X is added to some traces. This is indicated by a "(n)" in the legend for the trace.
If you right-click on an image, most browsers will provide a menu to download or display the plot in another window.
P 20220512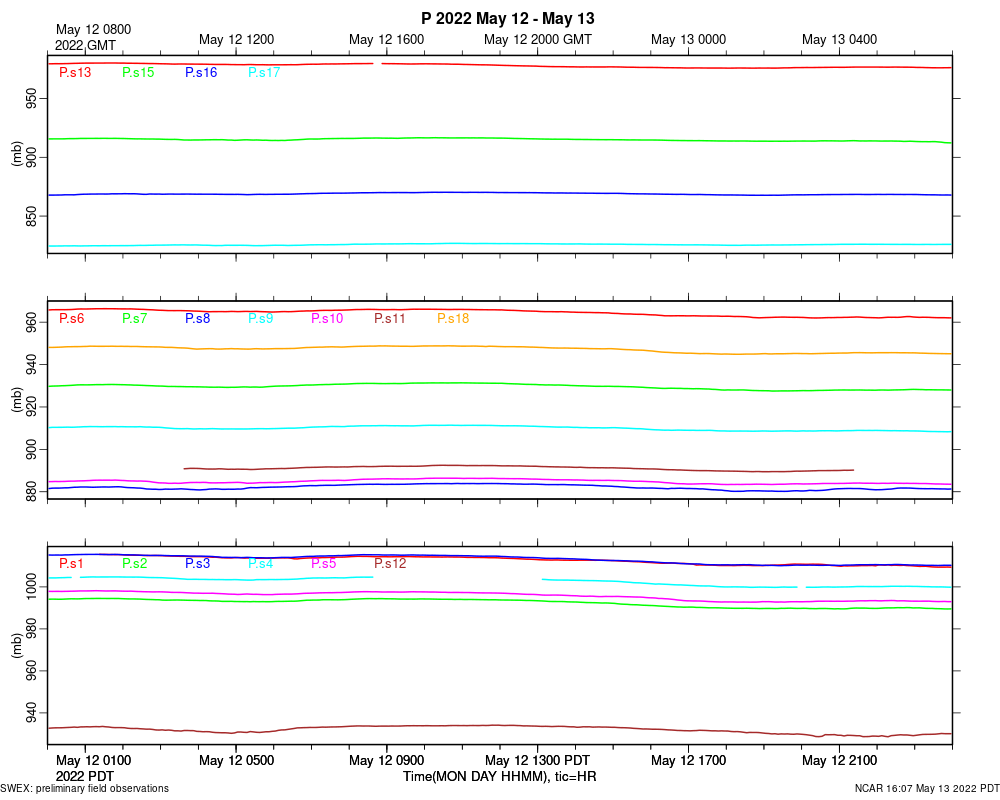
|
RH 20220512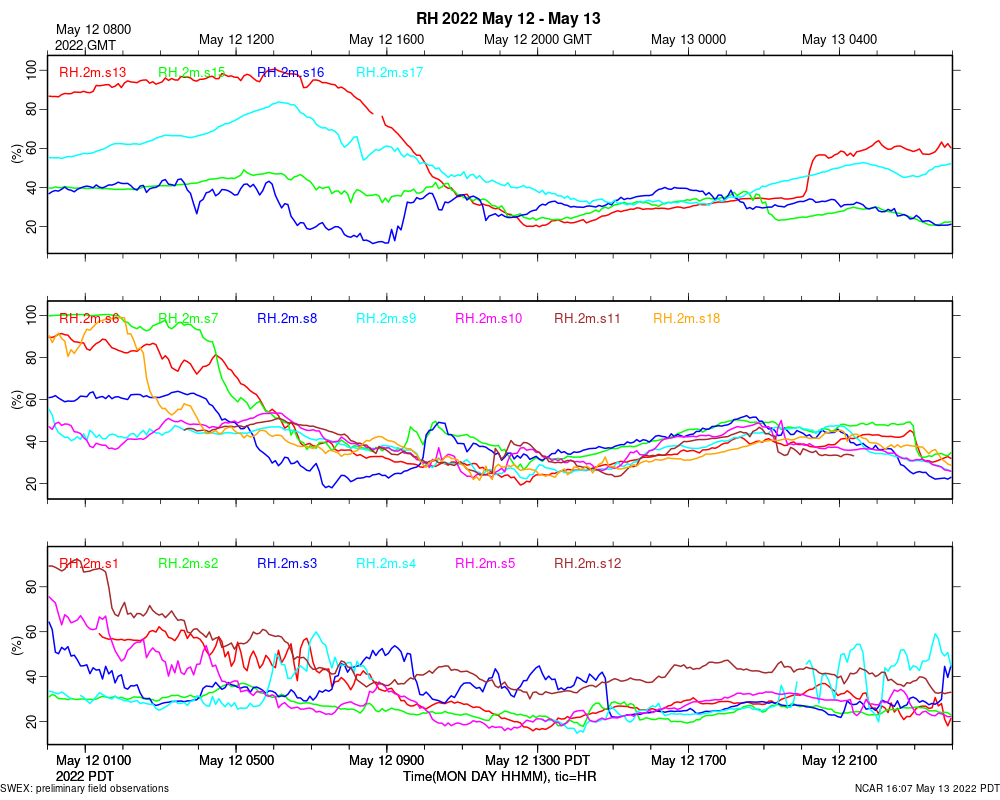
|
Rainr 20220512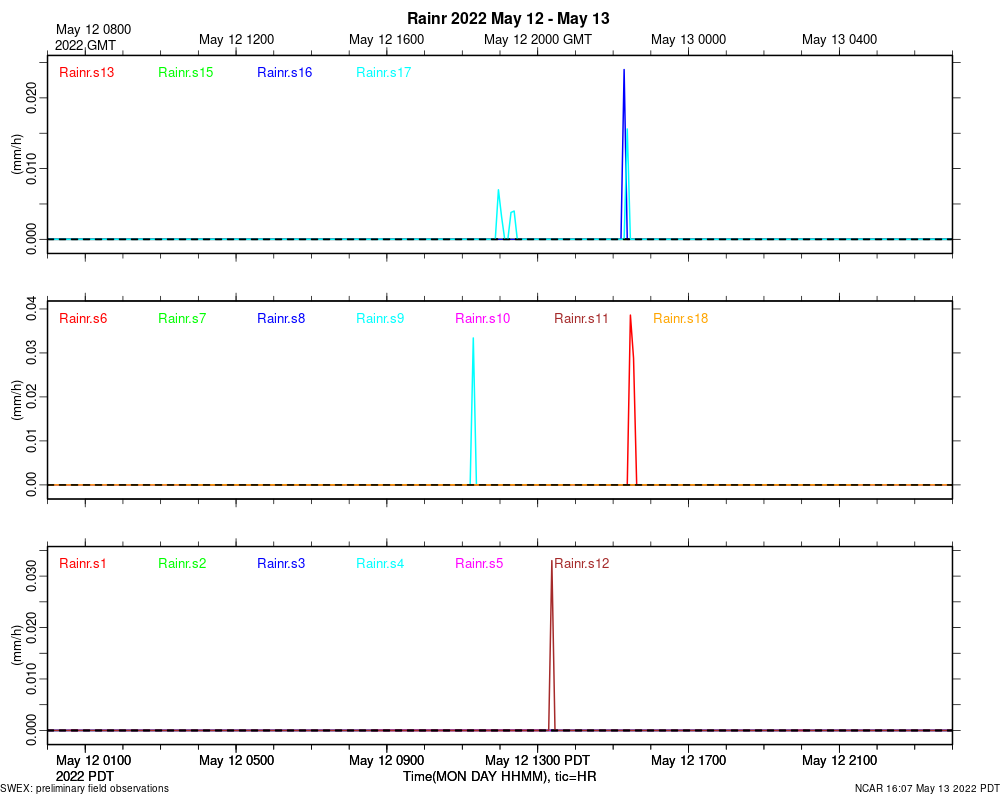
|
T 20220512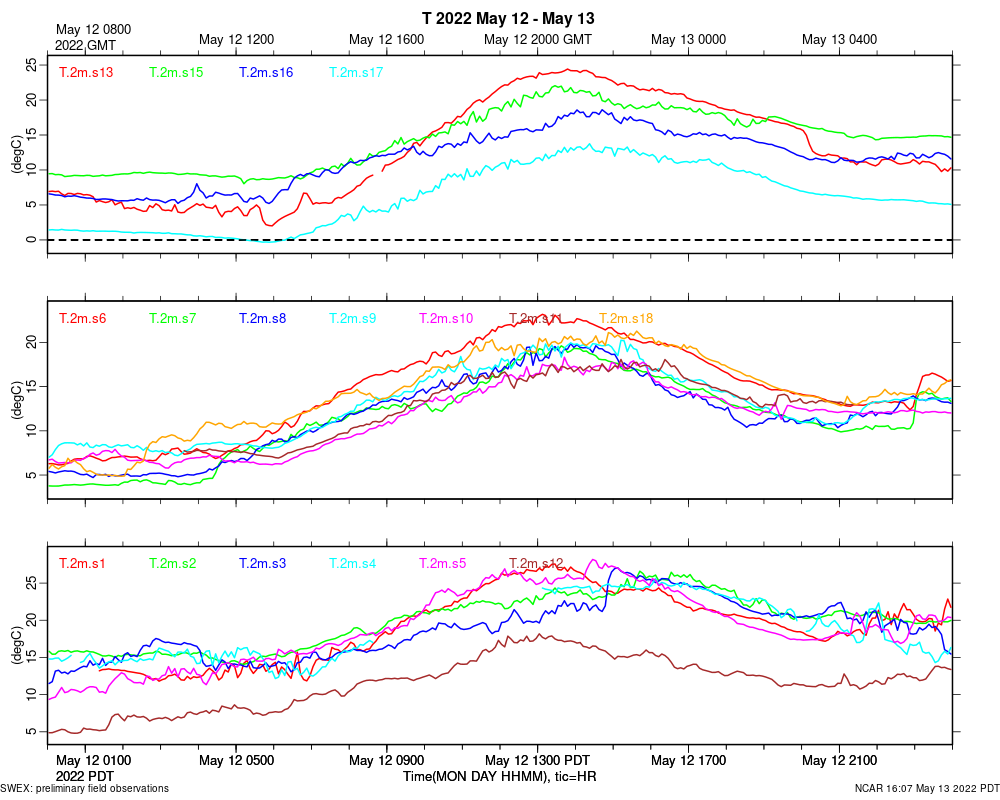
|
co2 20220512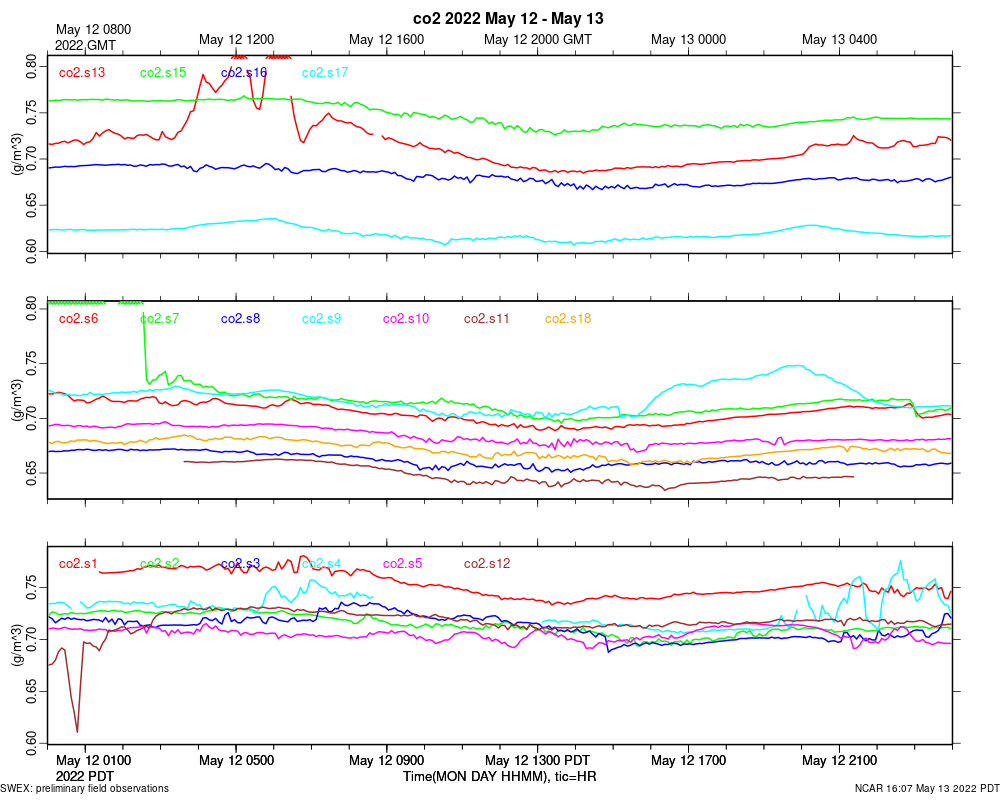
|
h2o 20220512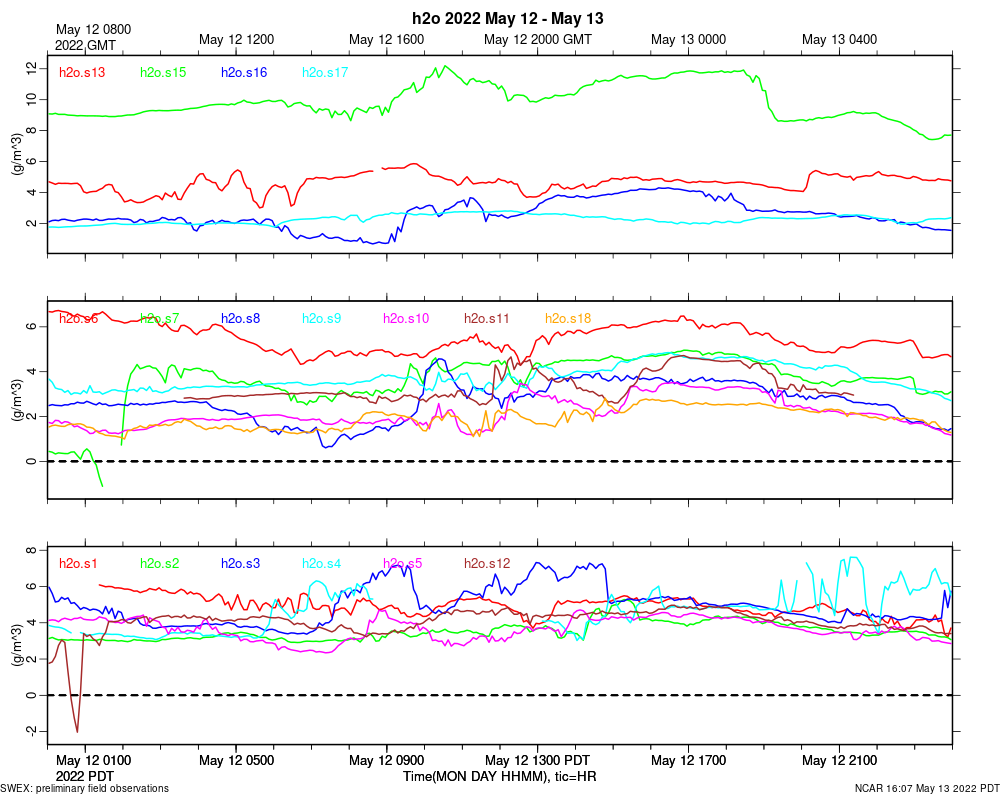
|
s01_soils 20220512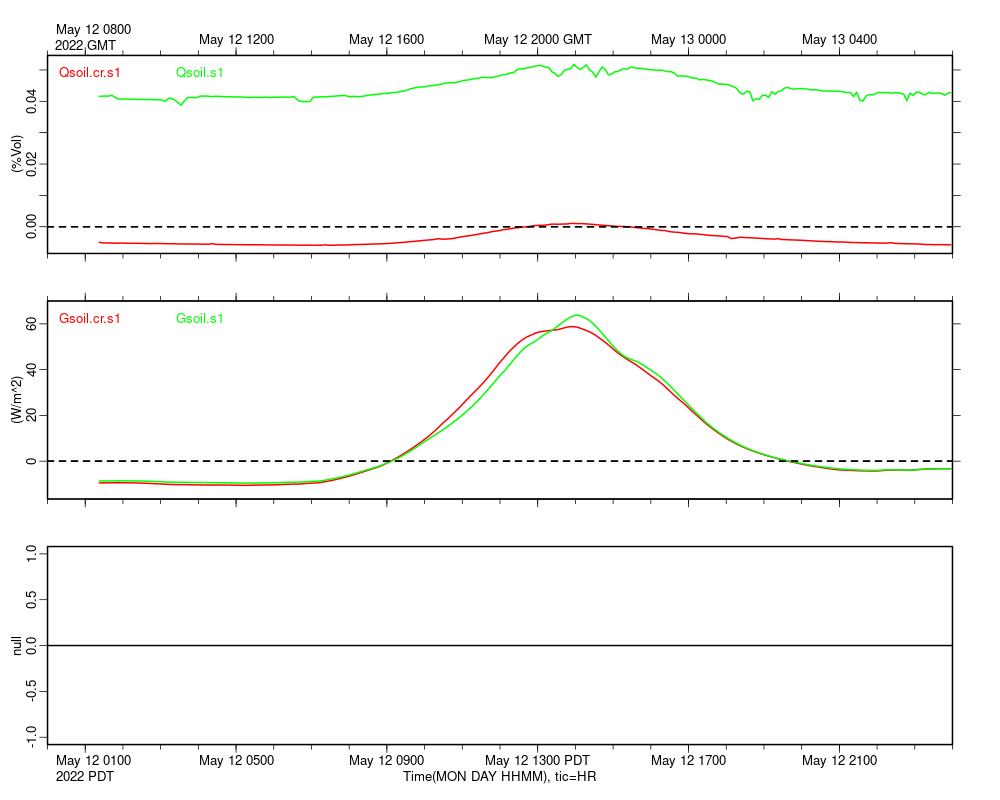
|
s01_weather 20220512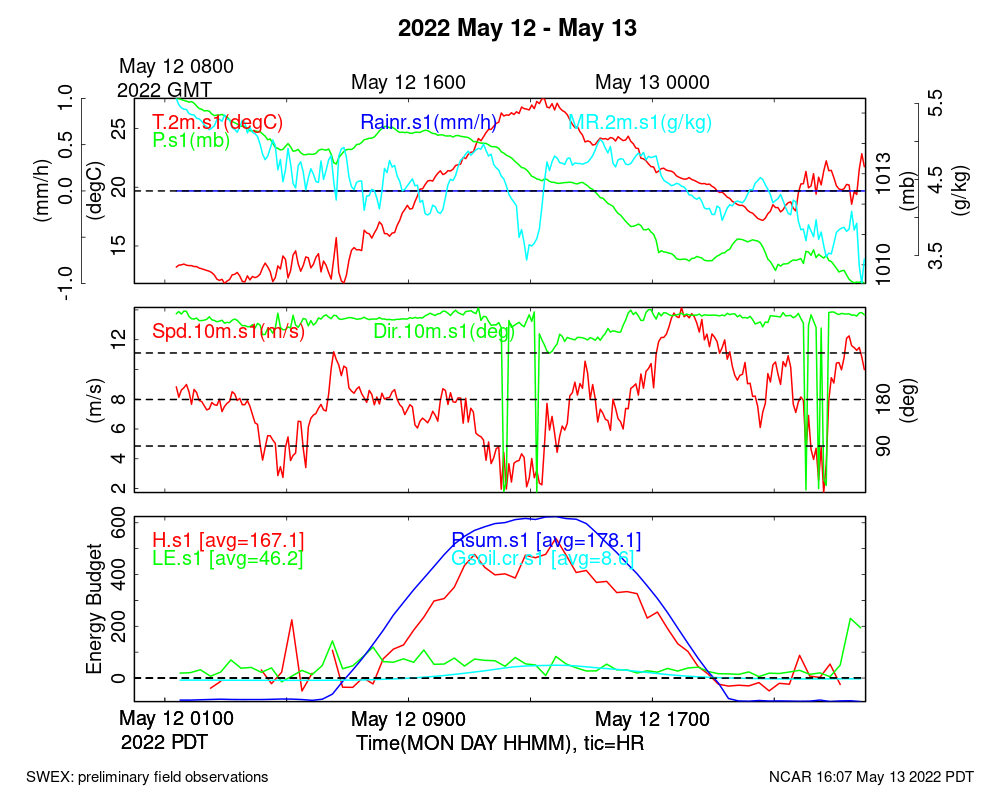
|
s02_soils 20220512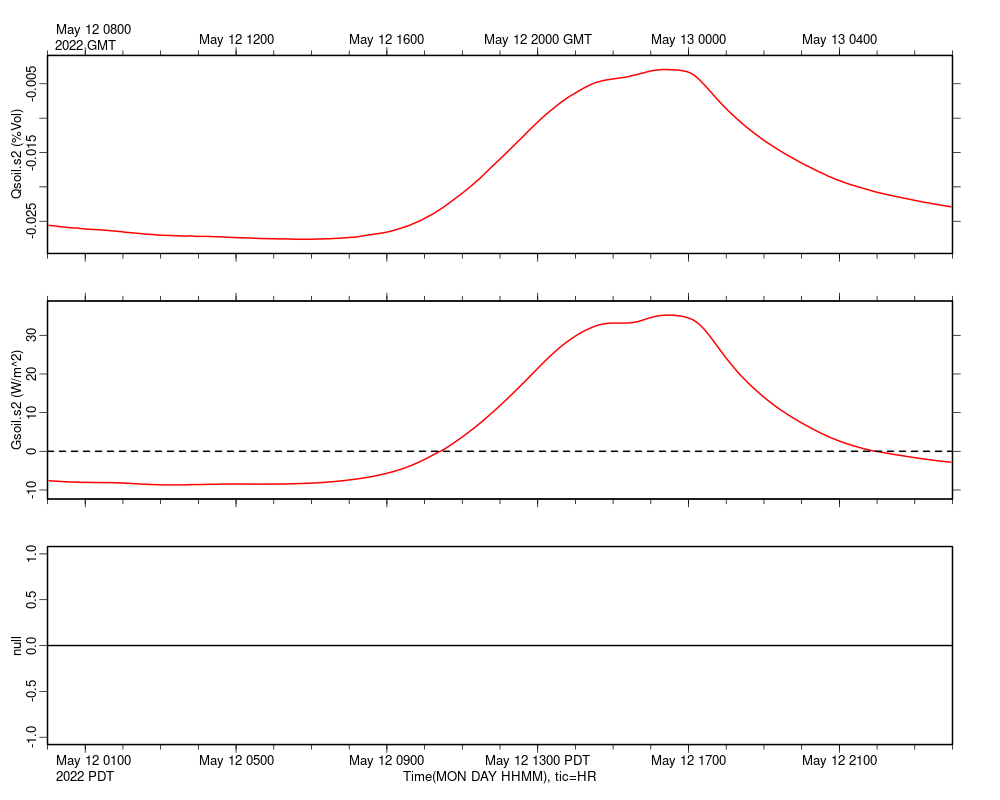
|
s02_weather 20220512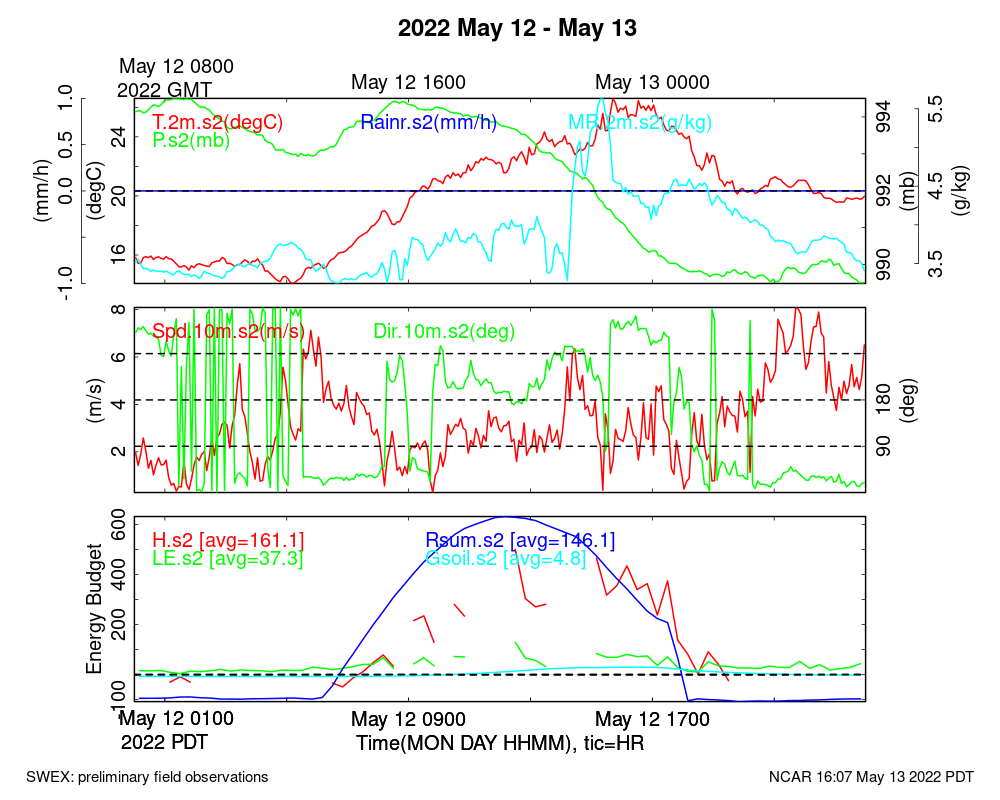
|
s03_soils 20220512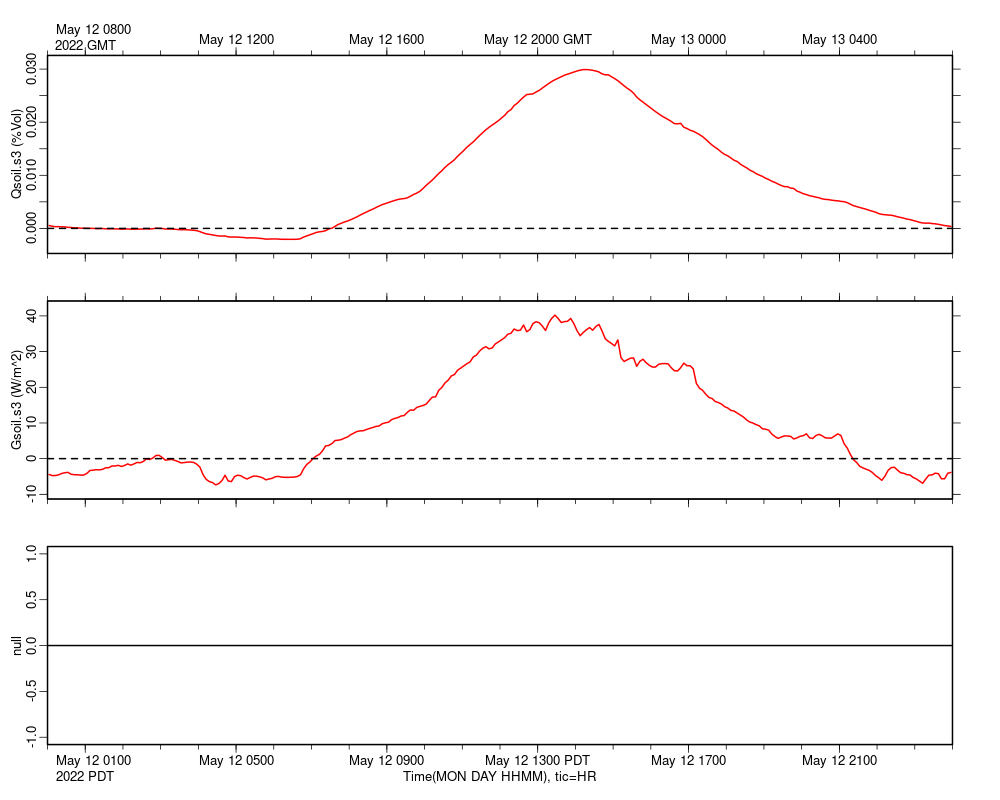
|
s03_weather 20220512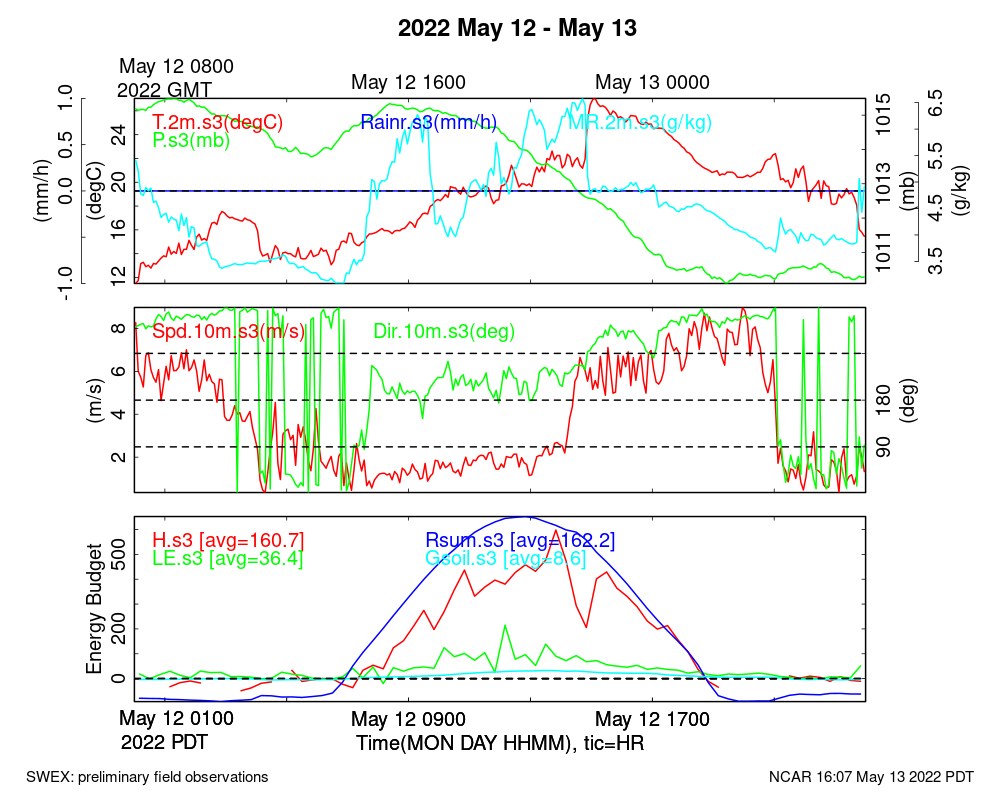
|
s04_soils 20220512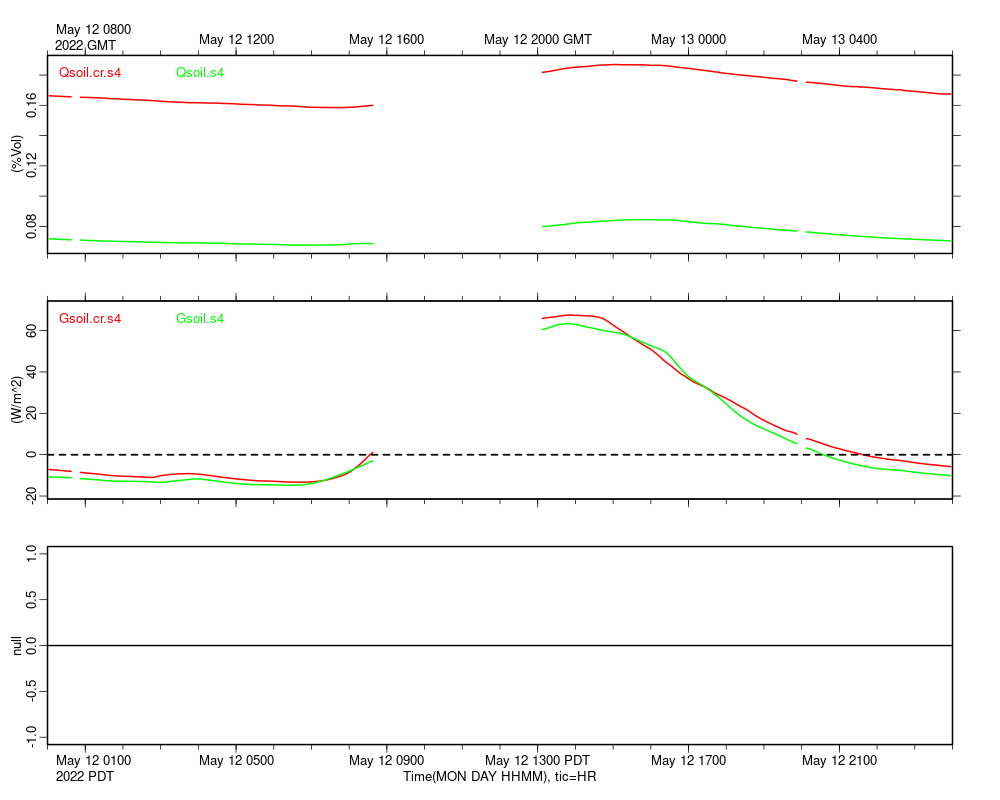
|
s04_weather 20220512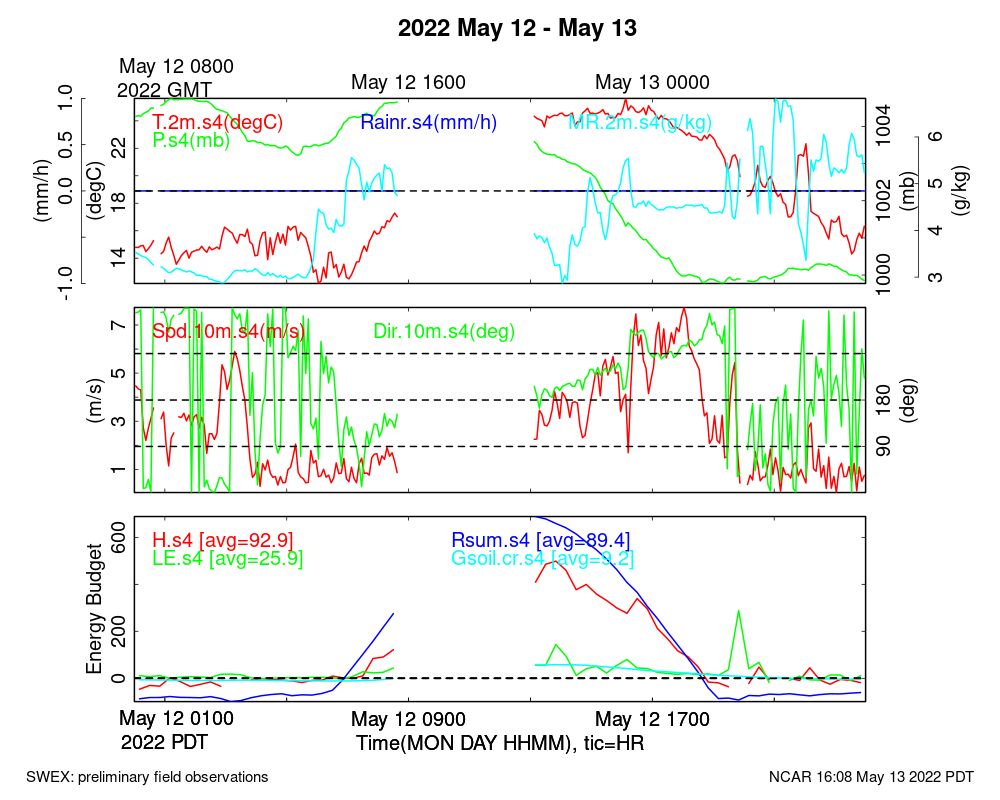
|
s05_soils 20220512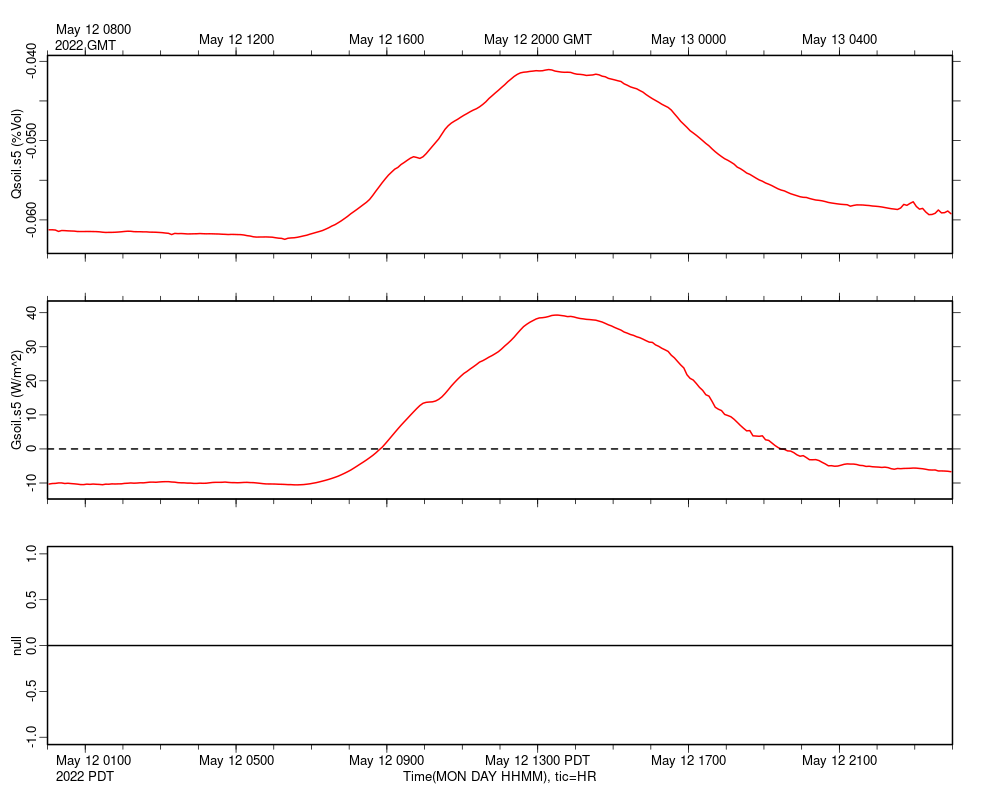
|
s05_weather 20220512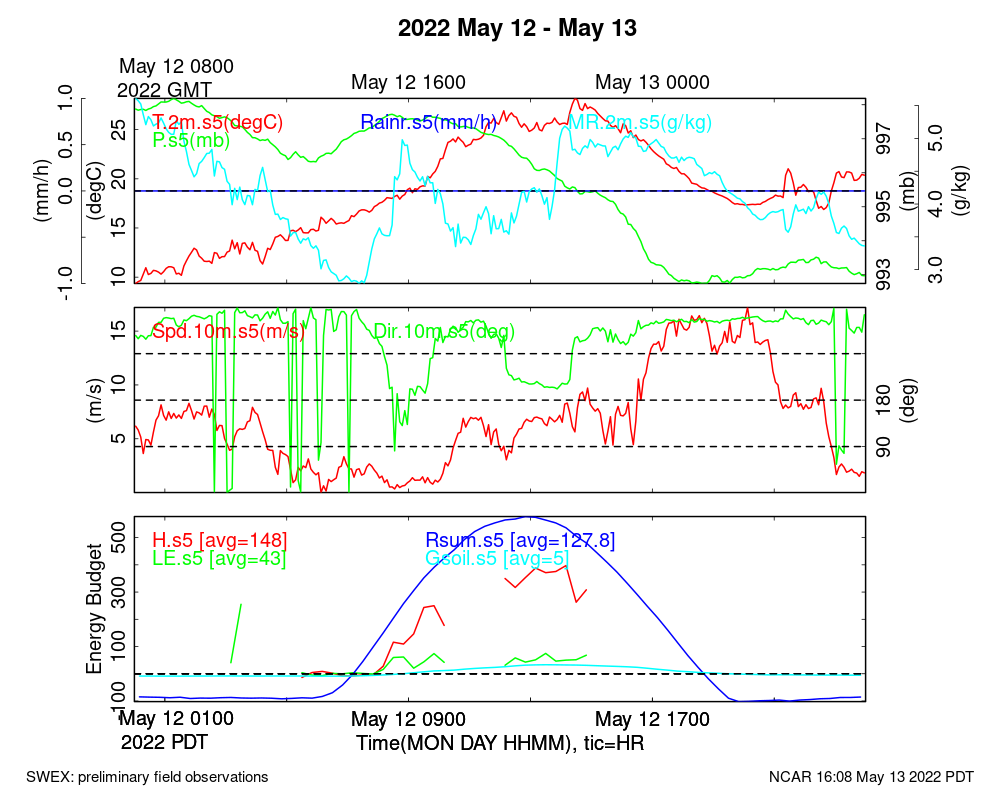
|
s06_soils 20220512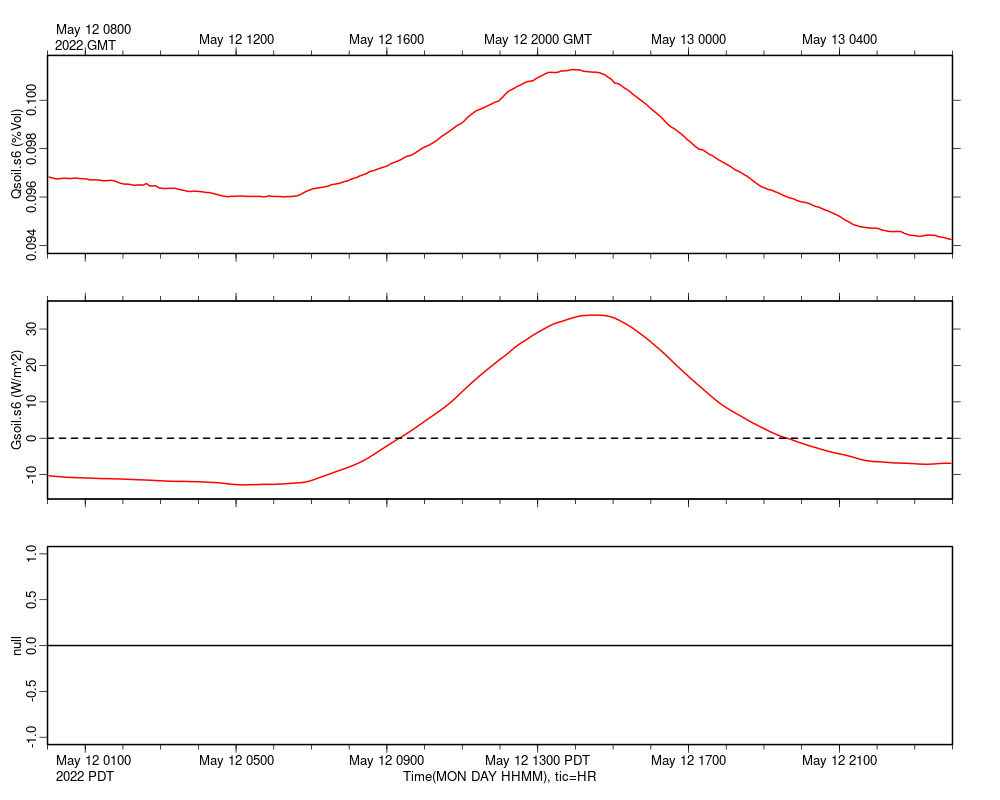
|
s06_weather 20220512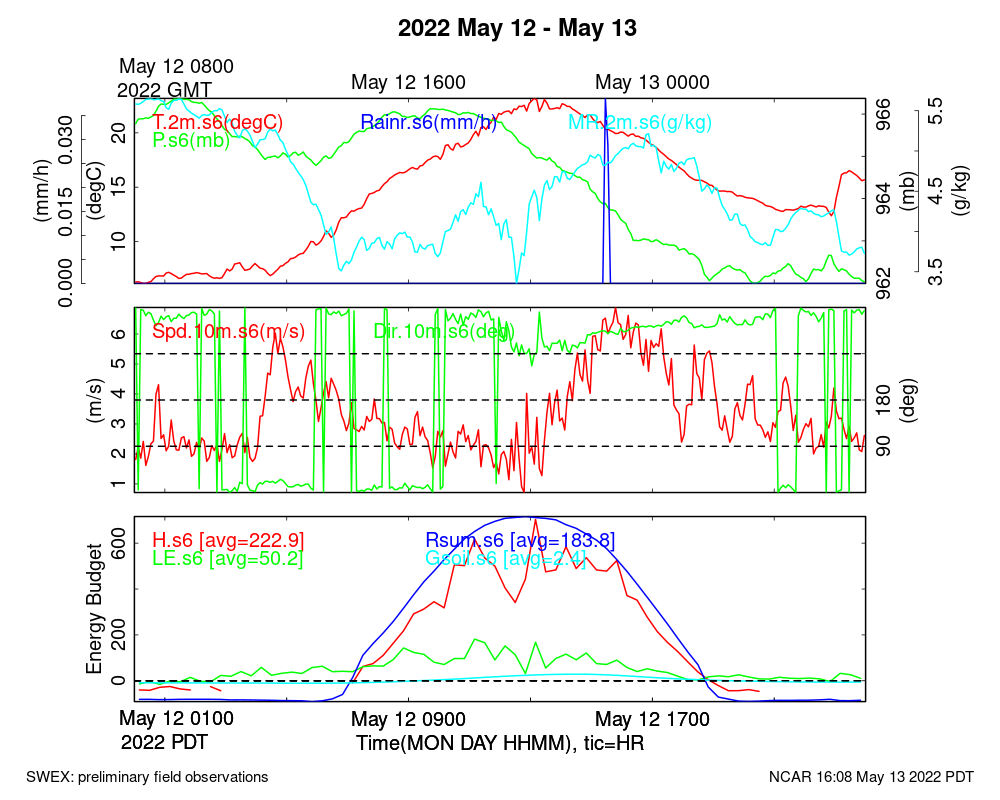
|
s07_soils 20220512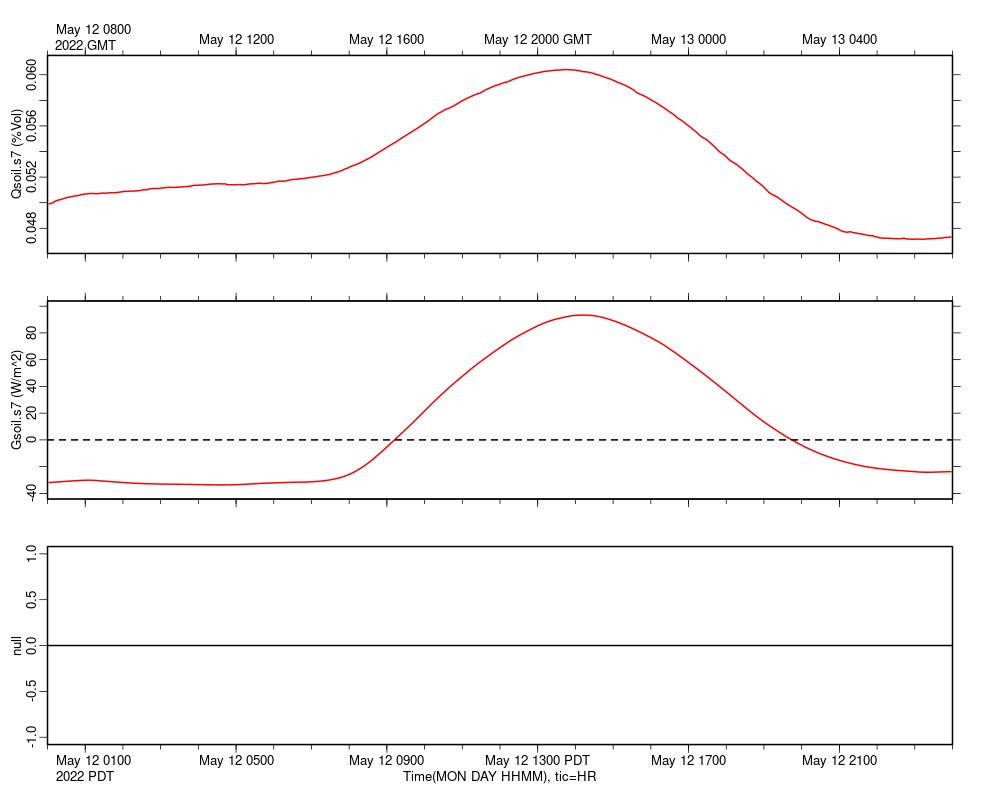
|
s07_weather 20220512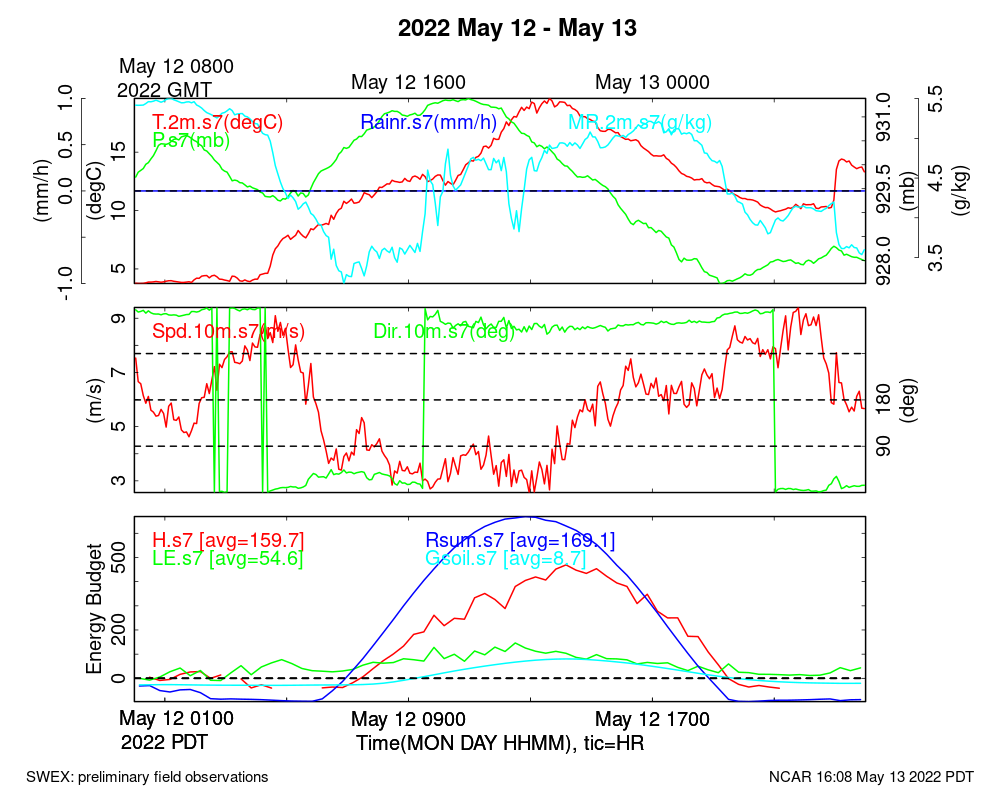
|
s08_soils 20220512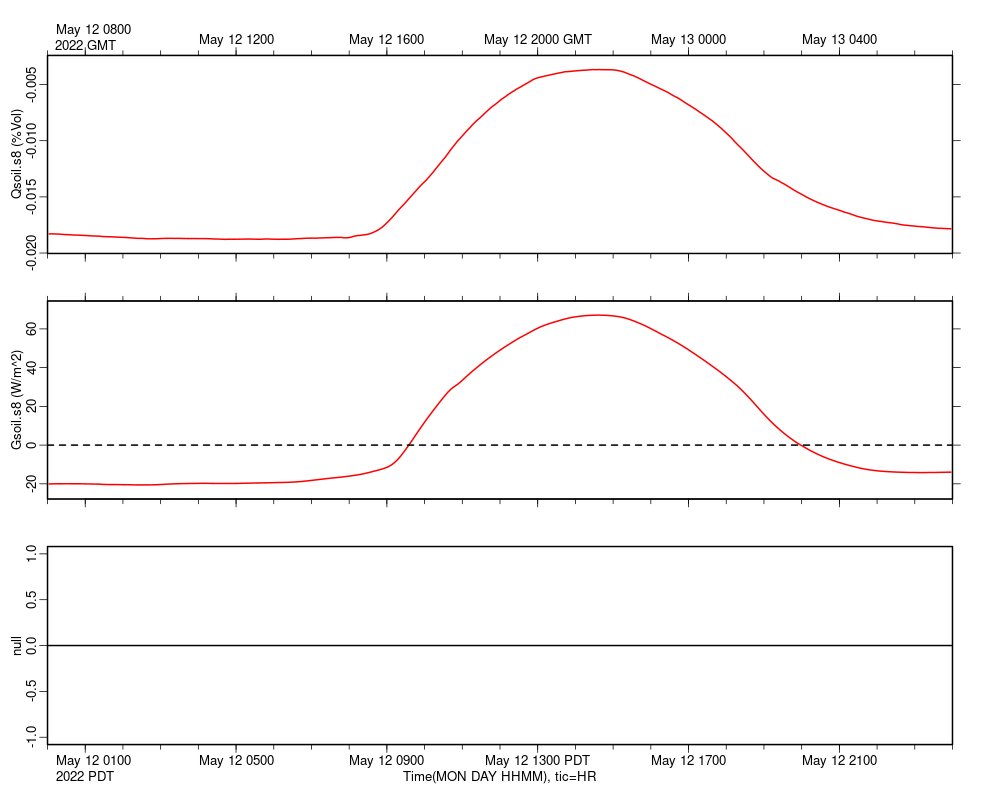
|
s08_weather 20220512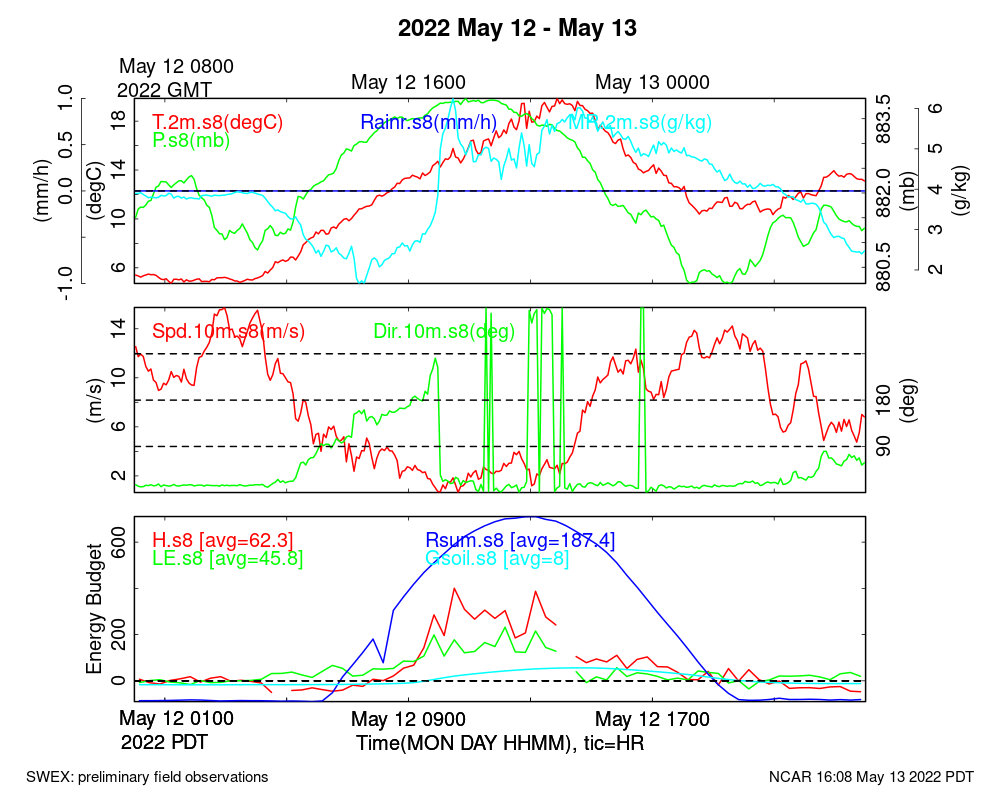
|
s09_soils 20220512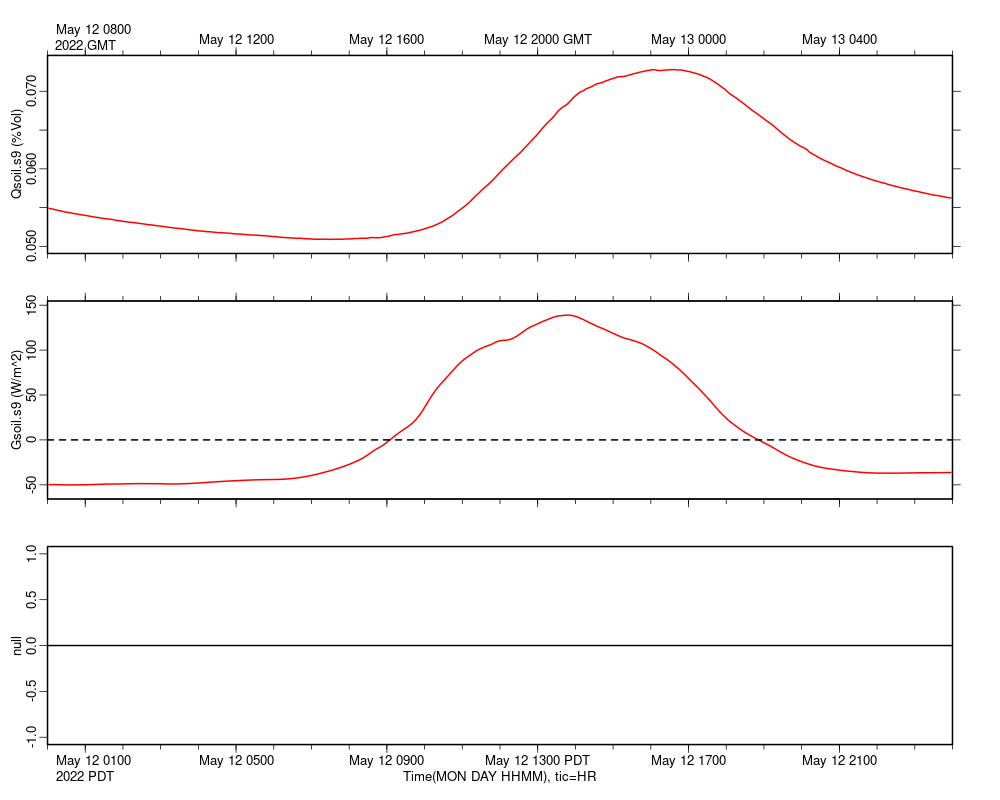
|
s09_weather 20220512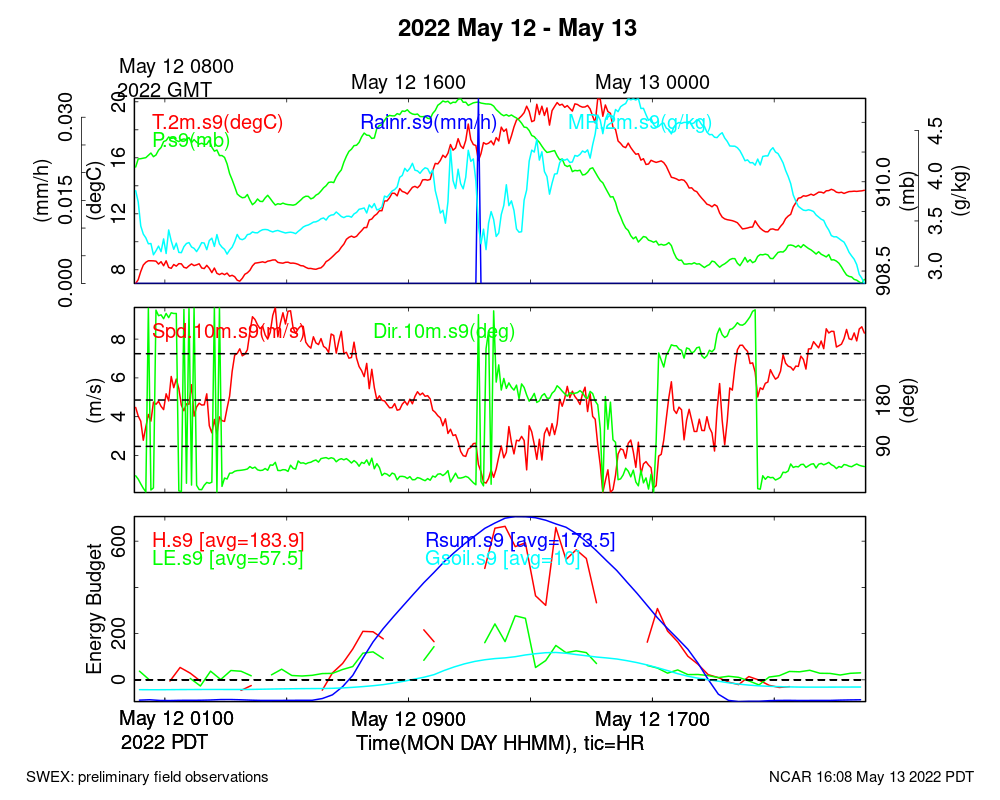
|
s10_soils 20220512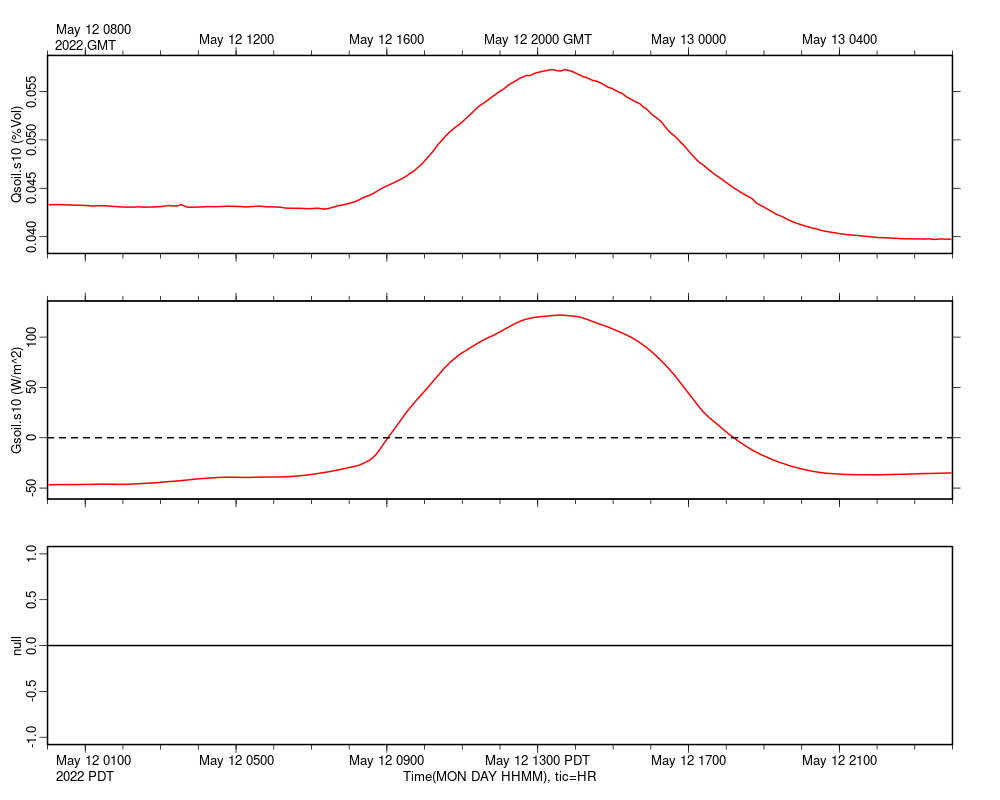
|
s10_weather 20220512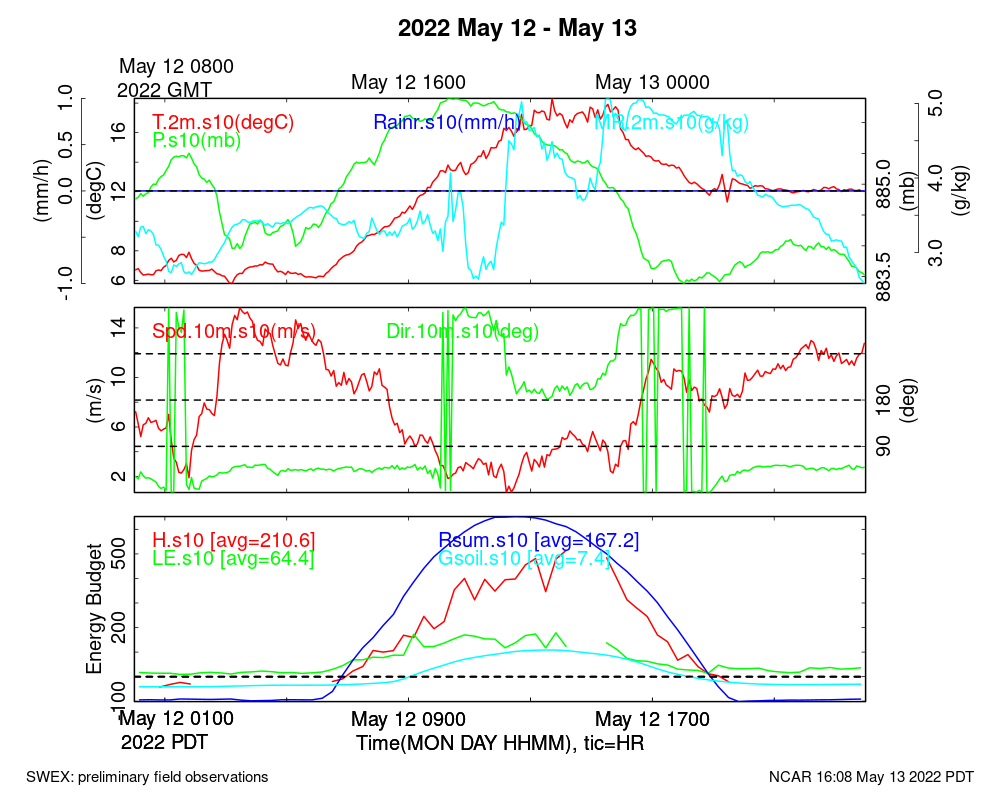
|
s11_soils 20220512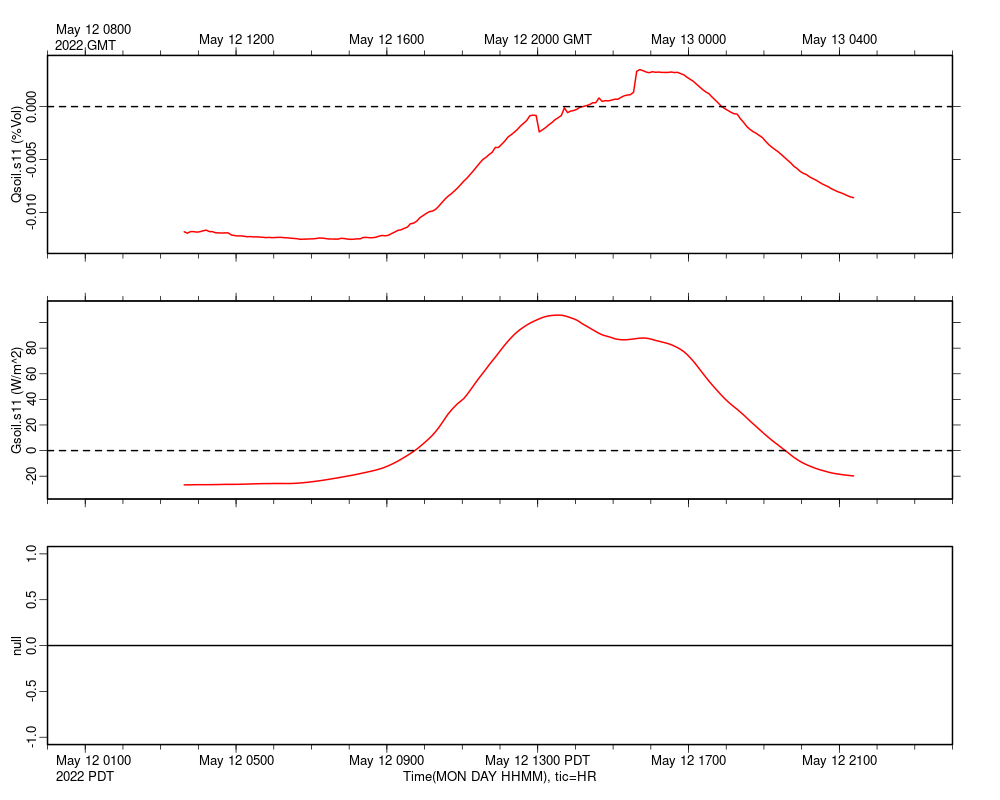
|
s11_weather 20220512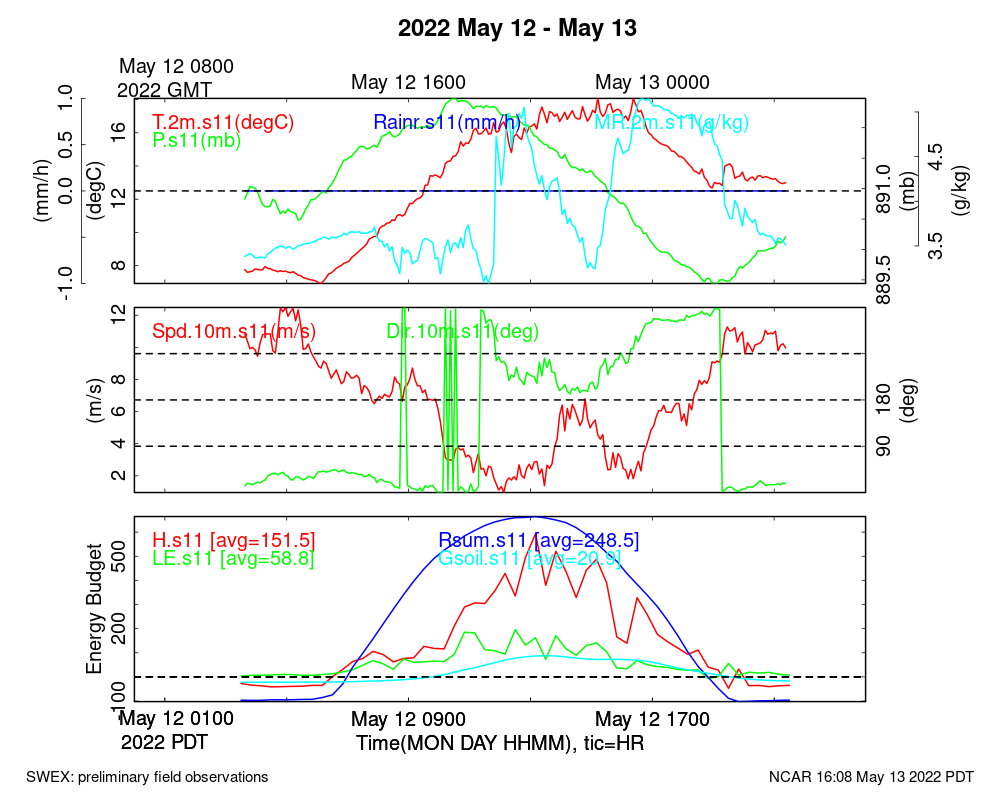
|
s12_soils 20220512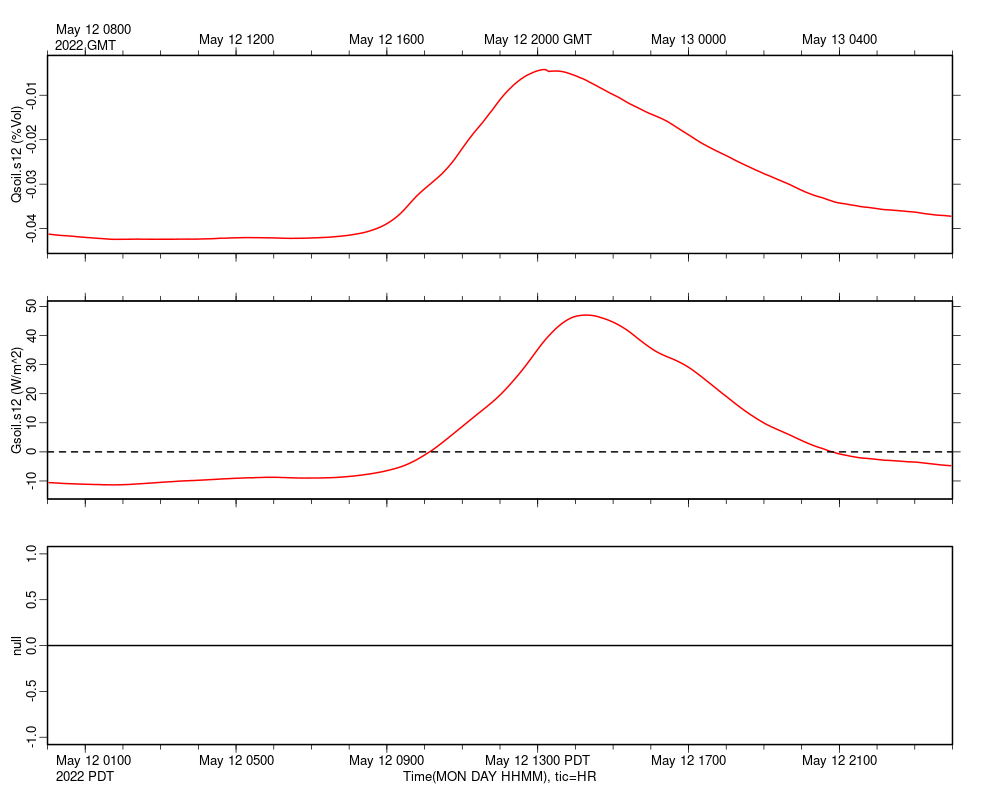
|
s12_weather 20220512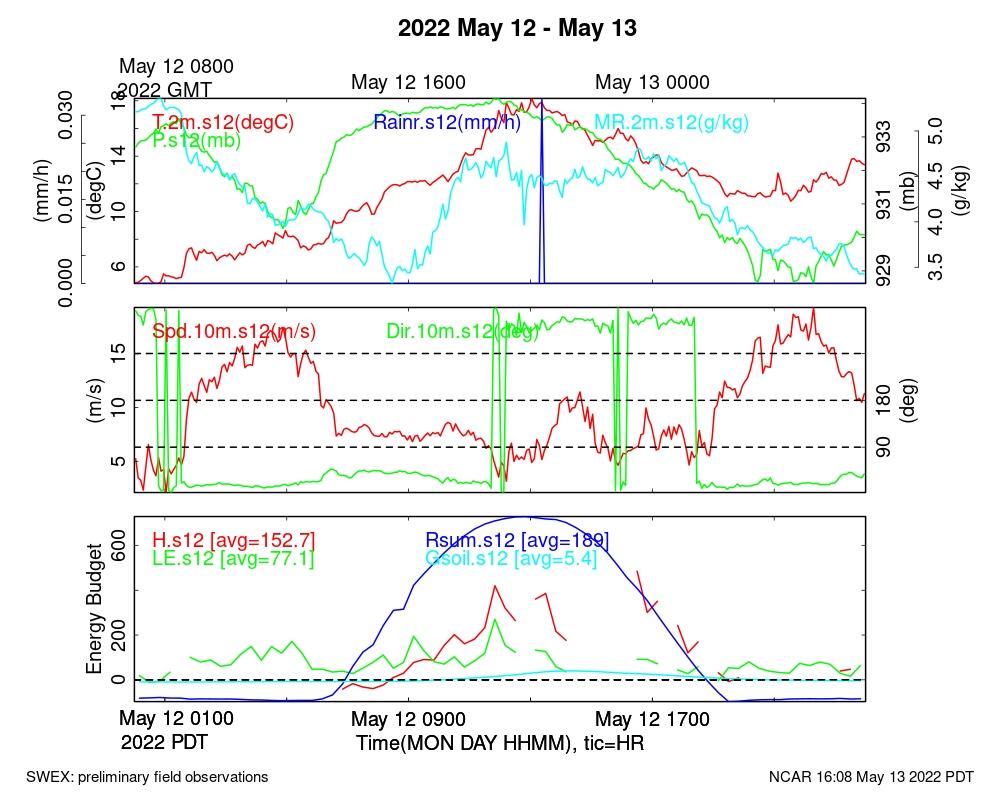
|
s13_soils 20220512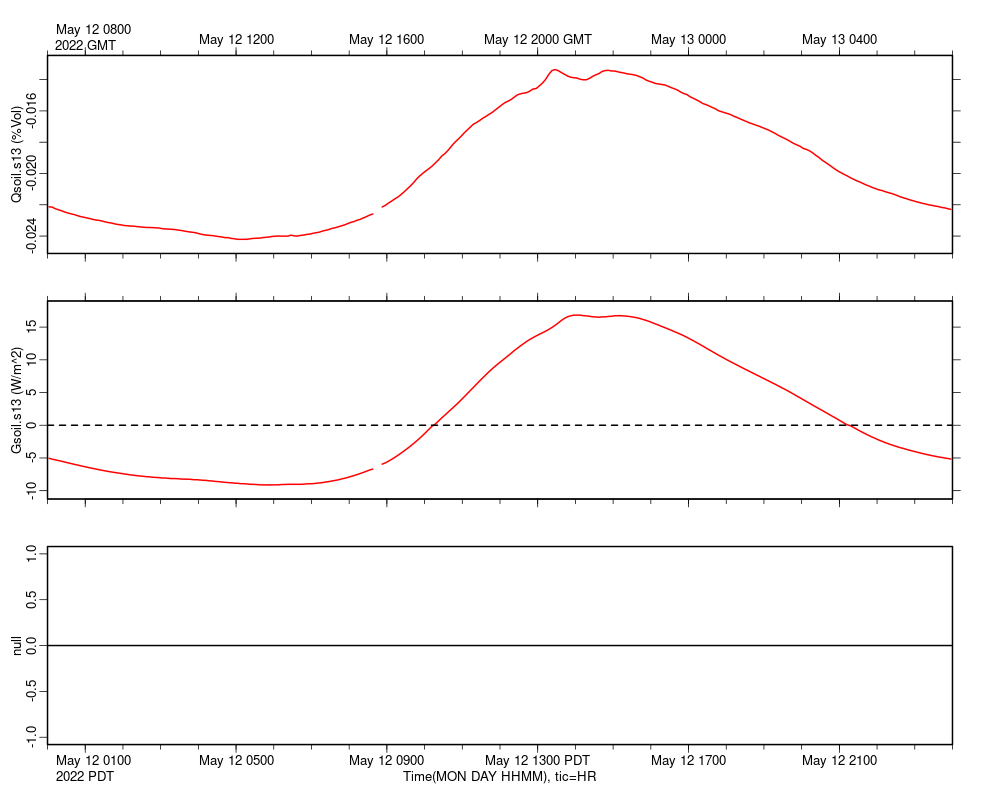
|
s13_weather 20220512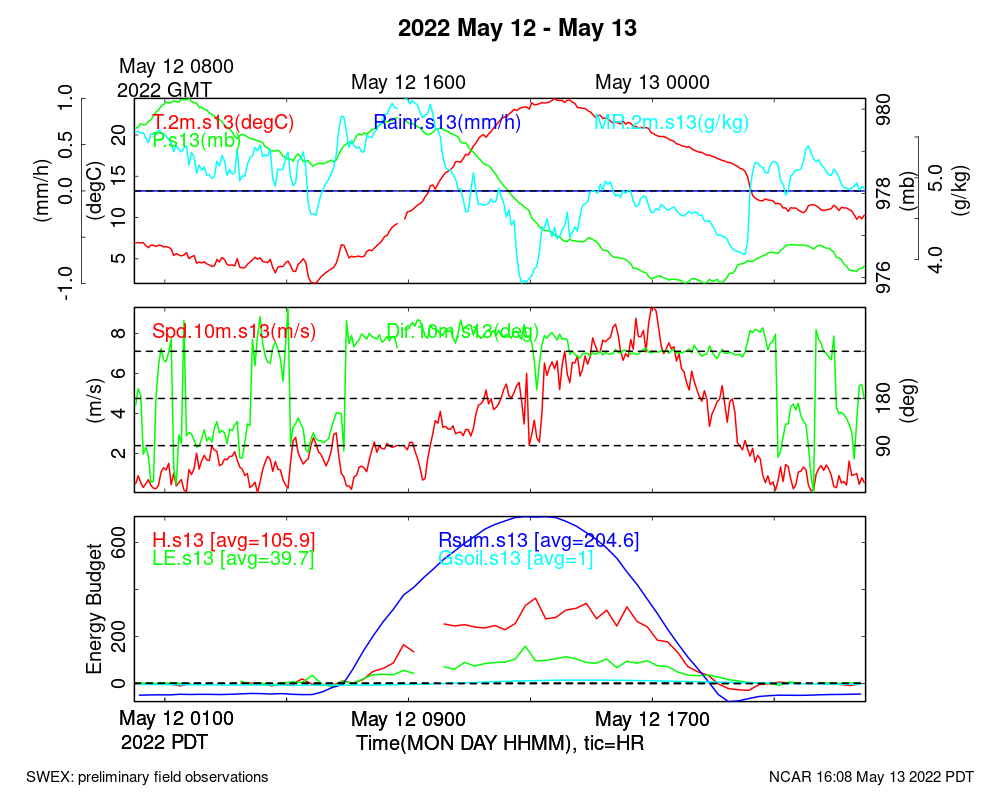
|
s14_soils 20220512
|
s15_soils 20220512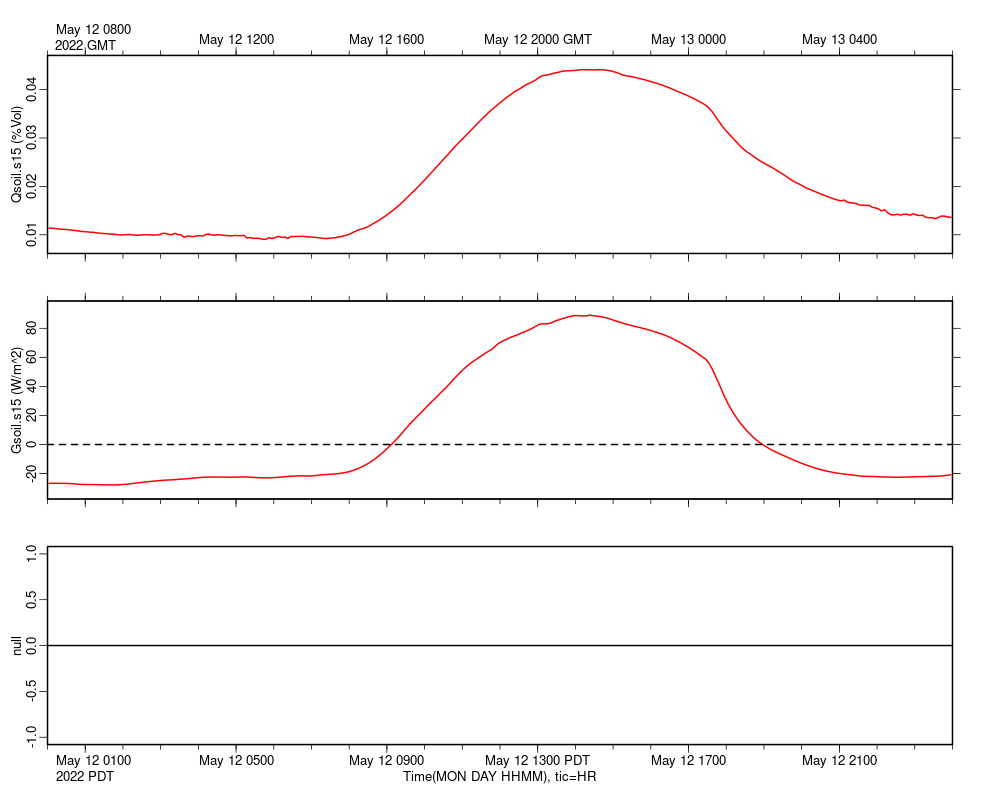
|
s16_soils 20220512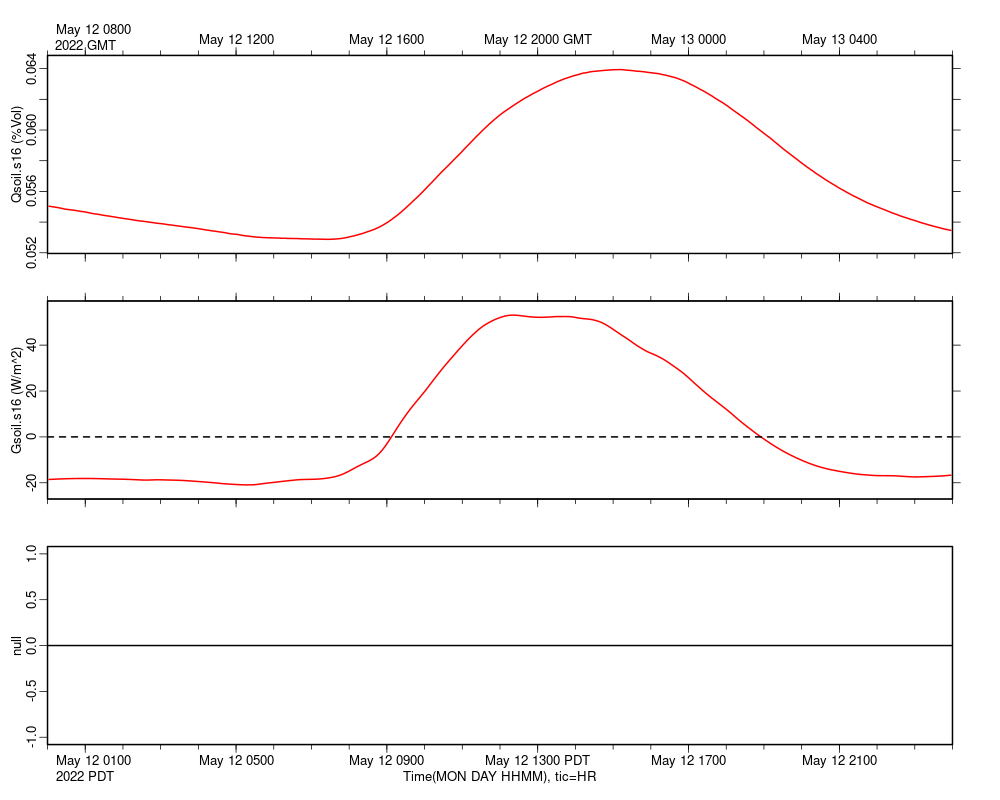
|
s17_soils 20220512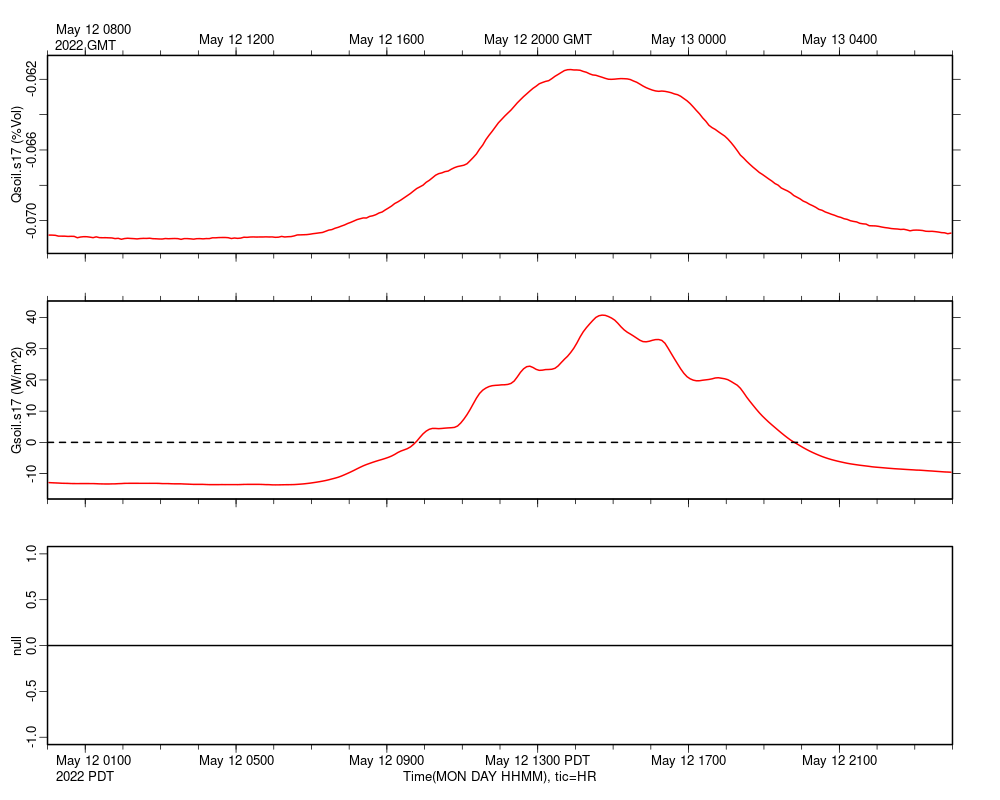
|
s18_soils 20220512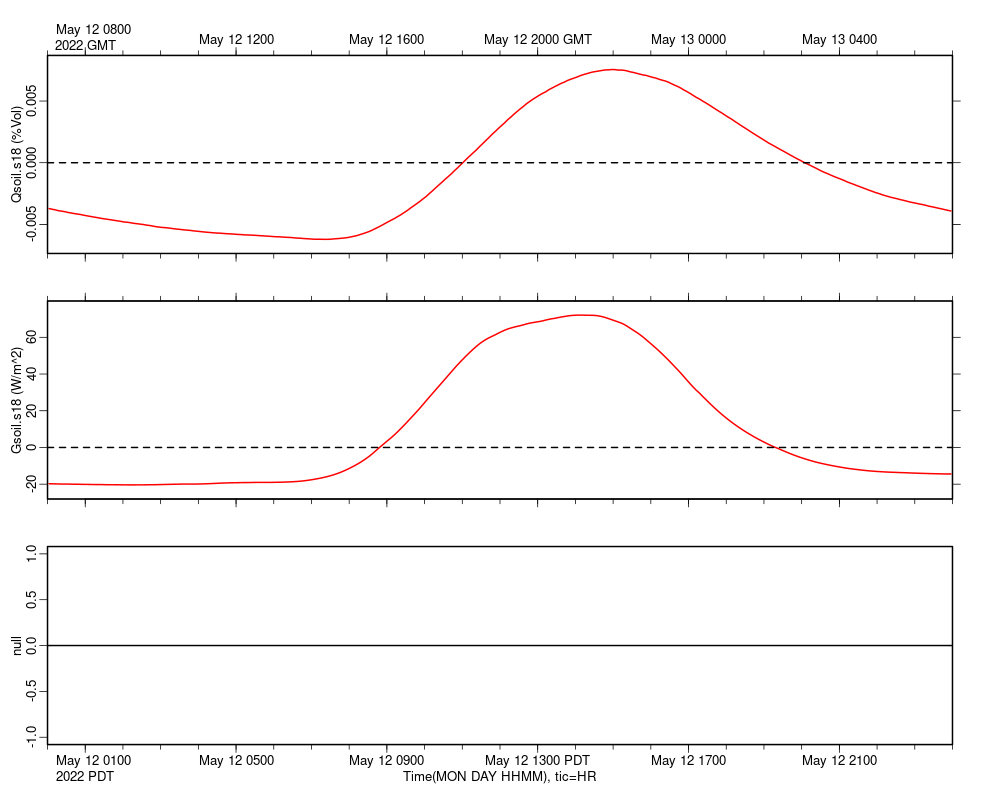
|
spd 20220512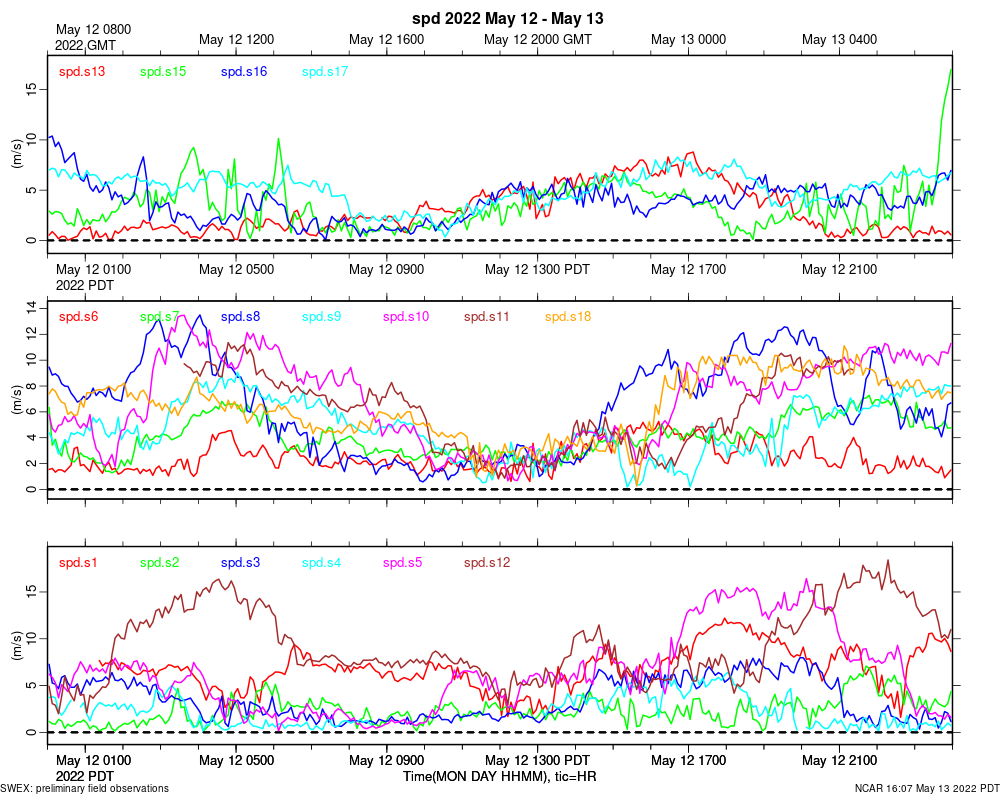
|
tc 20220512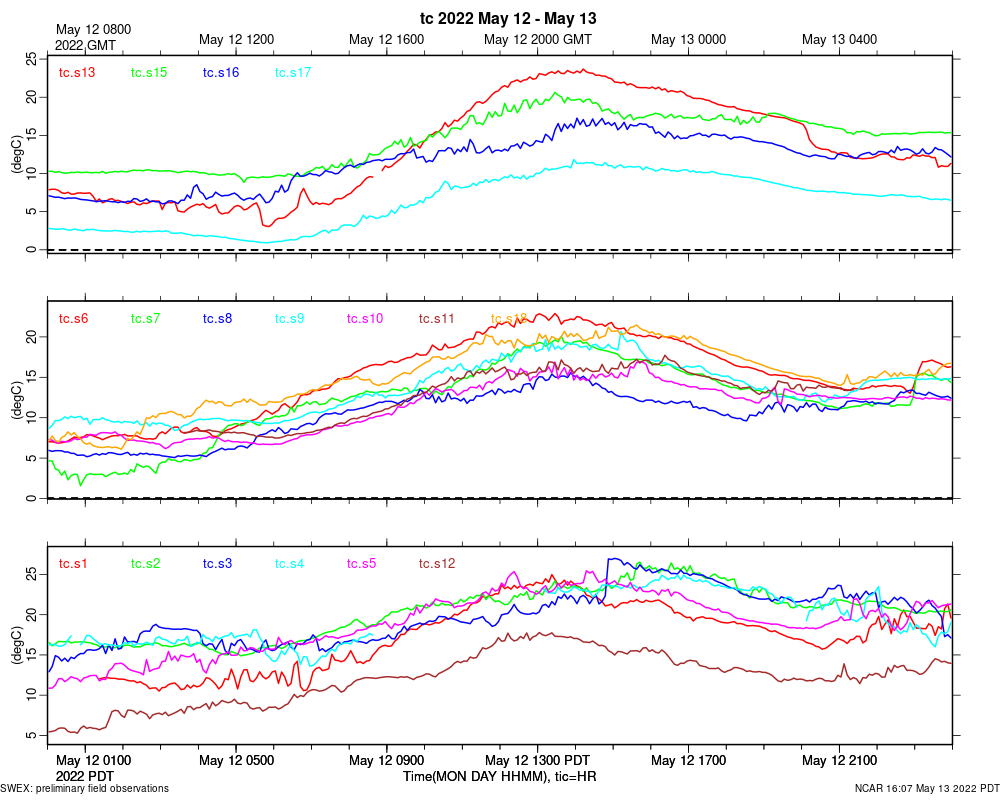
|