| Previous day | Select day | Next day |
The most recent plots are generally updated every 15 minutes. Use the browser reload button to make sure you are seeing the latest version of a plot.
In order to distinquish the traces on the vertical profile plots, a slight offset in X is added to some traces. This is indicated by a "(n)" in the legend for the trace.
If you right-click on an image, most browsers will provide a menu to download or display the plot in another window.
photo 20230320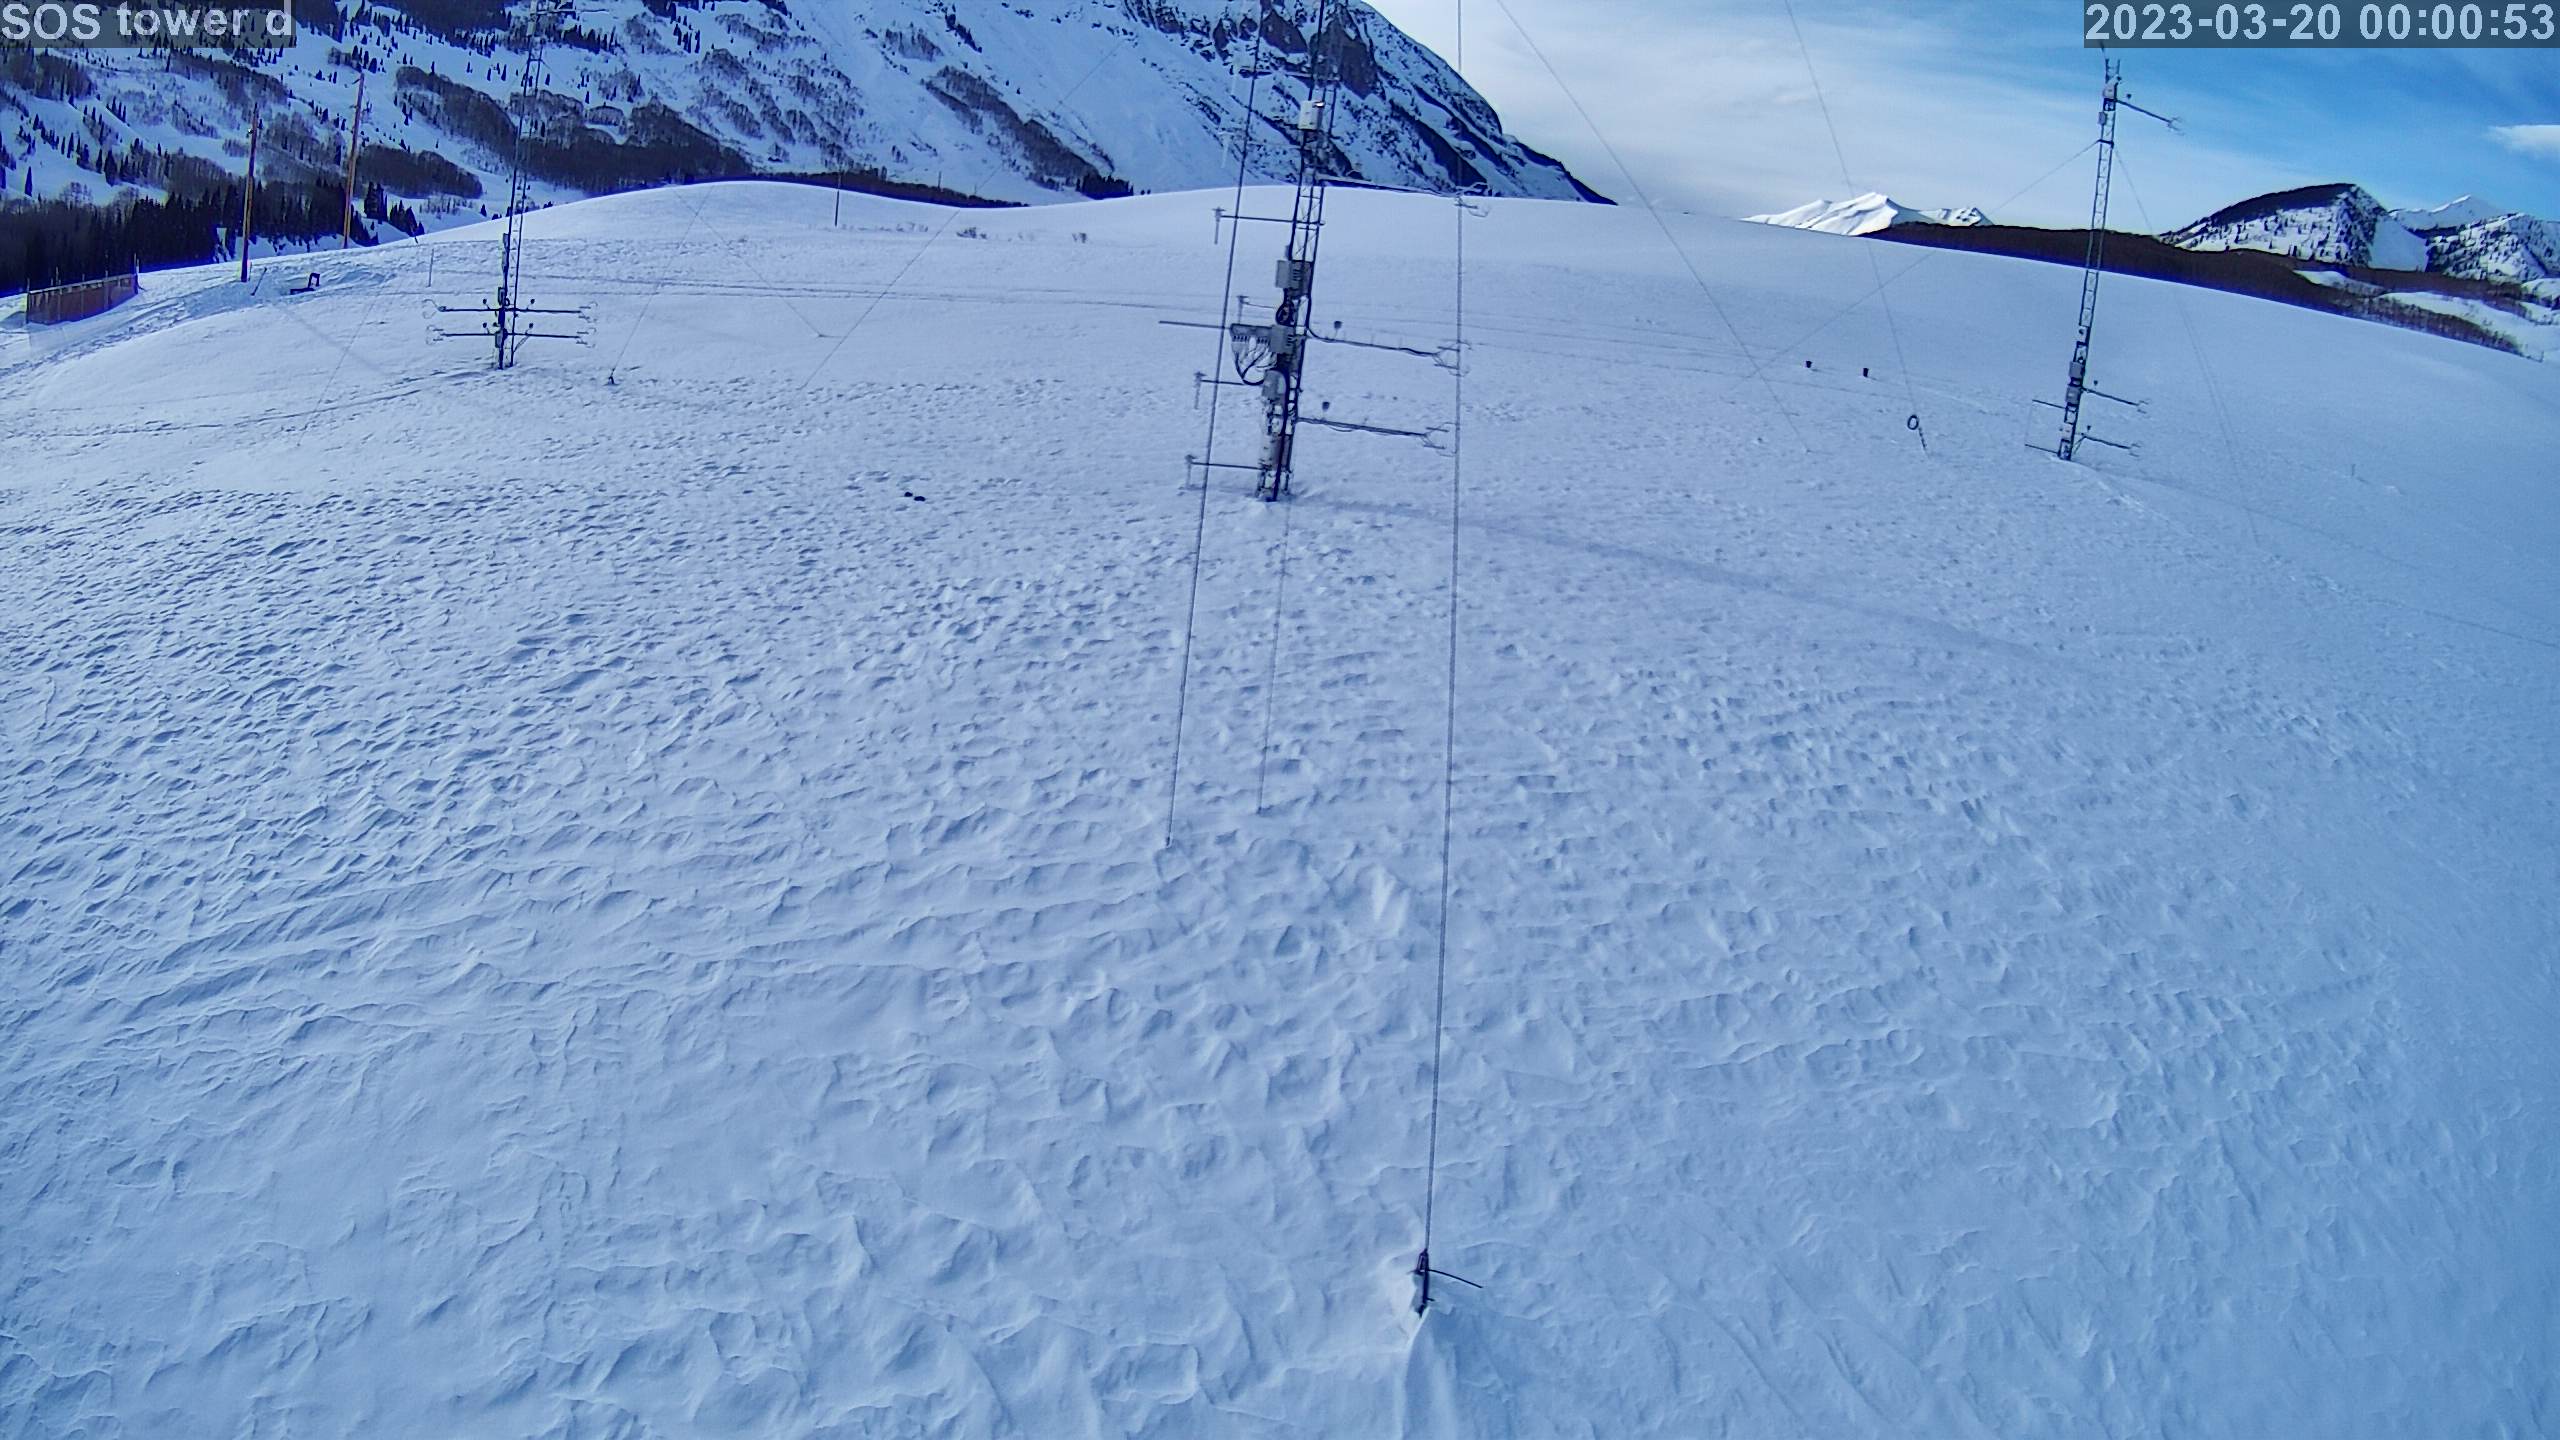
|
photo 2023032001
|
photo 2023032002
|
photo 2023032003
|
photo 2023032004
|
photo 2023032005
|
photo 2023032006
|
photo 2023032007
|
photo 2023032008
|
photo 2023032009
|
photo 2023032010
|
photo 2023032011
|
photo 2023032012
|
photo 2023032013
|
photo 2023032014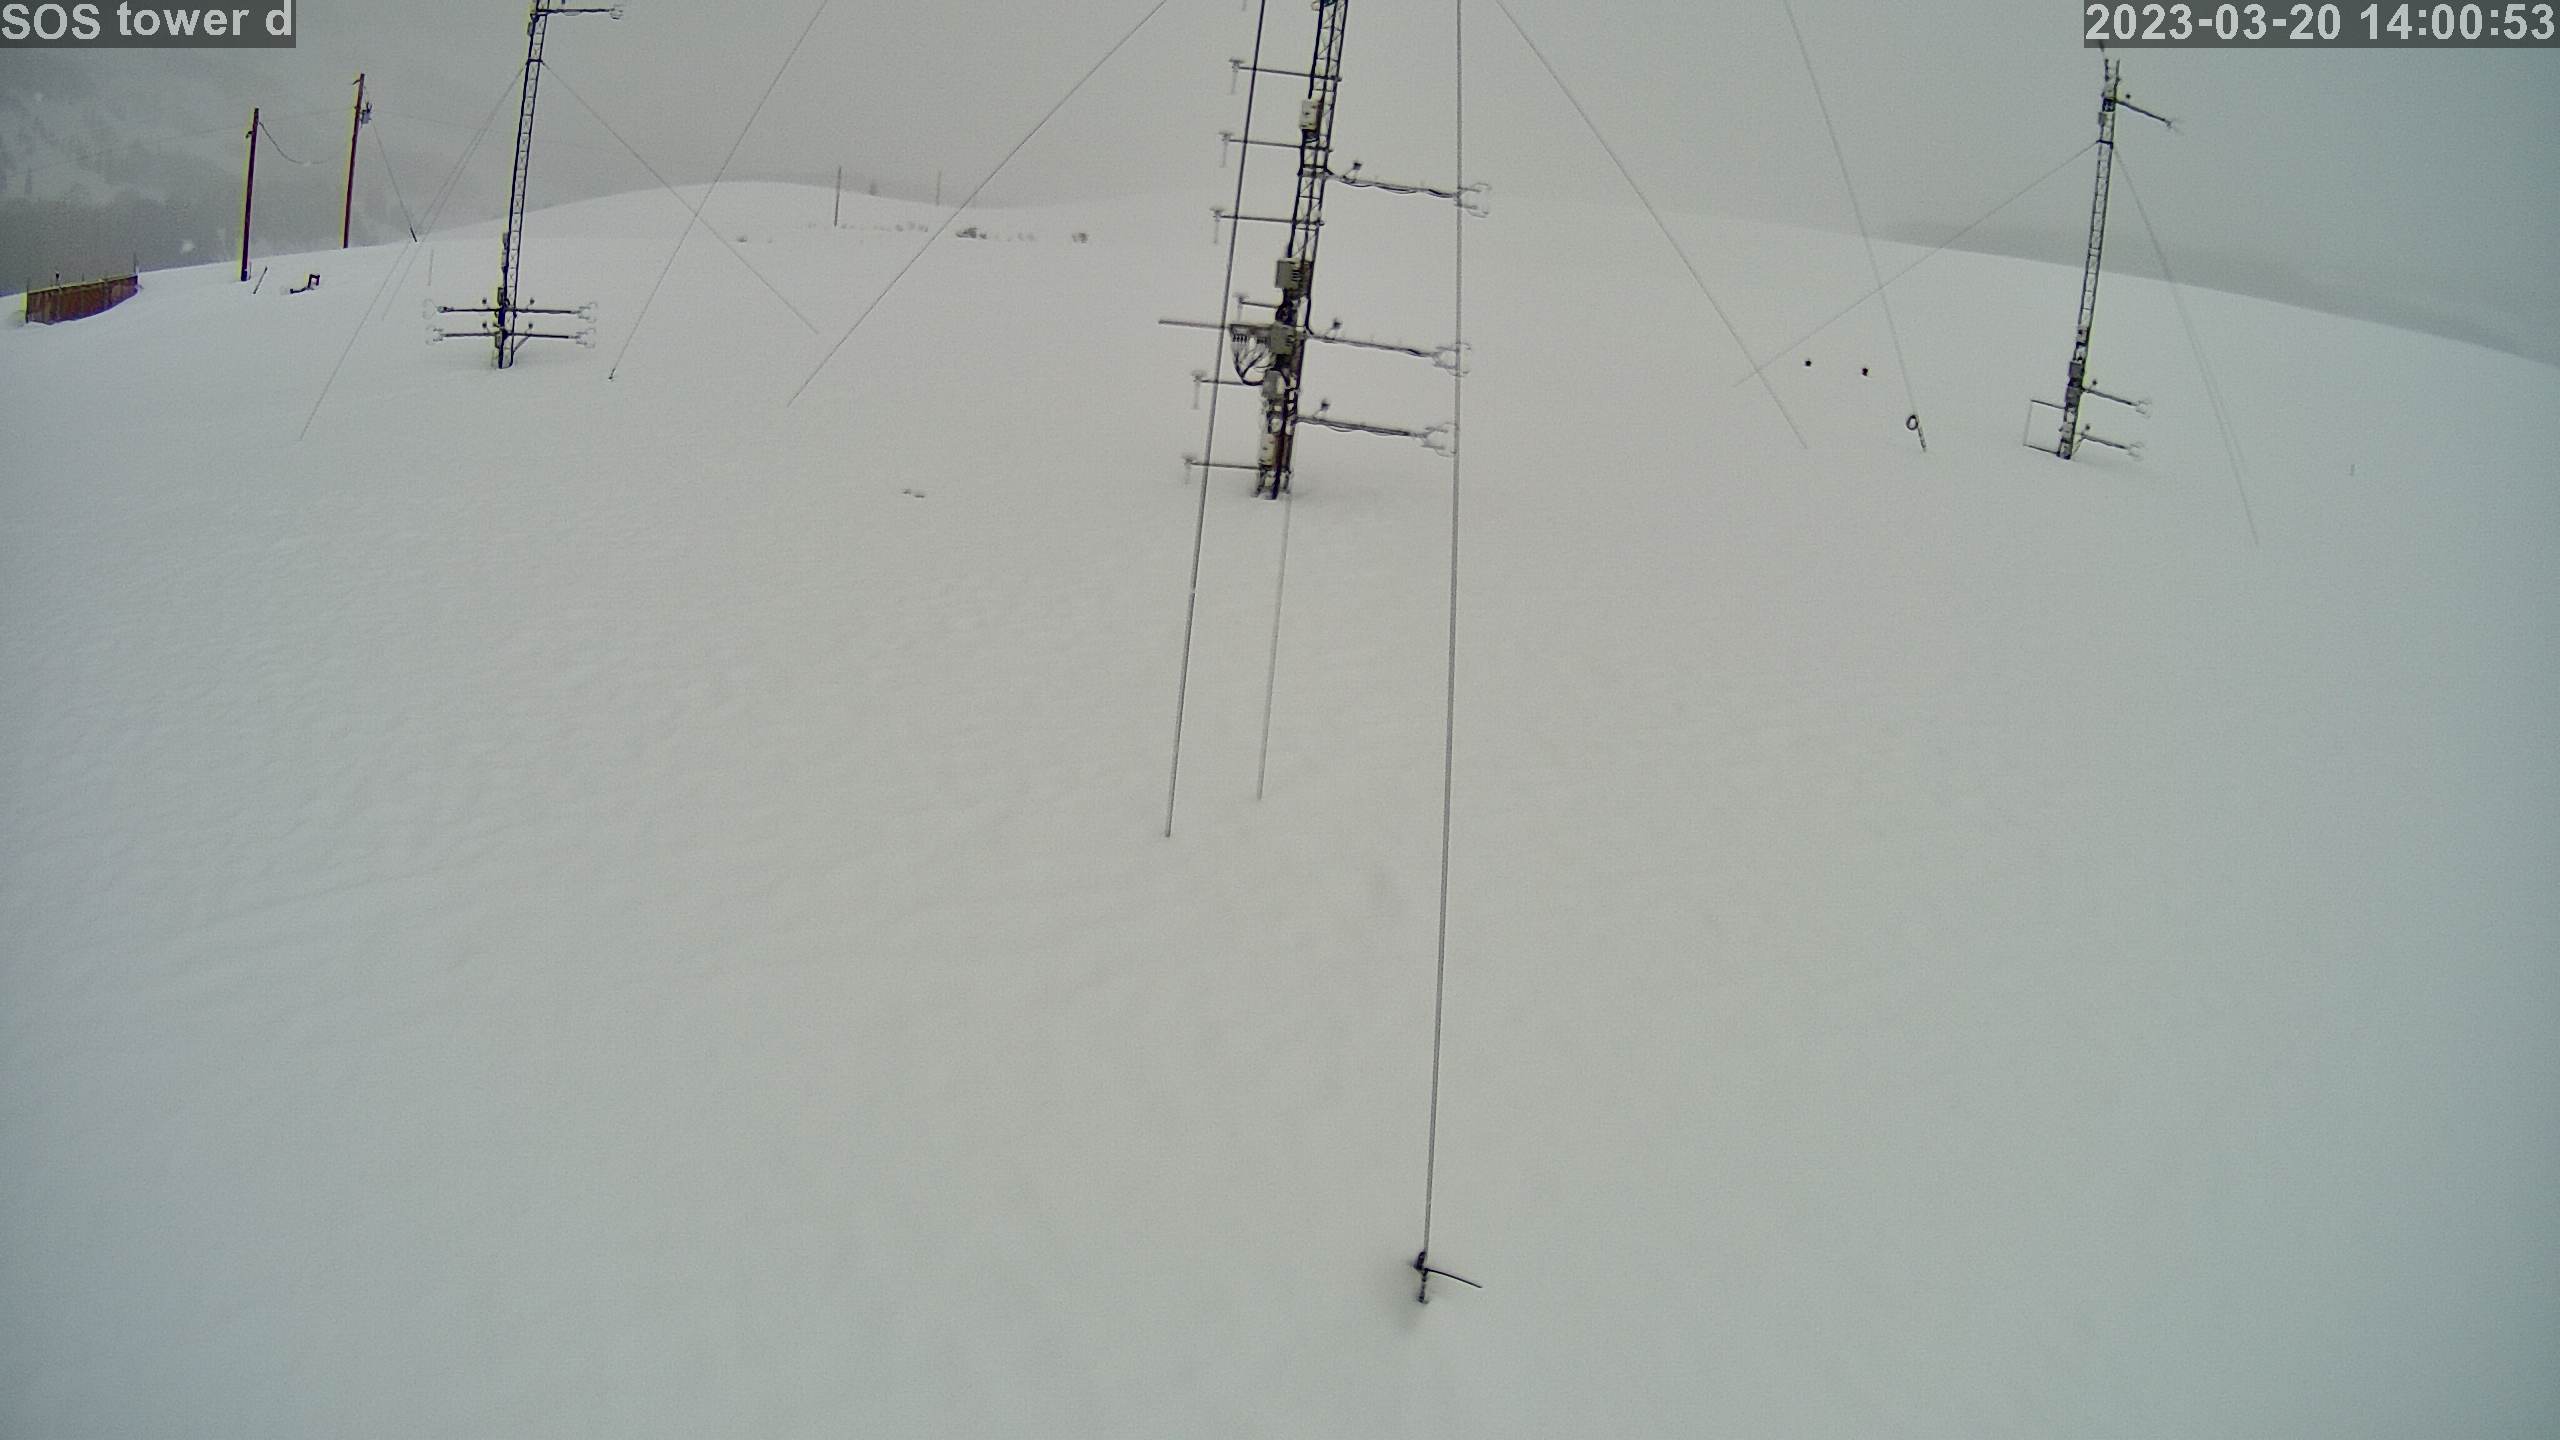
|
photo 2023032015
|
photo 2023032016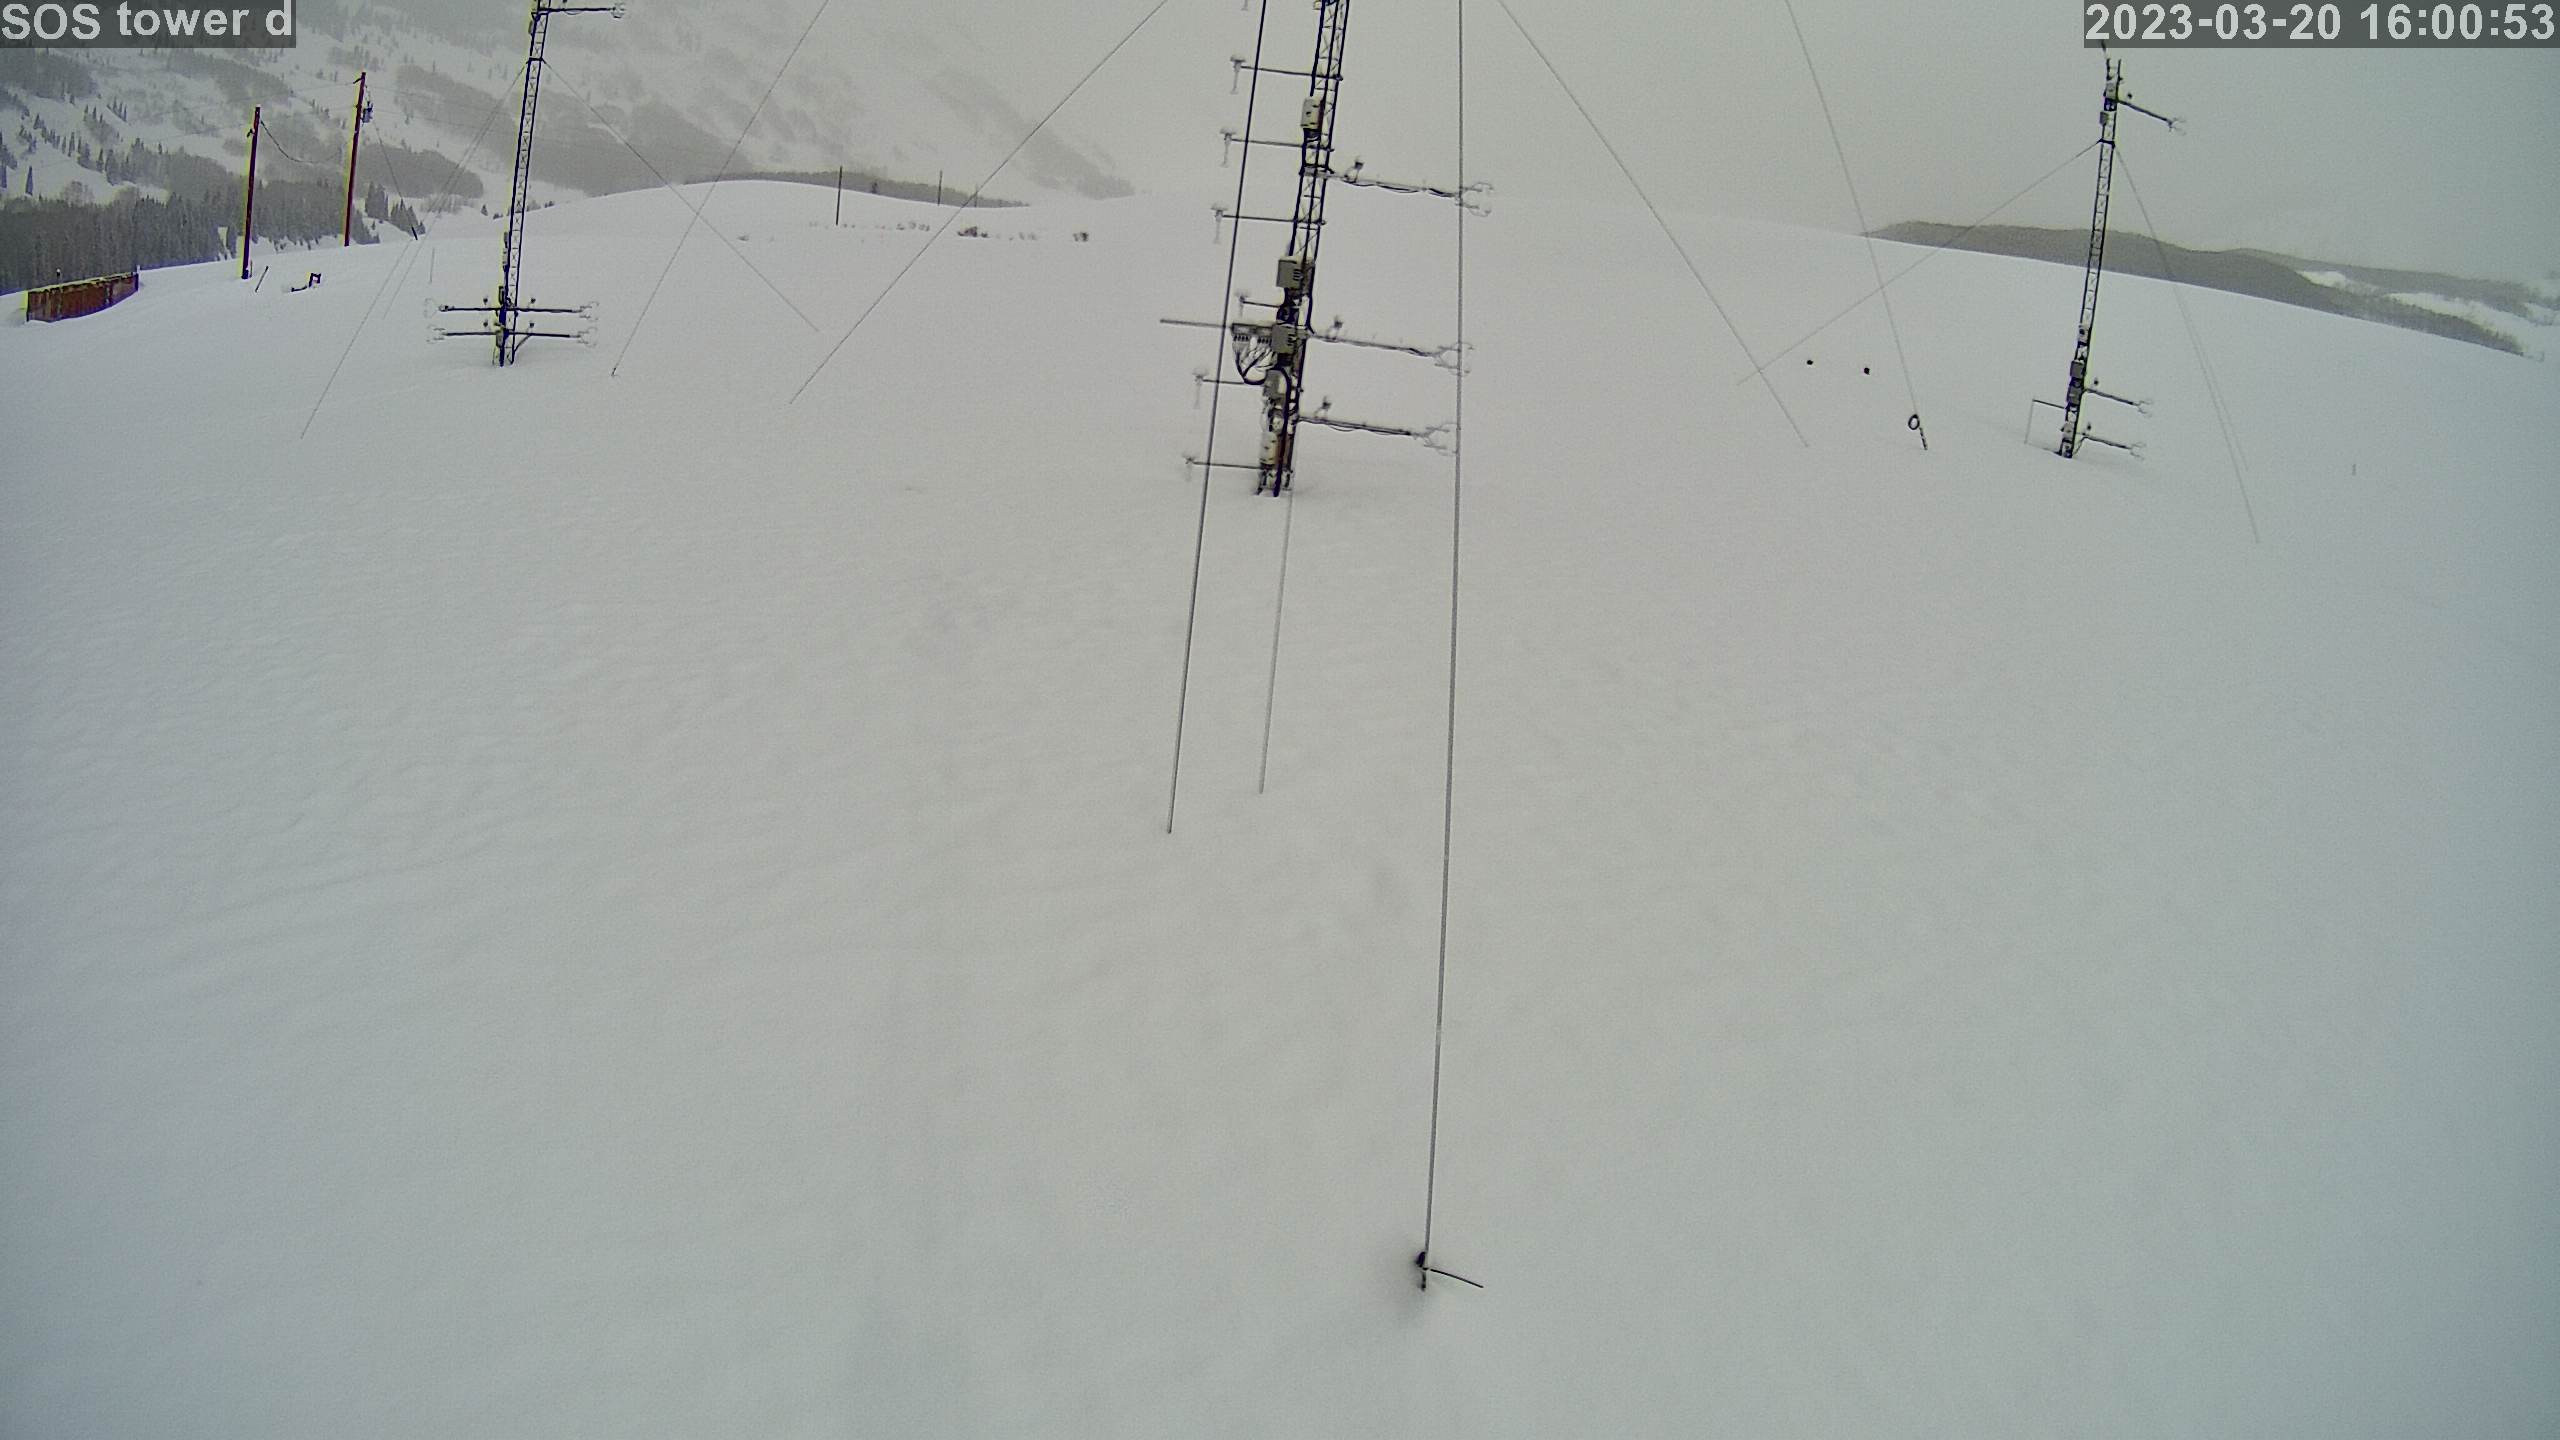
|
photo 2023032017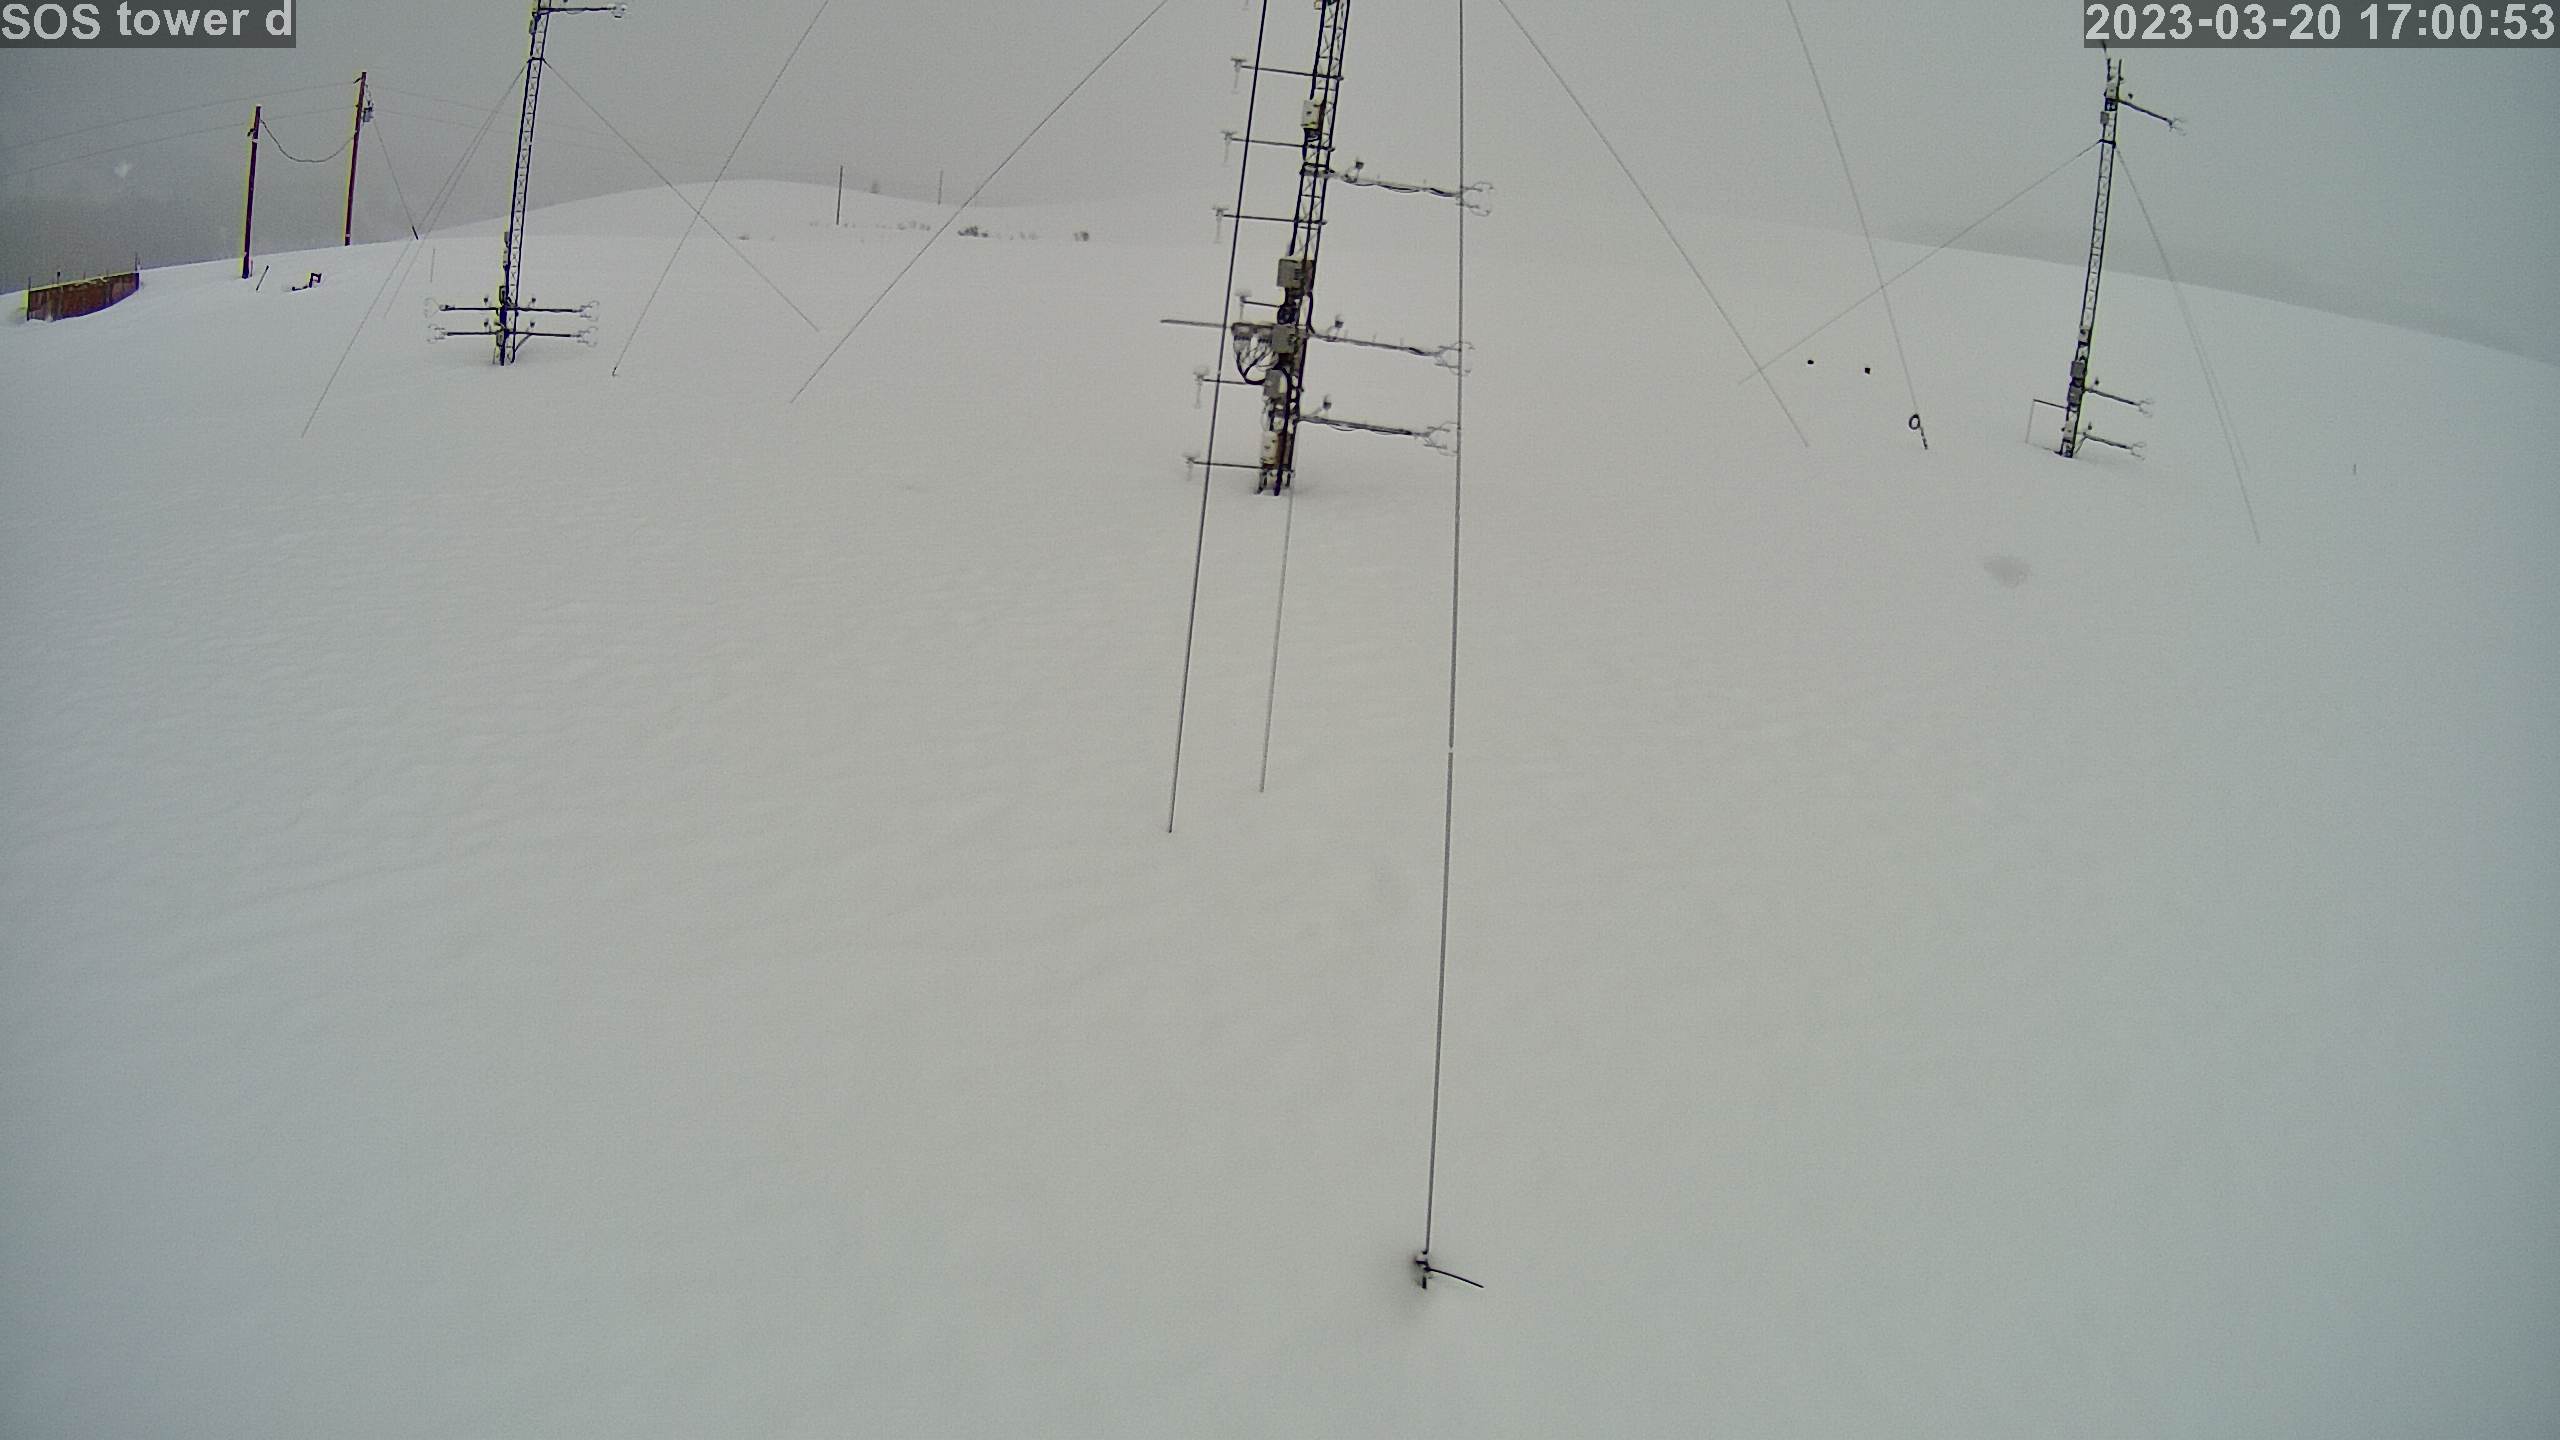
|
photo 2023032018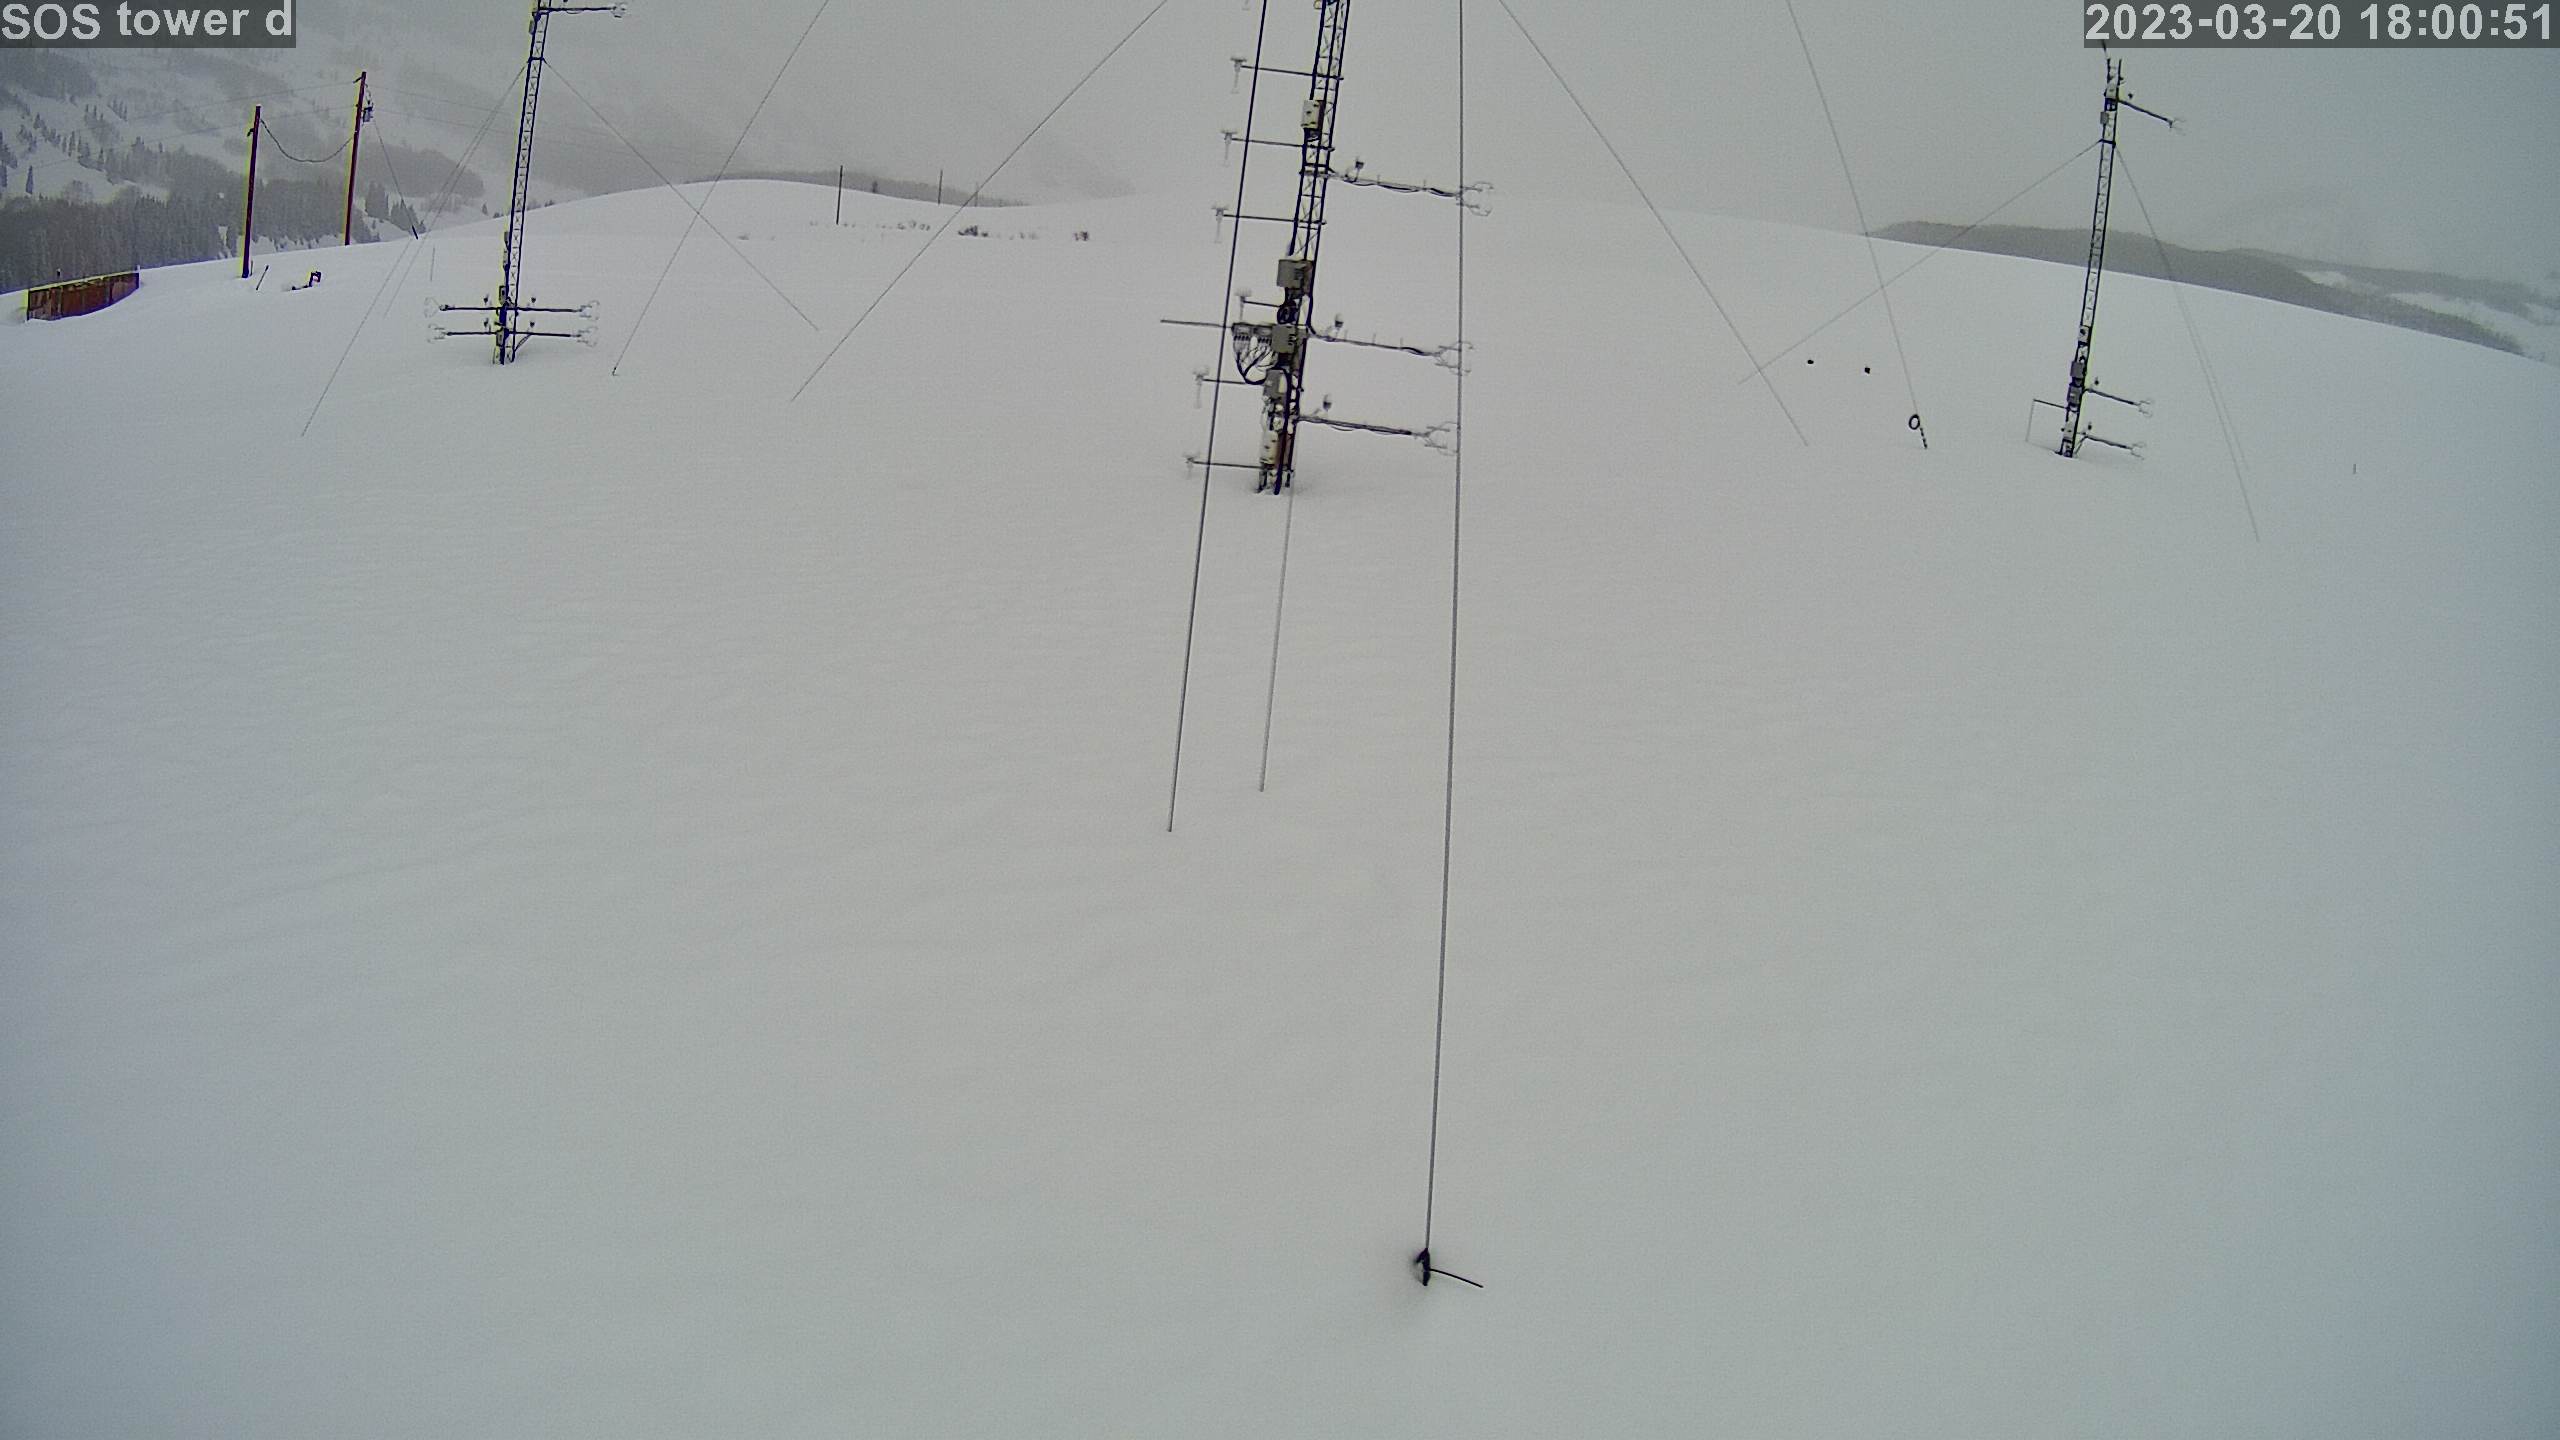
|
photo 2023032019
|
photo 2023032020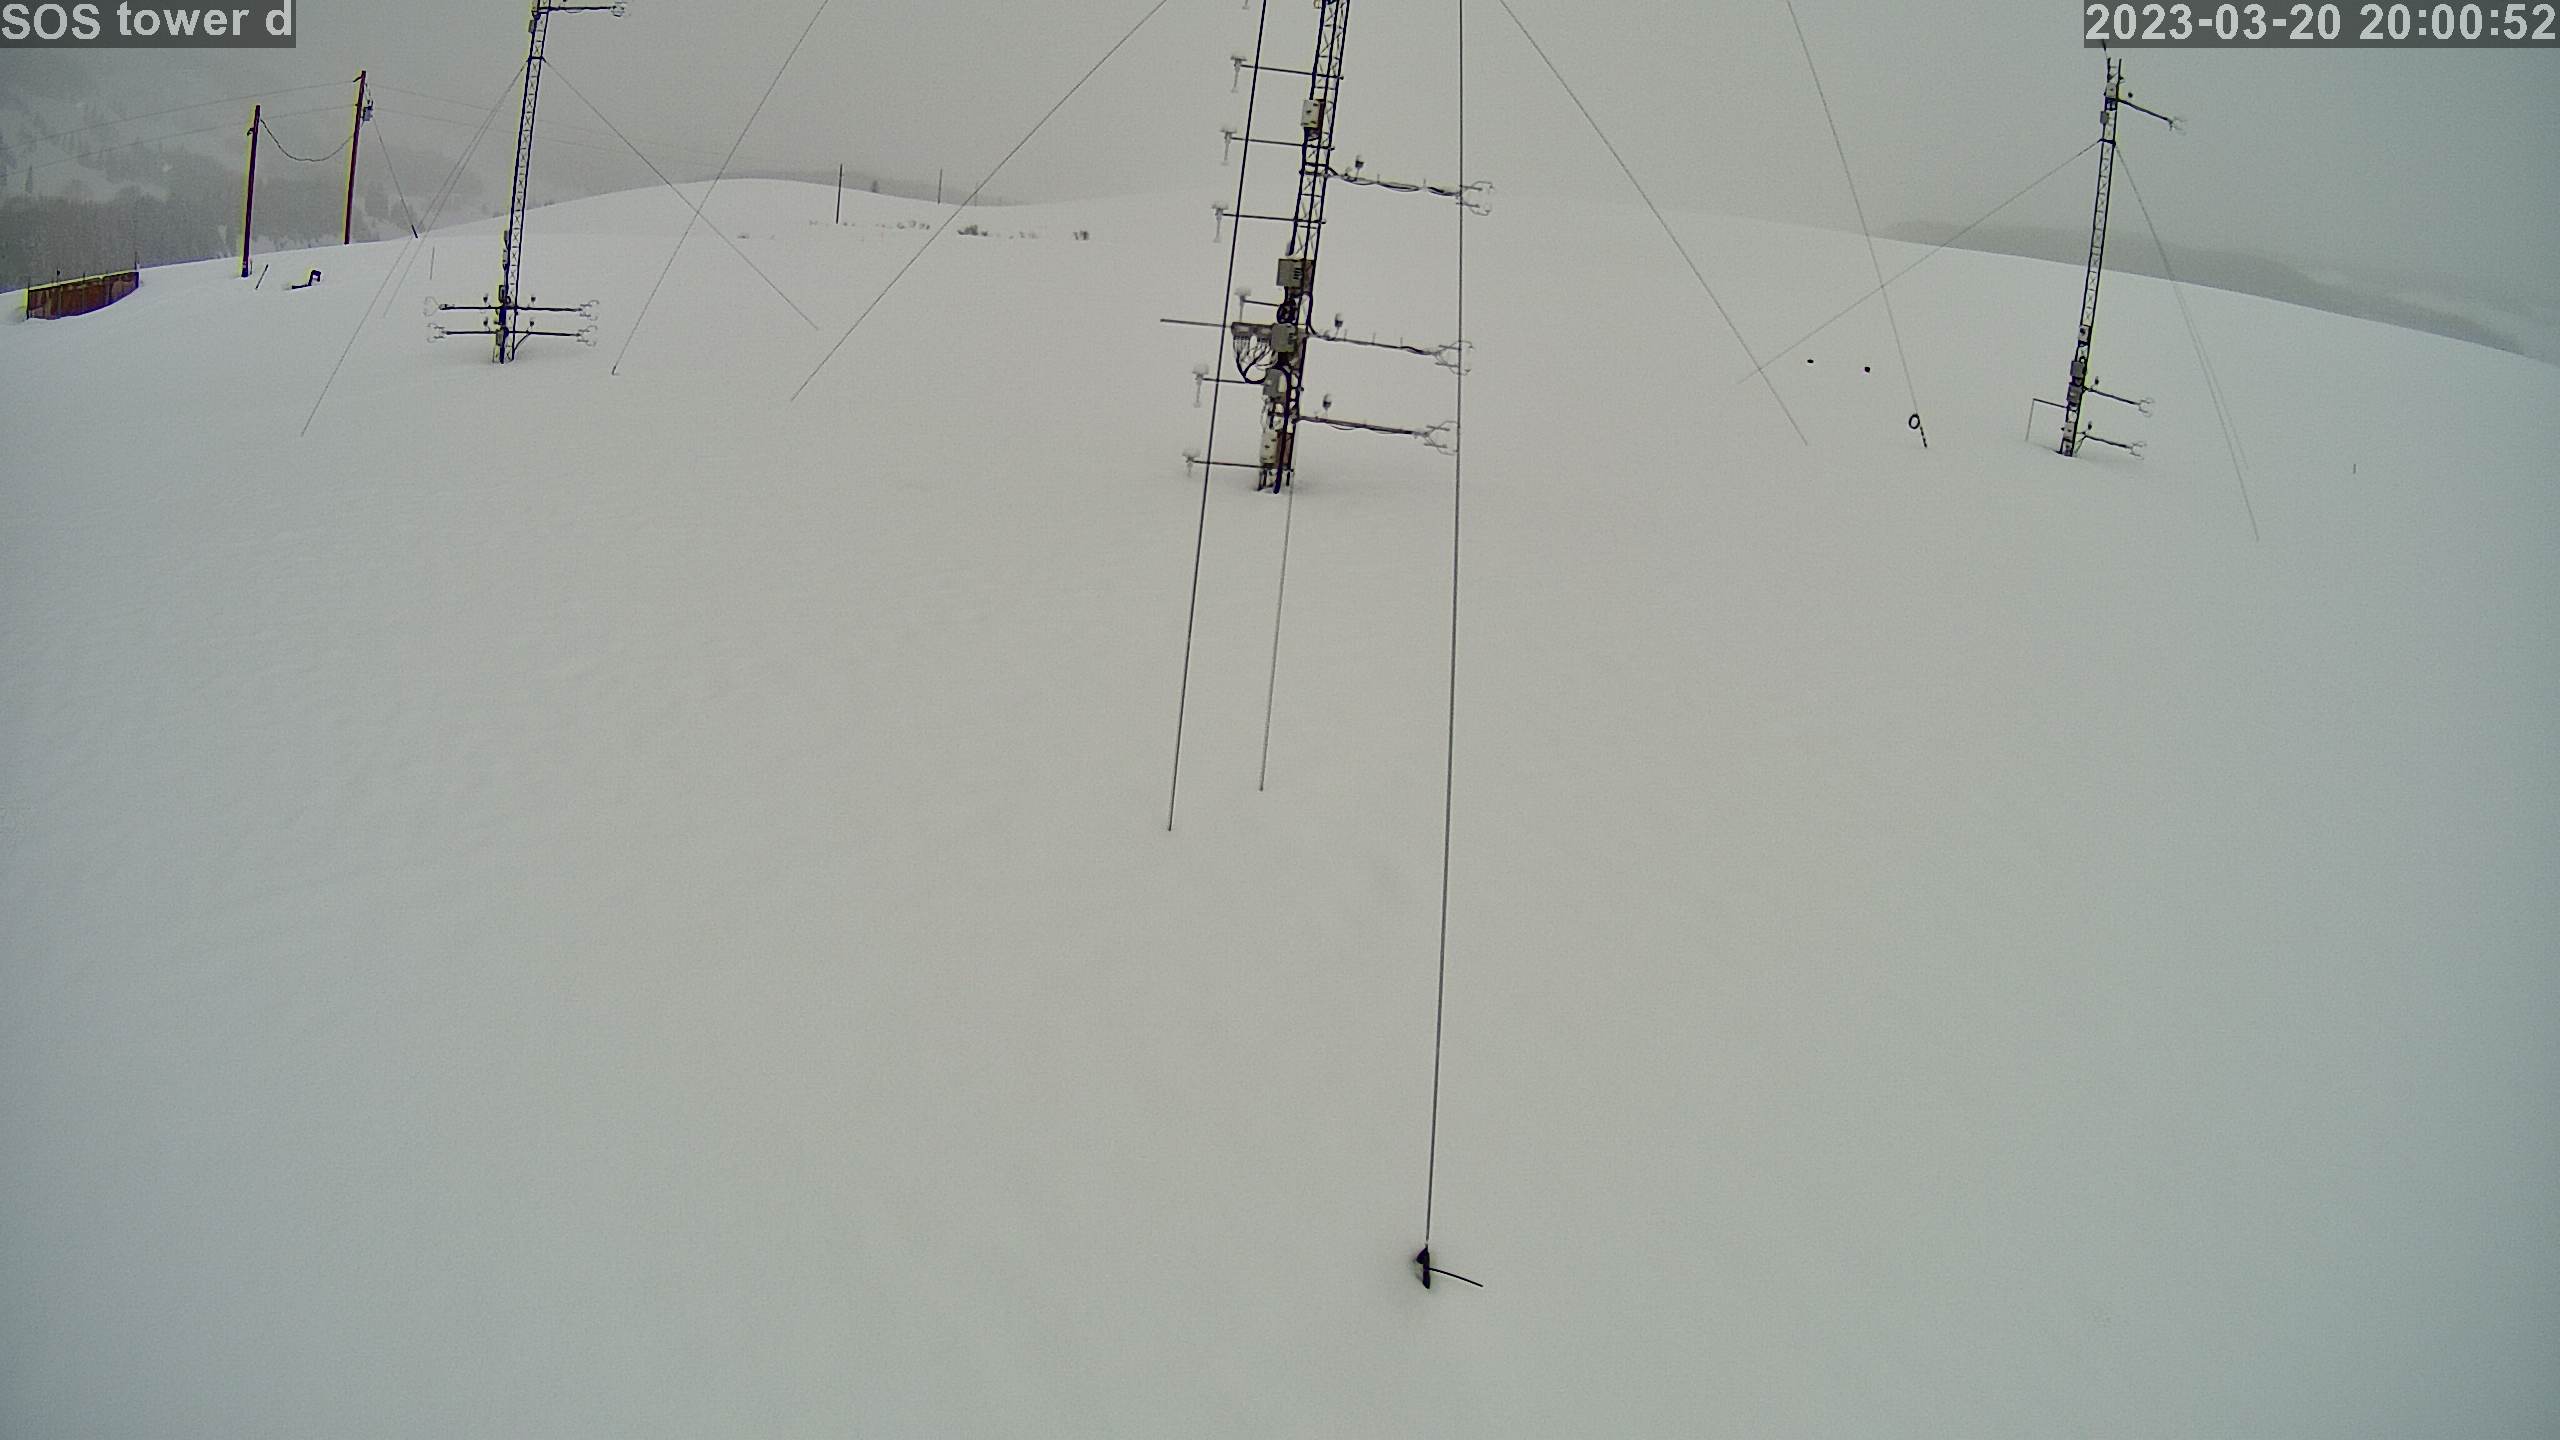
|
photo 2023032021
|
photo 2023032022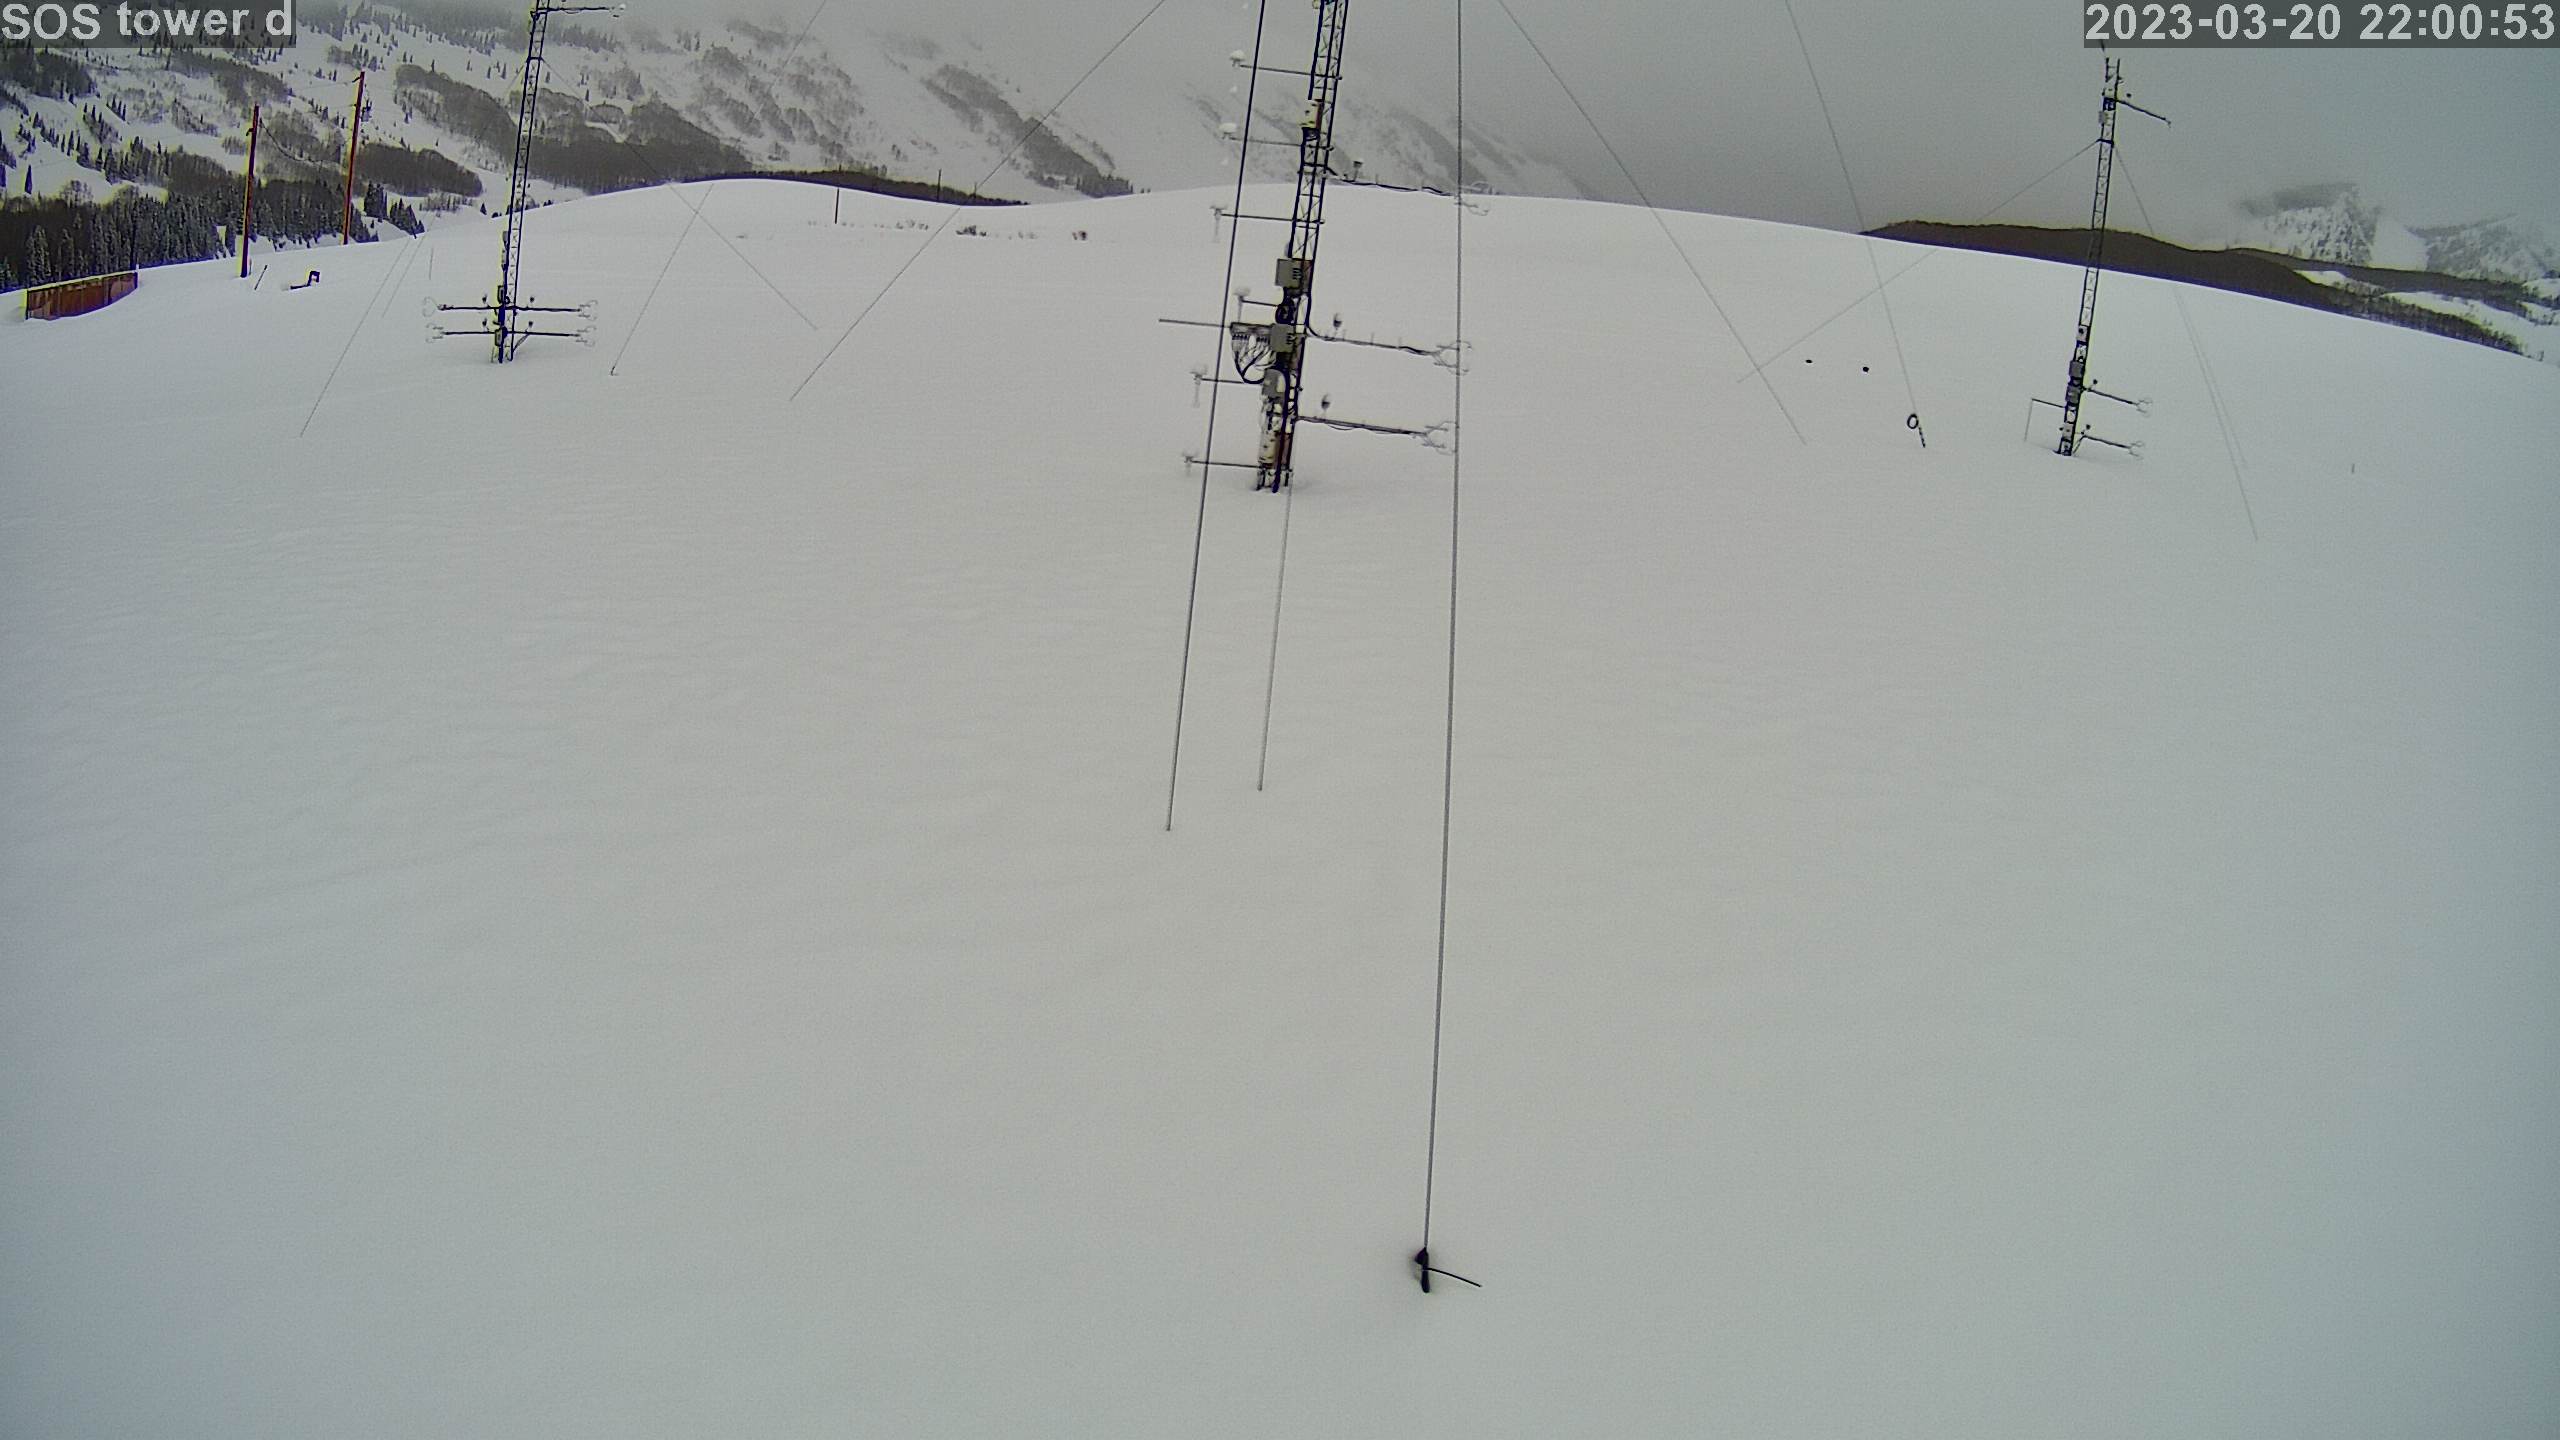
|
photo 2023032023
|