| Previous day | Select day | Next day |
The most recent plots are generally updated every 15 minutes. Use the browser reload button to make sure you are seeing the latest version of a plot.
In order to distinquish the traces on the vertical profile plots, a slight offset in X is added to some traces. This is indicated by a "(n)" in the legend for the trace.
If you right-click on an image, most browsers will provide a menu to download or display the plot in another window.
photo 20230319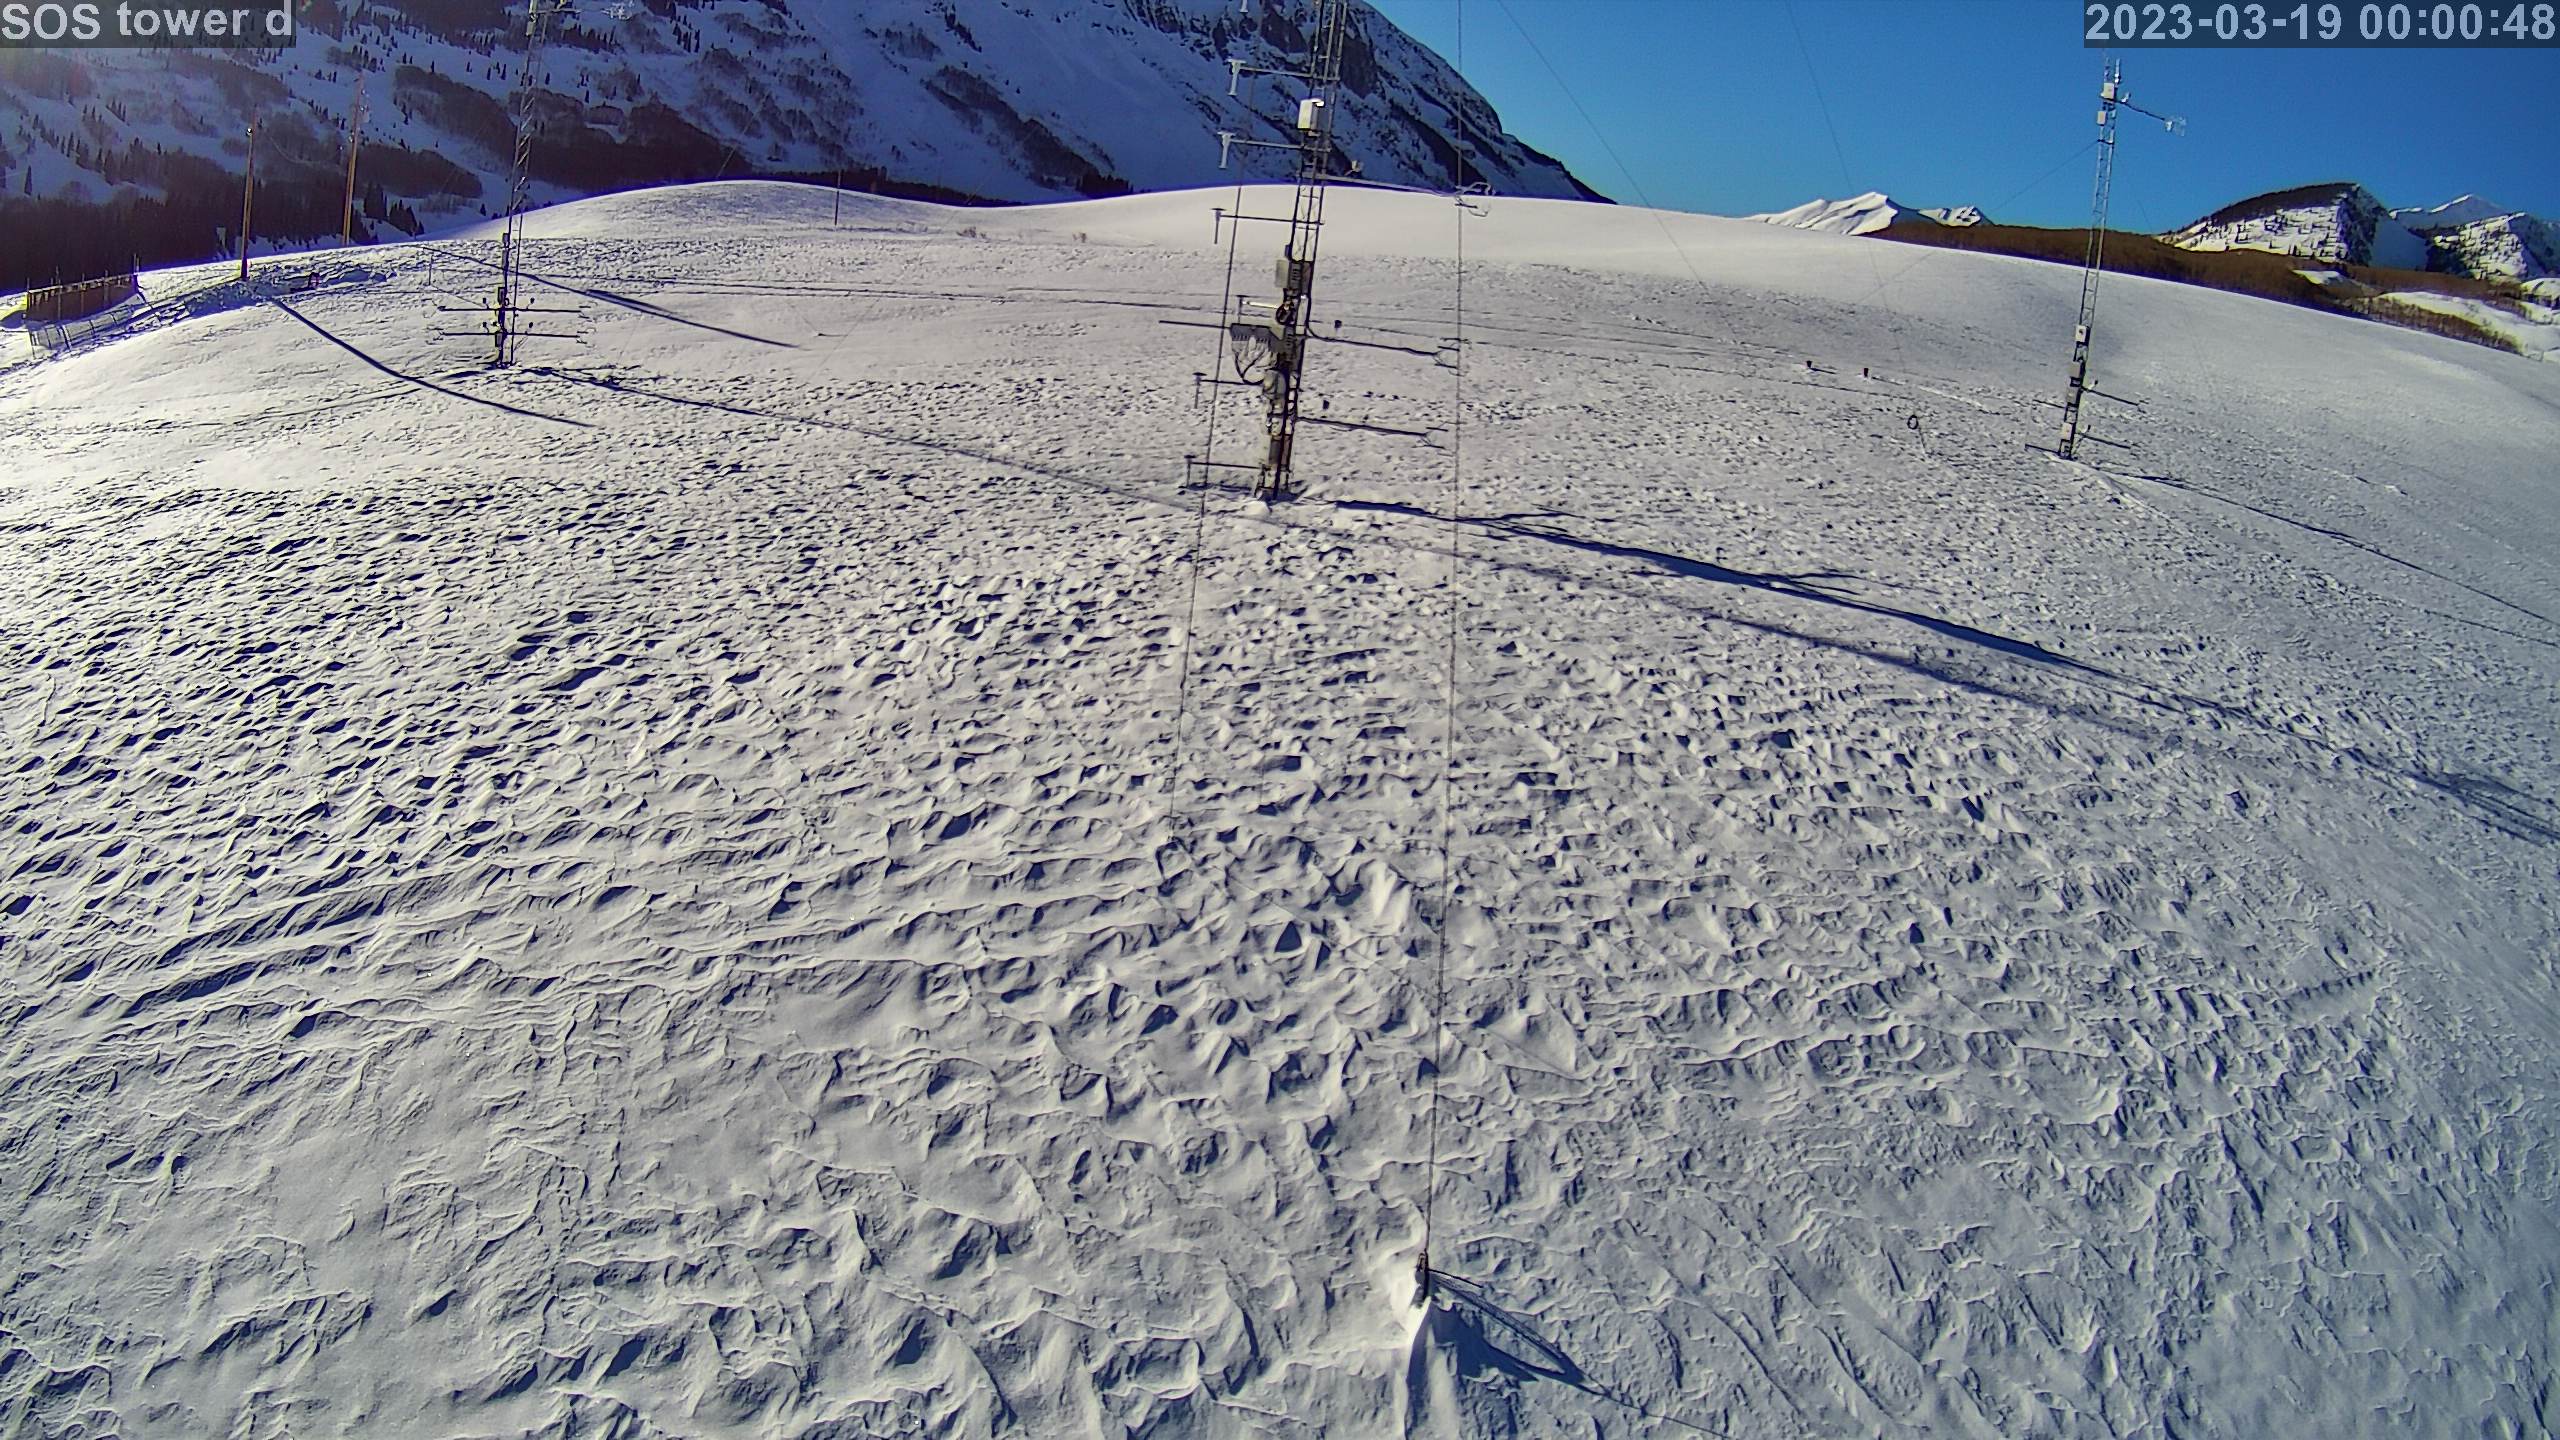
|
photo 2023031901
|
photo 2023031902
|
photo 2023031903
|
photo 2023031904
|
photo 2023031905
|
photo 2023031906
|
photo 2023031907
|
photo 2023031908
|
photo 2023031909
|
photo 2023031910
|
photo 2023031911
|
photo 2023031912
|
photo 2023031913
|
photo 2023031914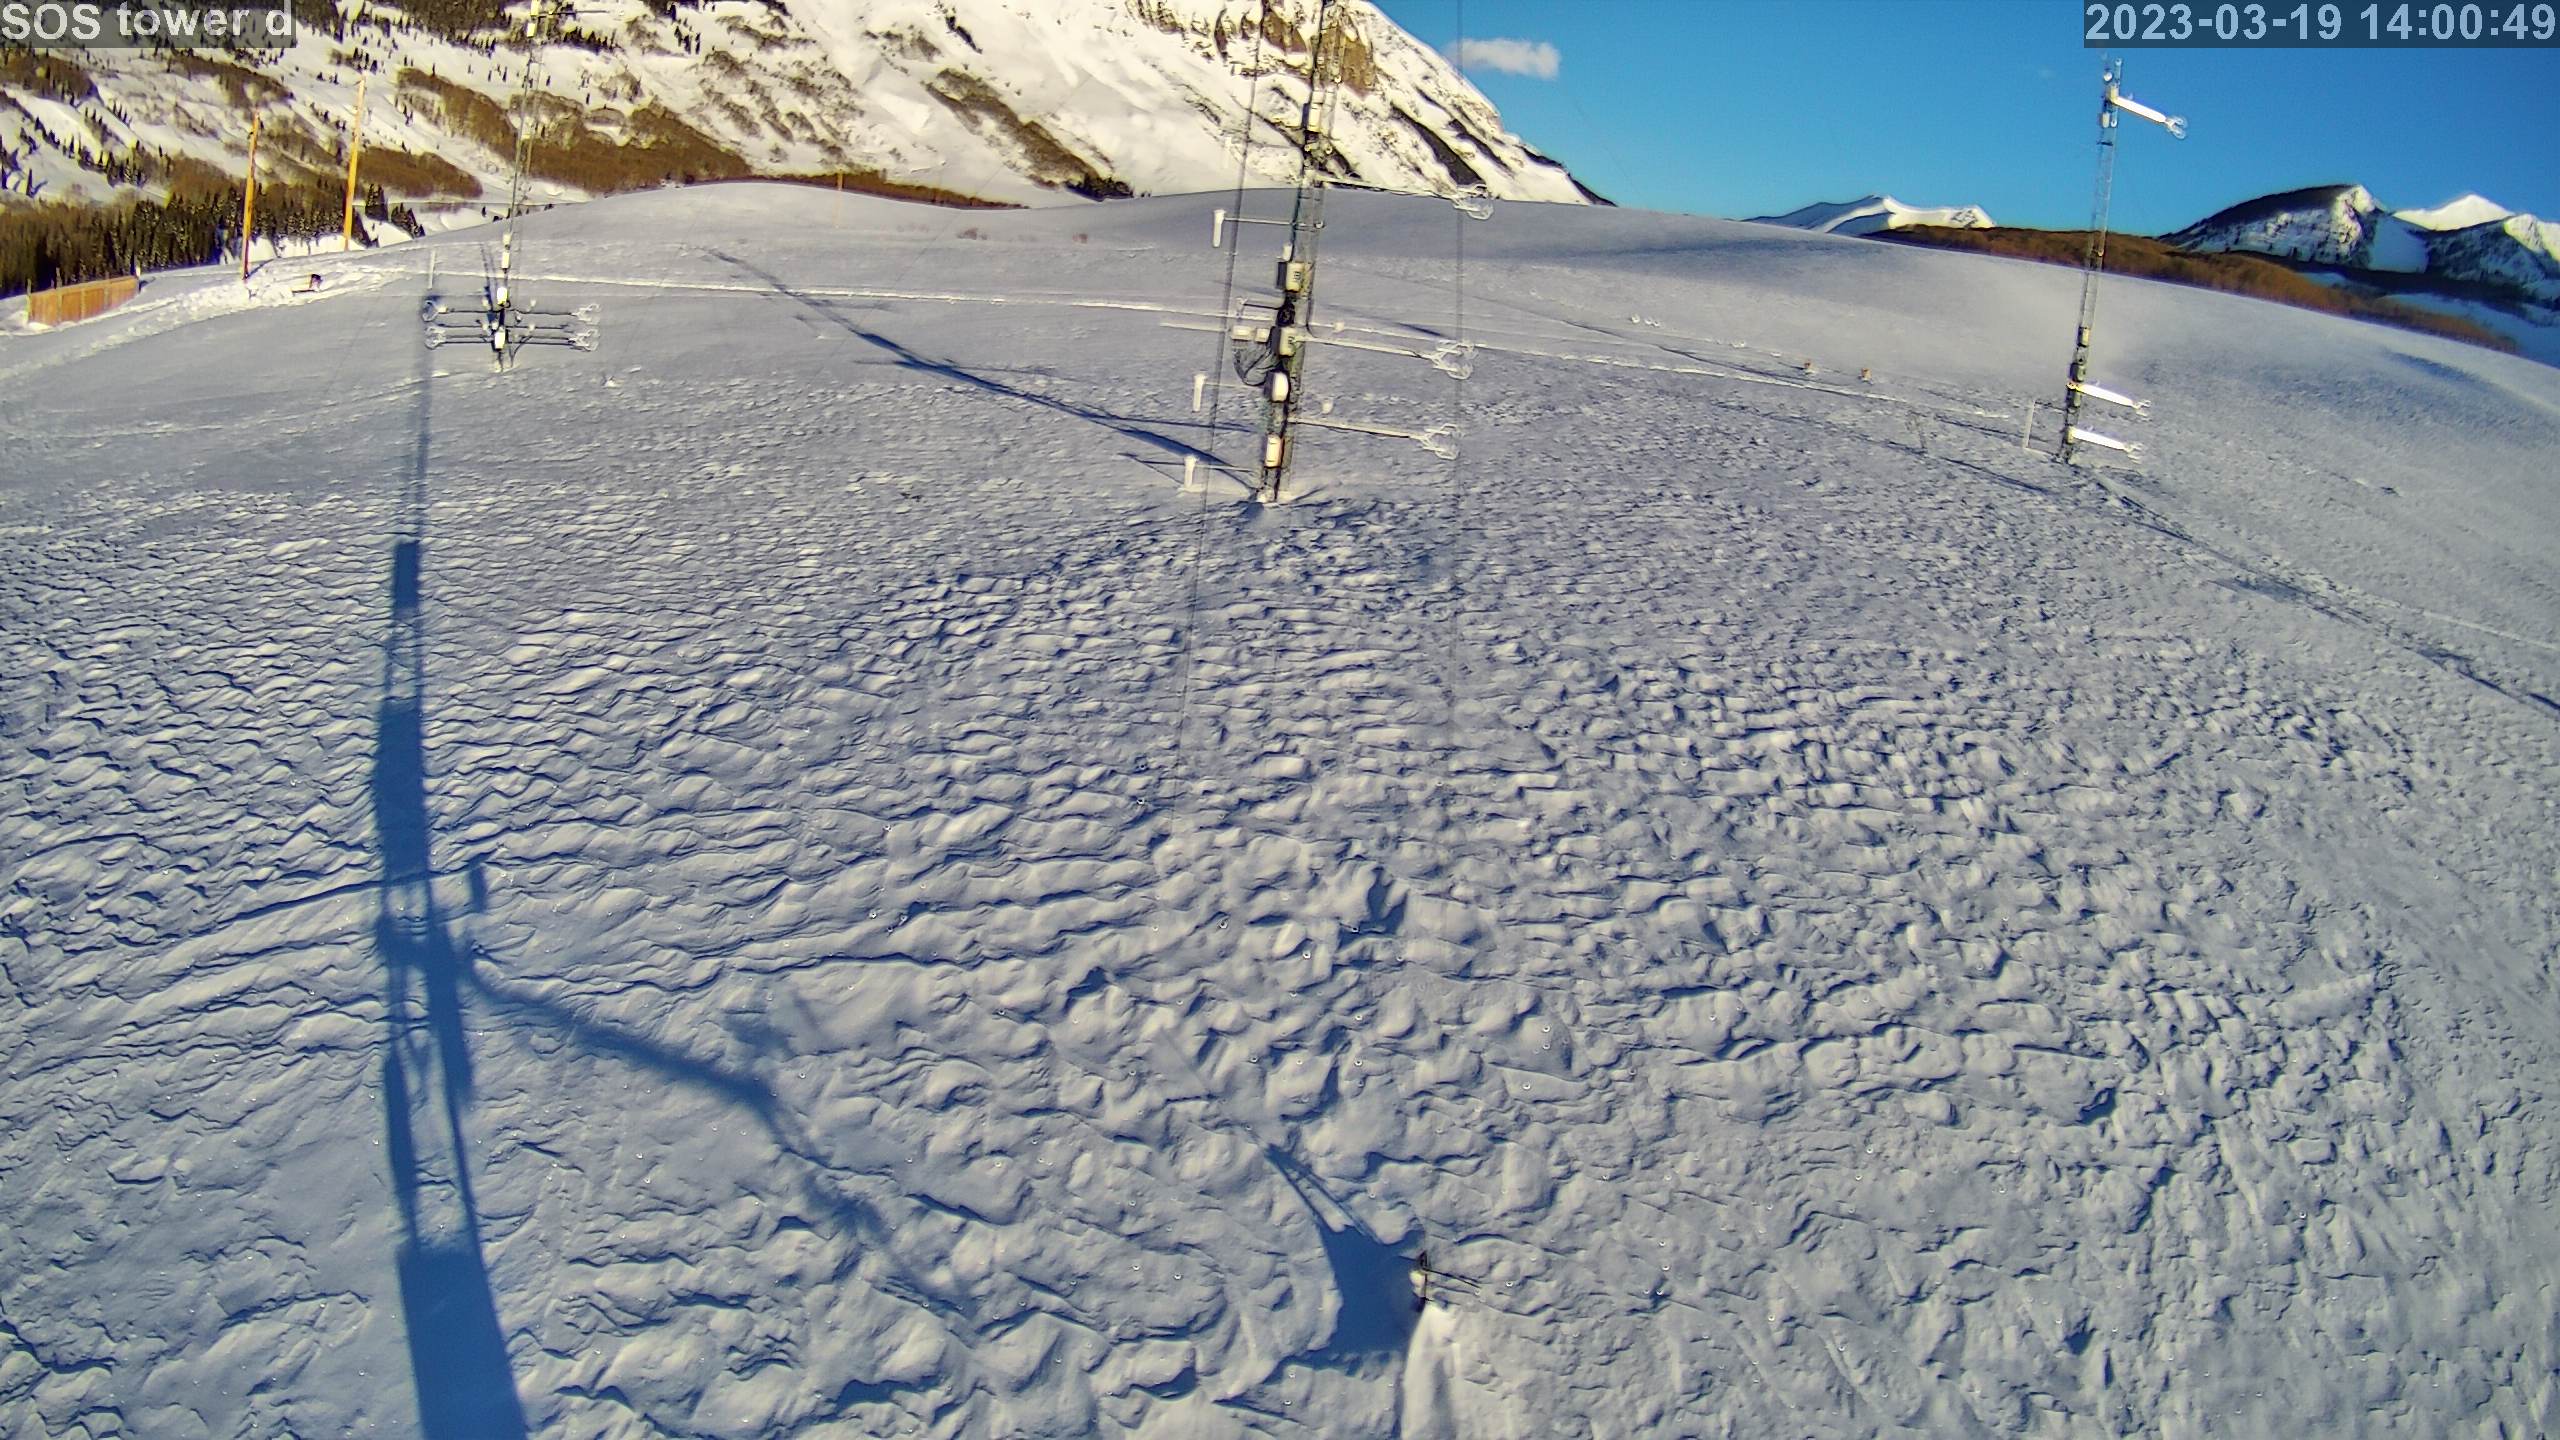
|
photo 2023031915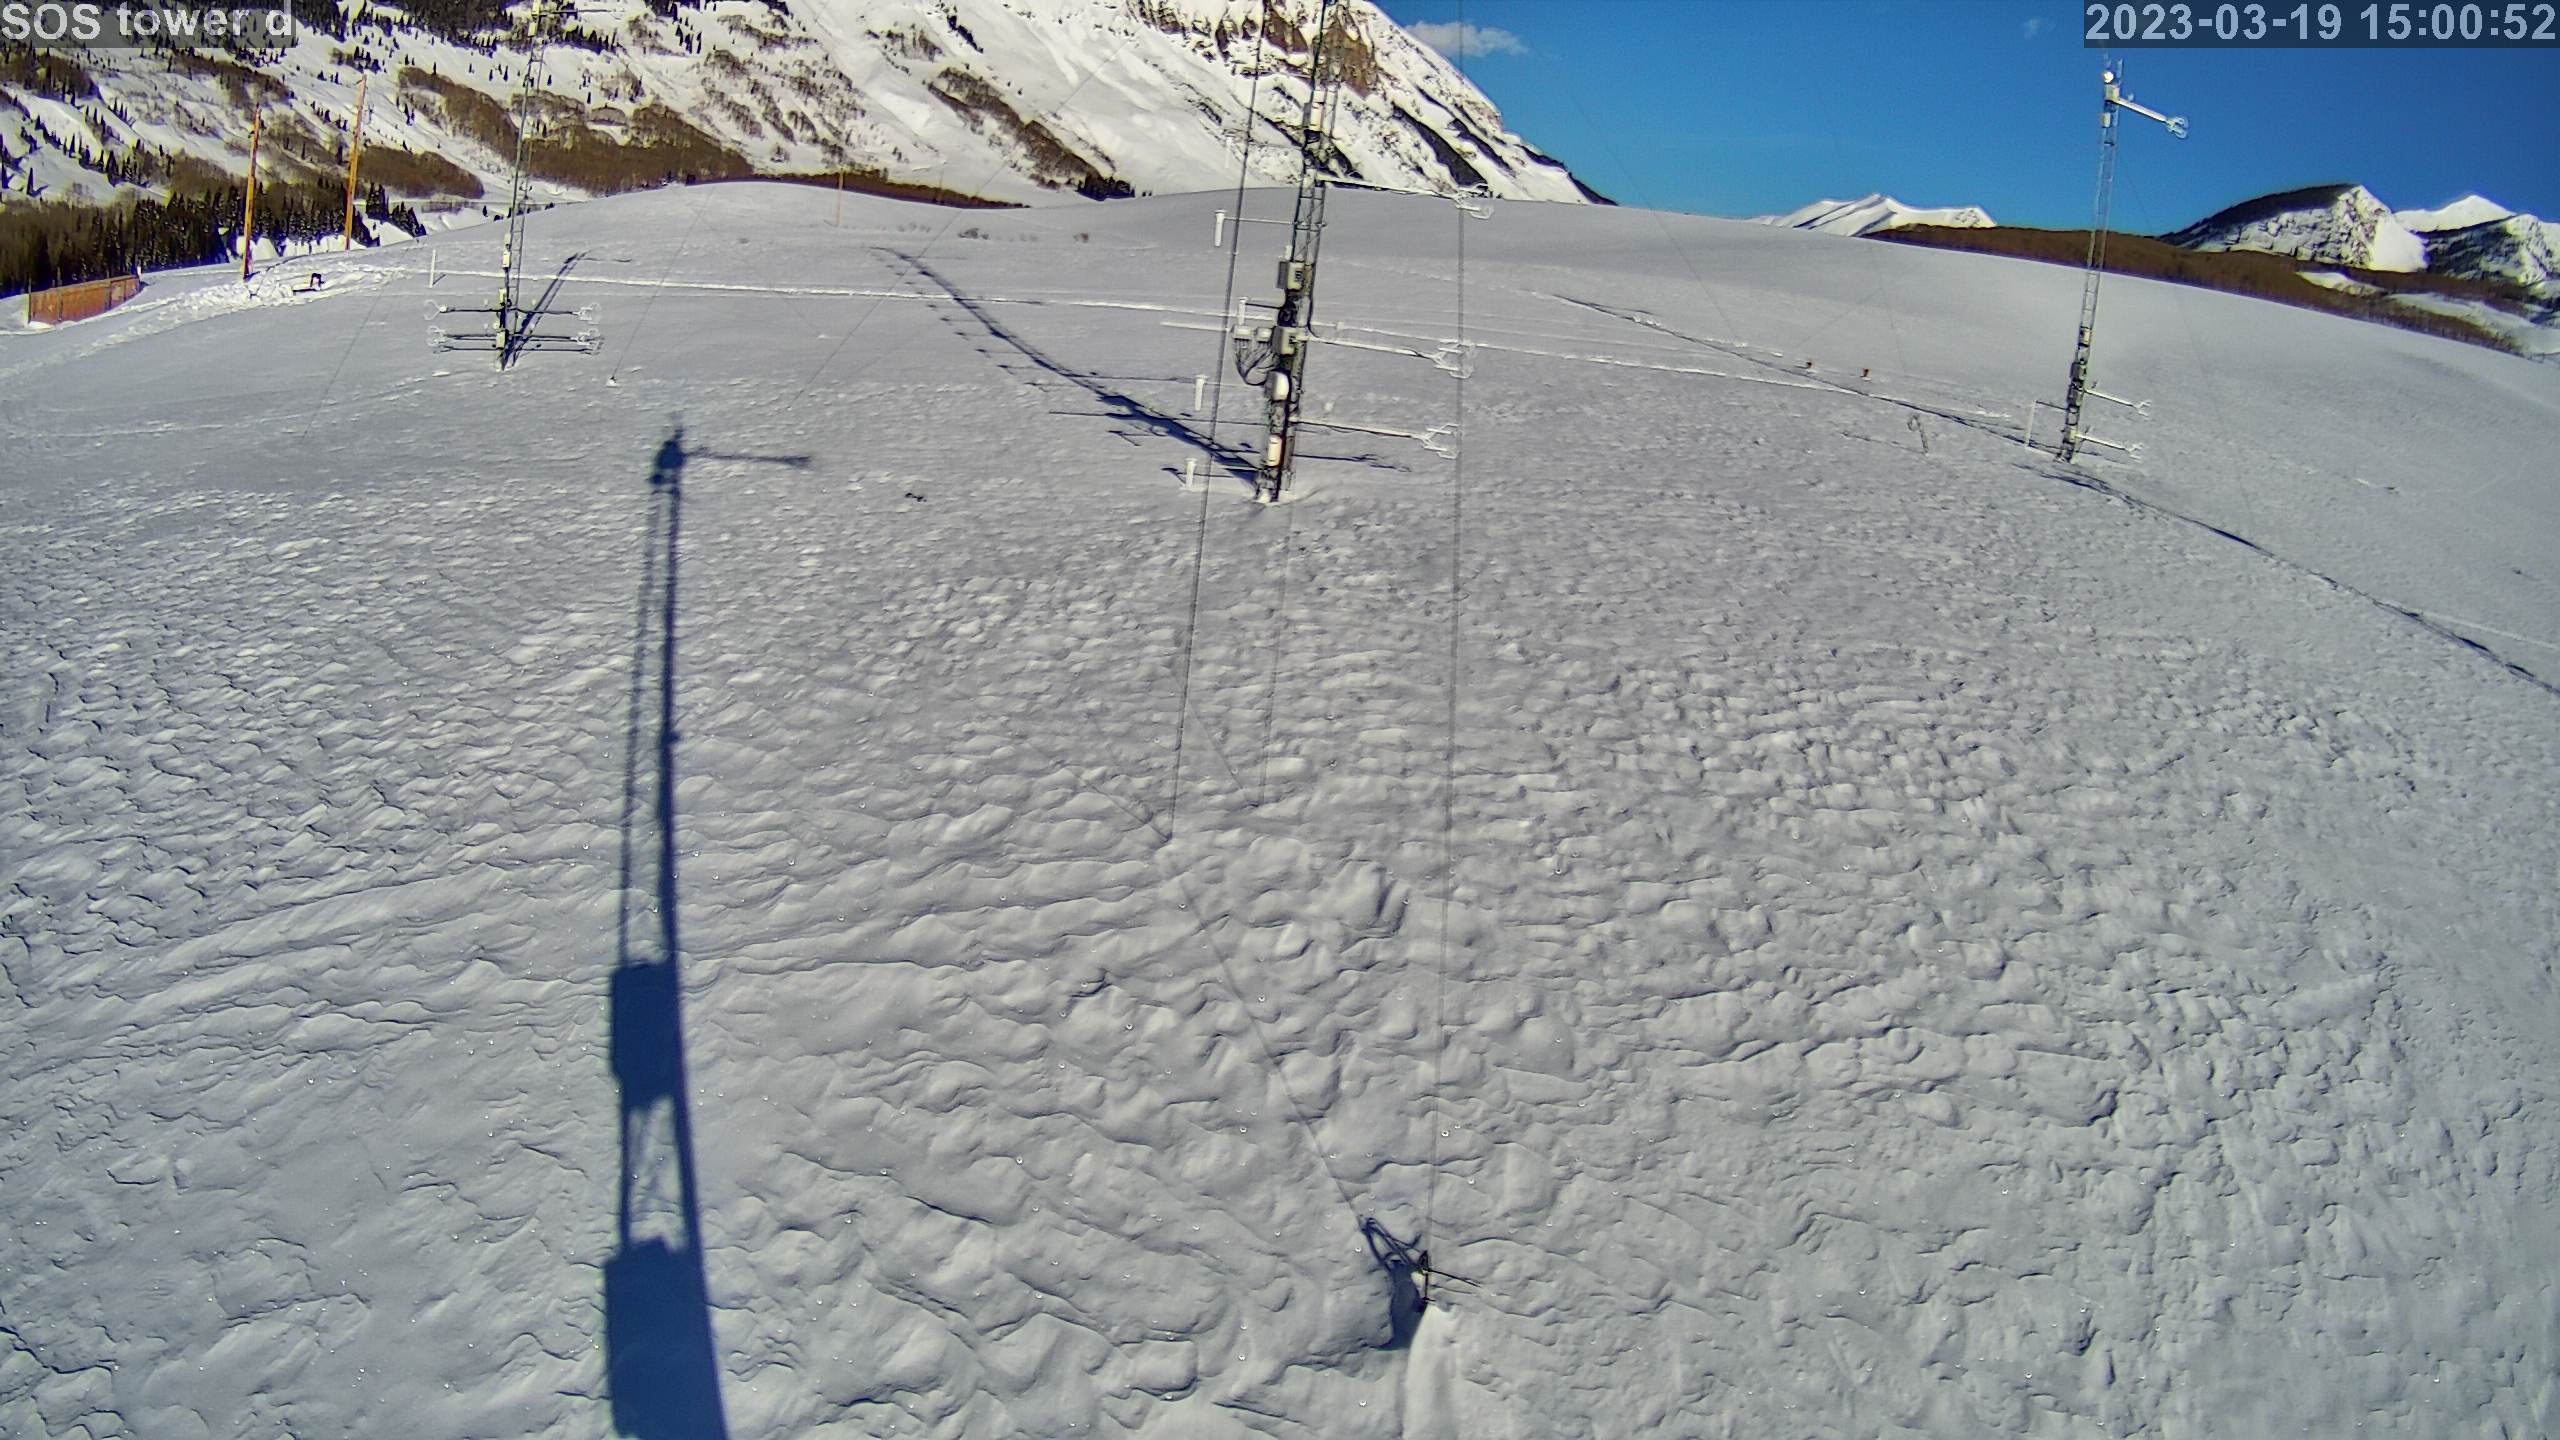
|
photo 2023031916
|
photo 2023031917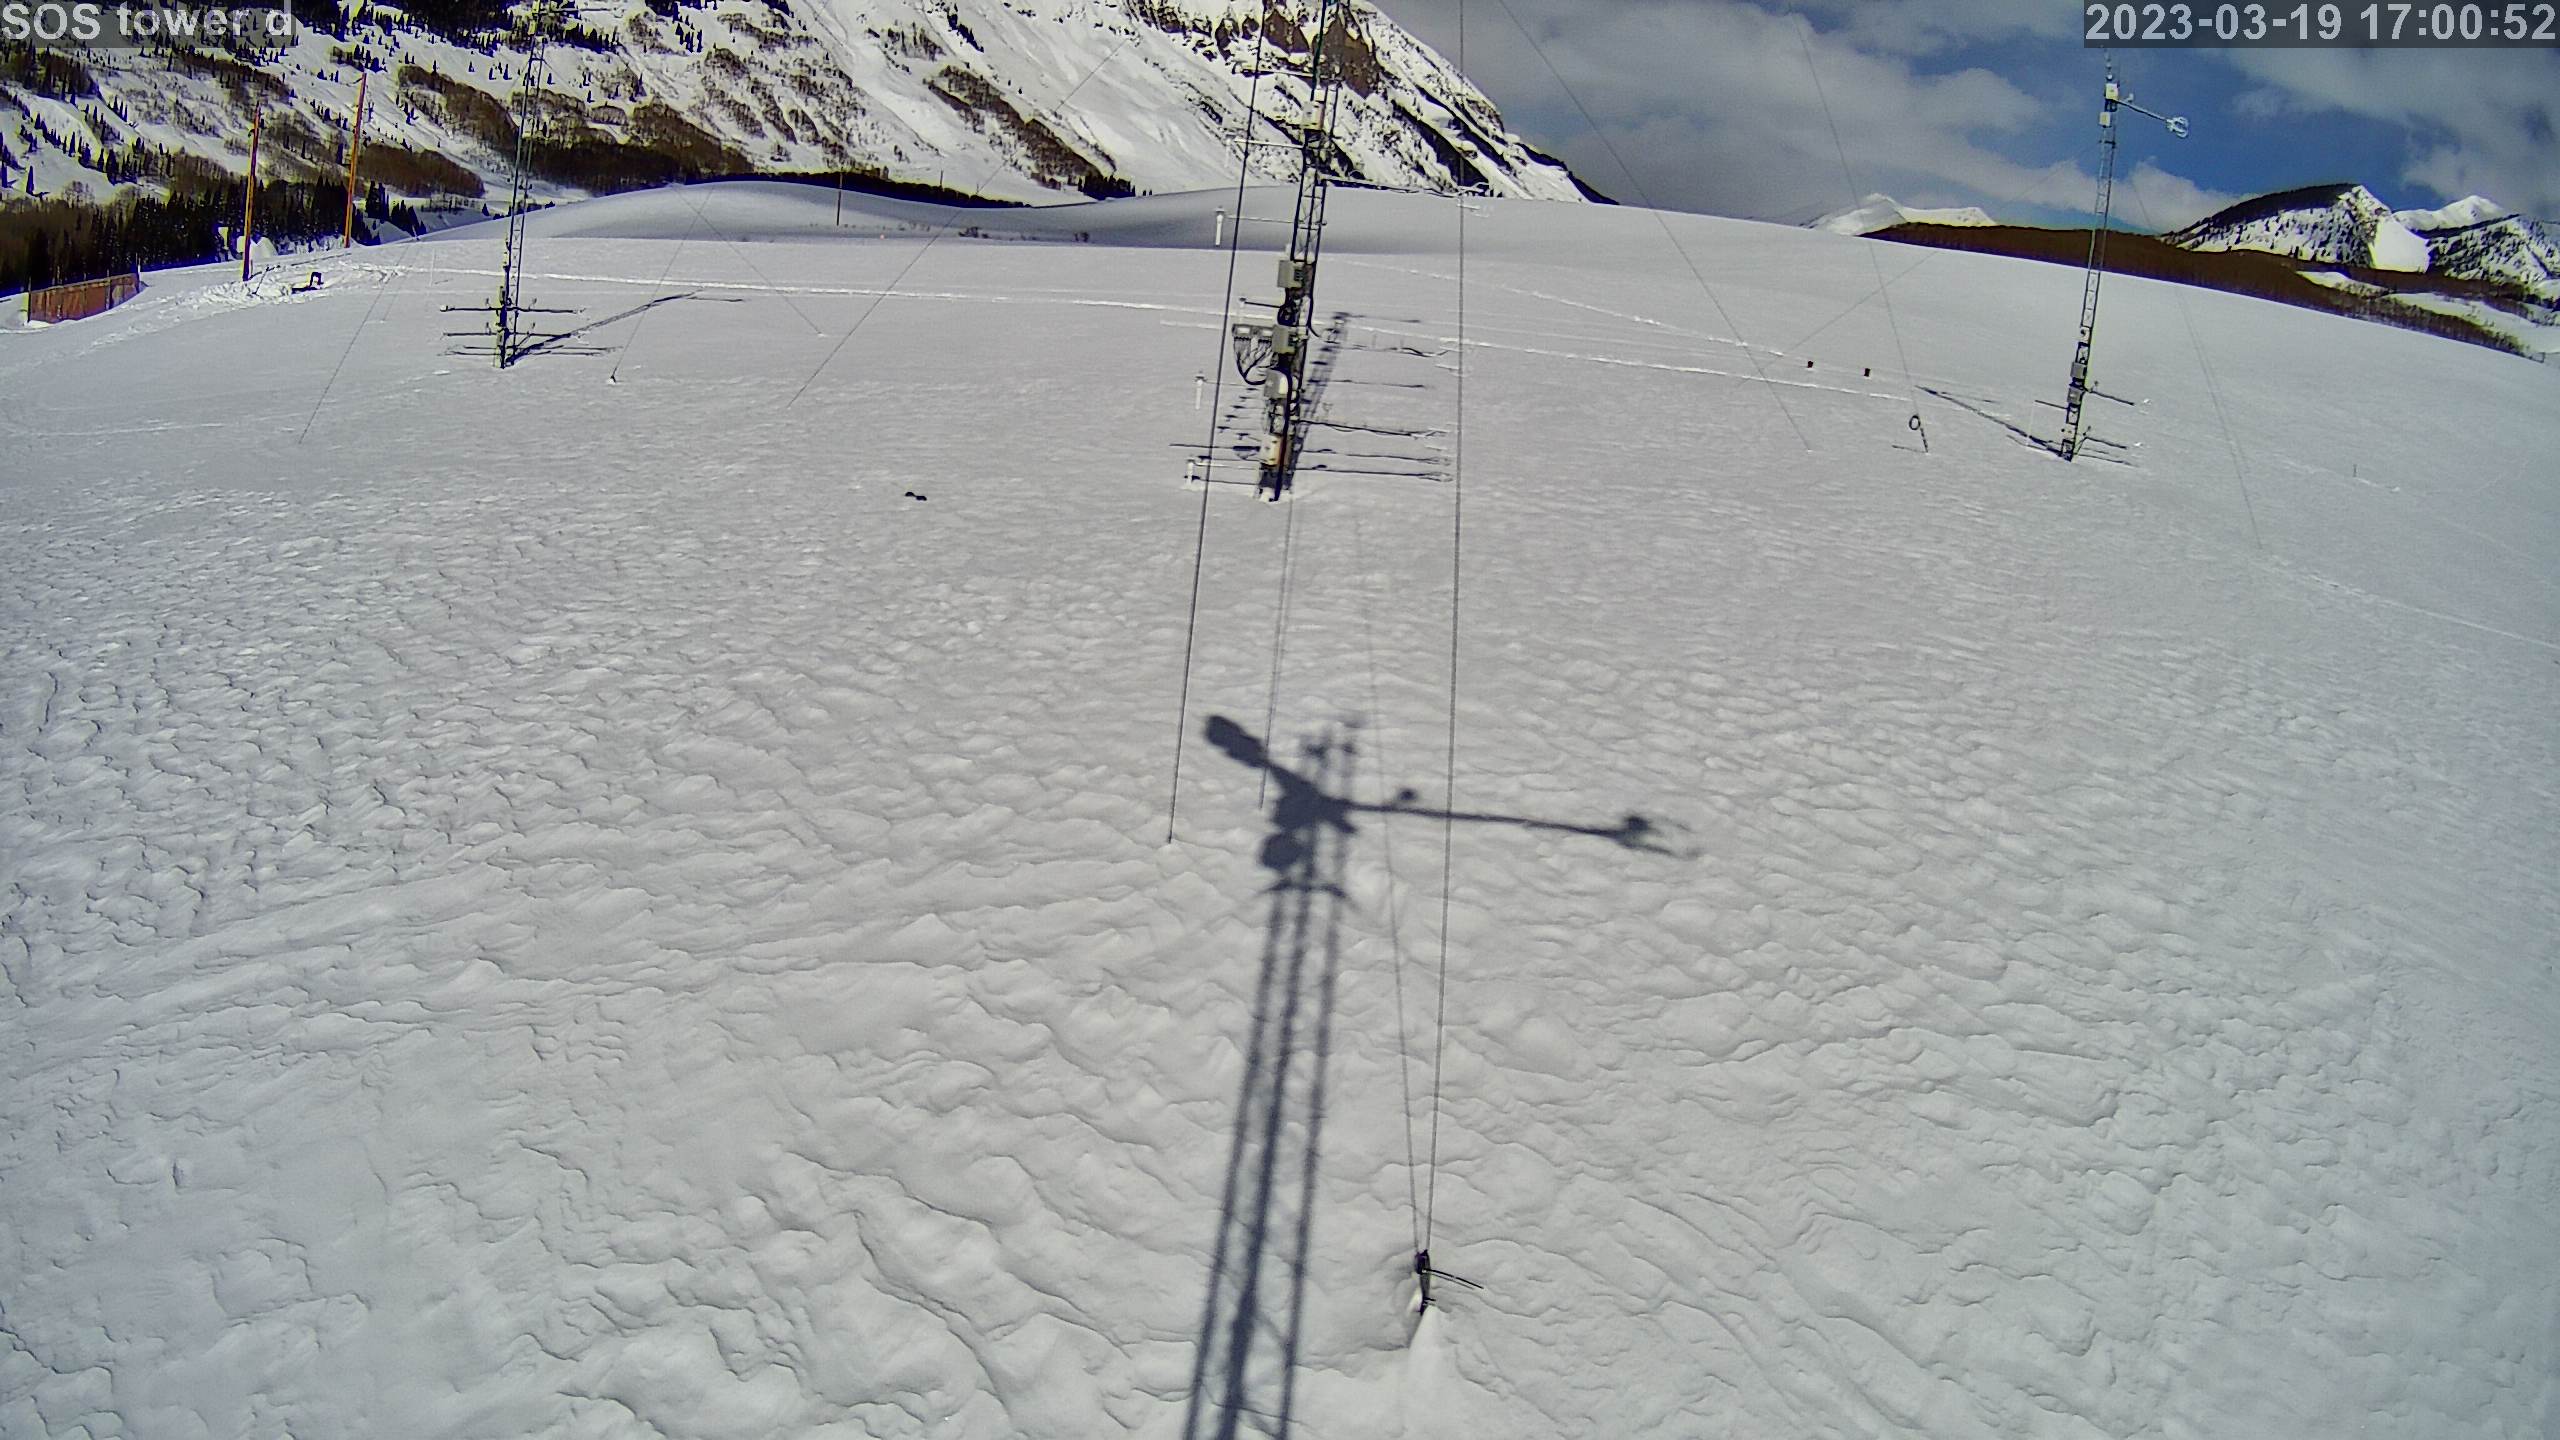
|
photo 2023031918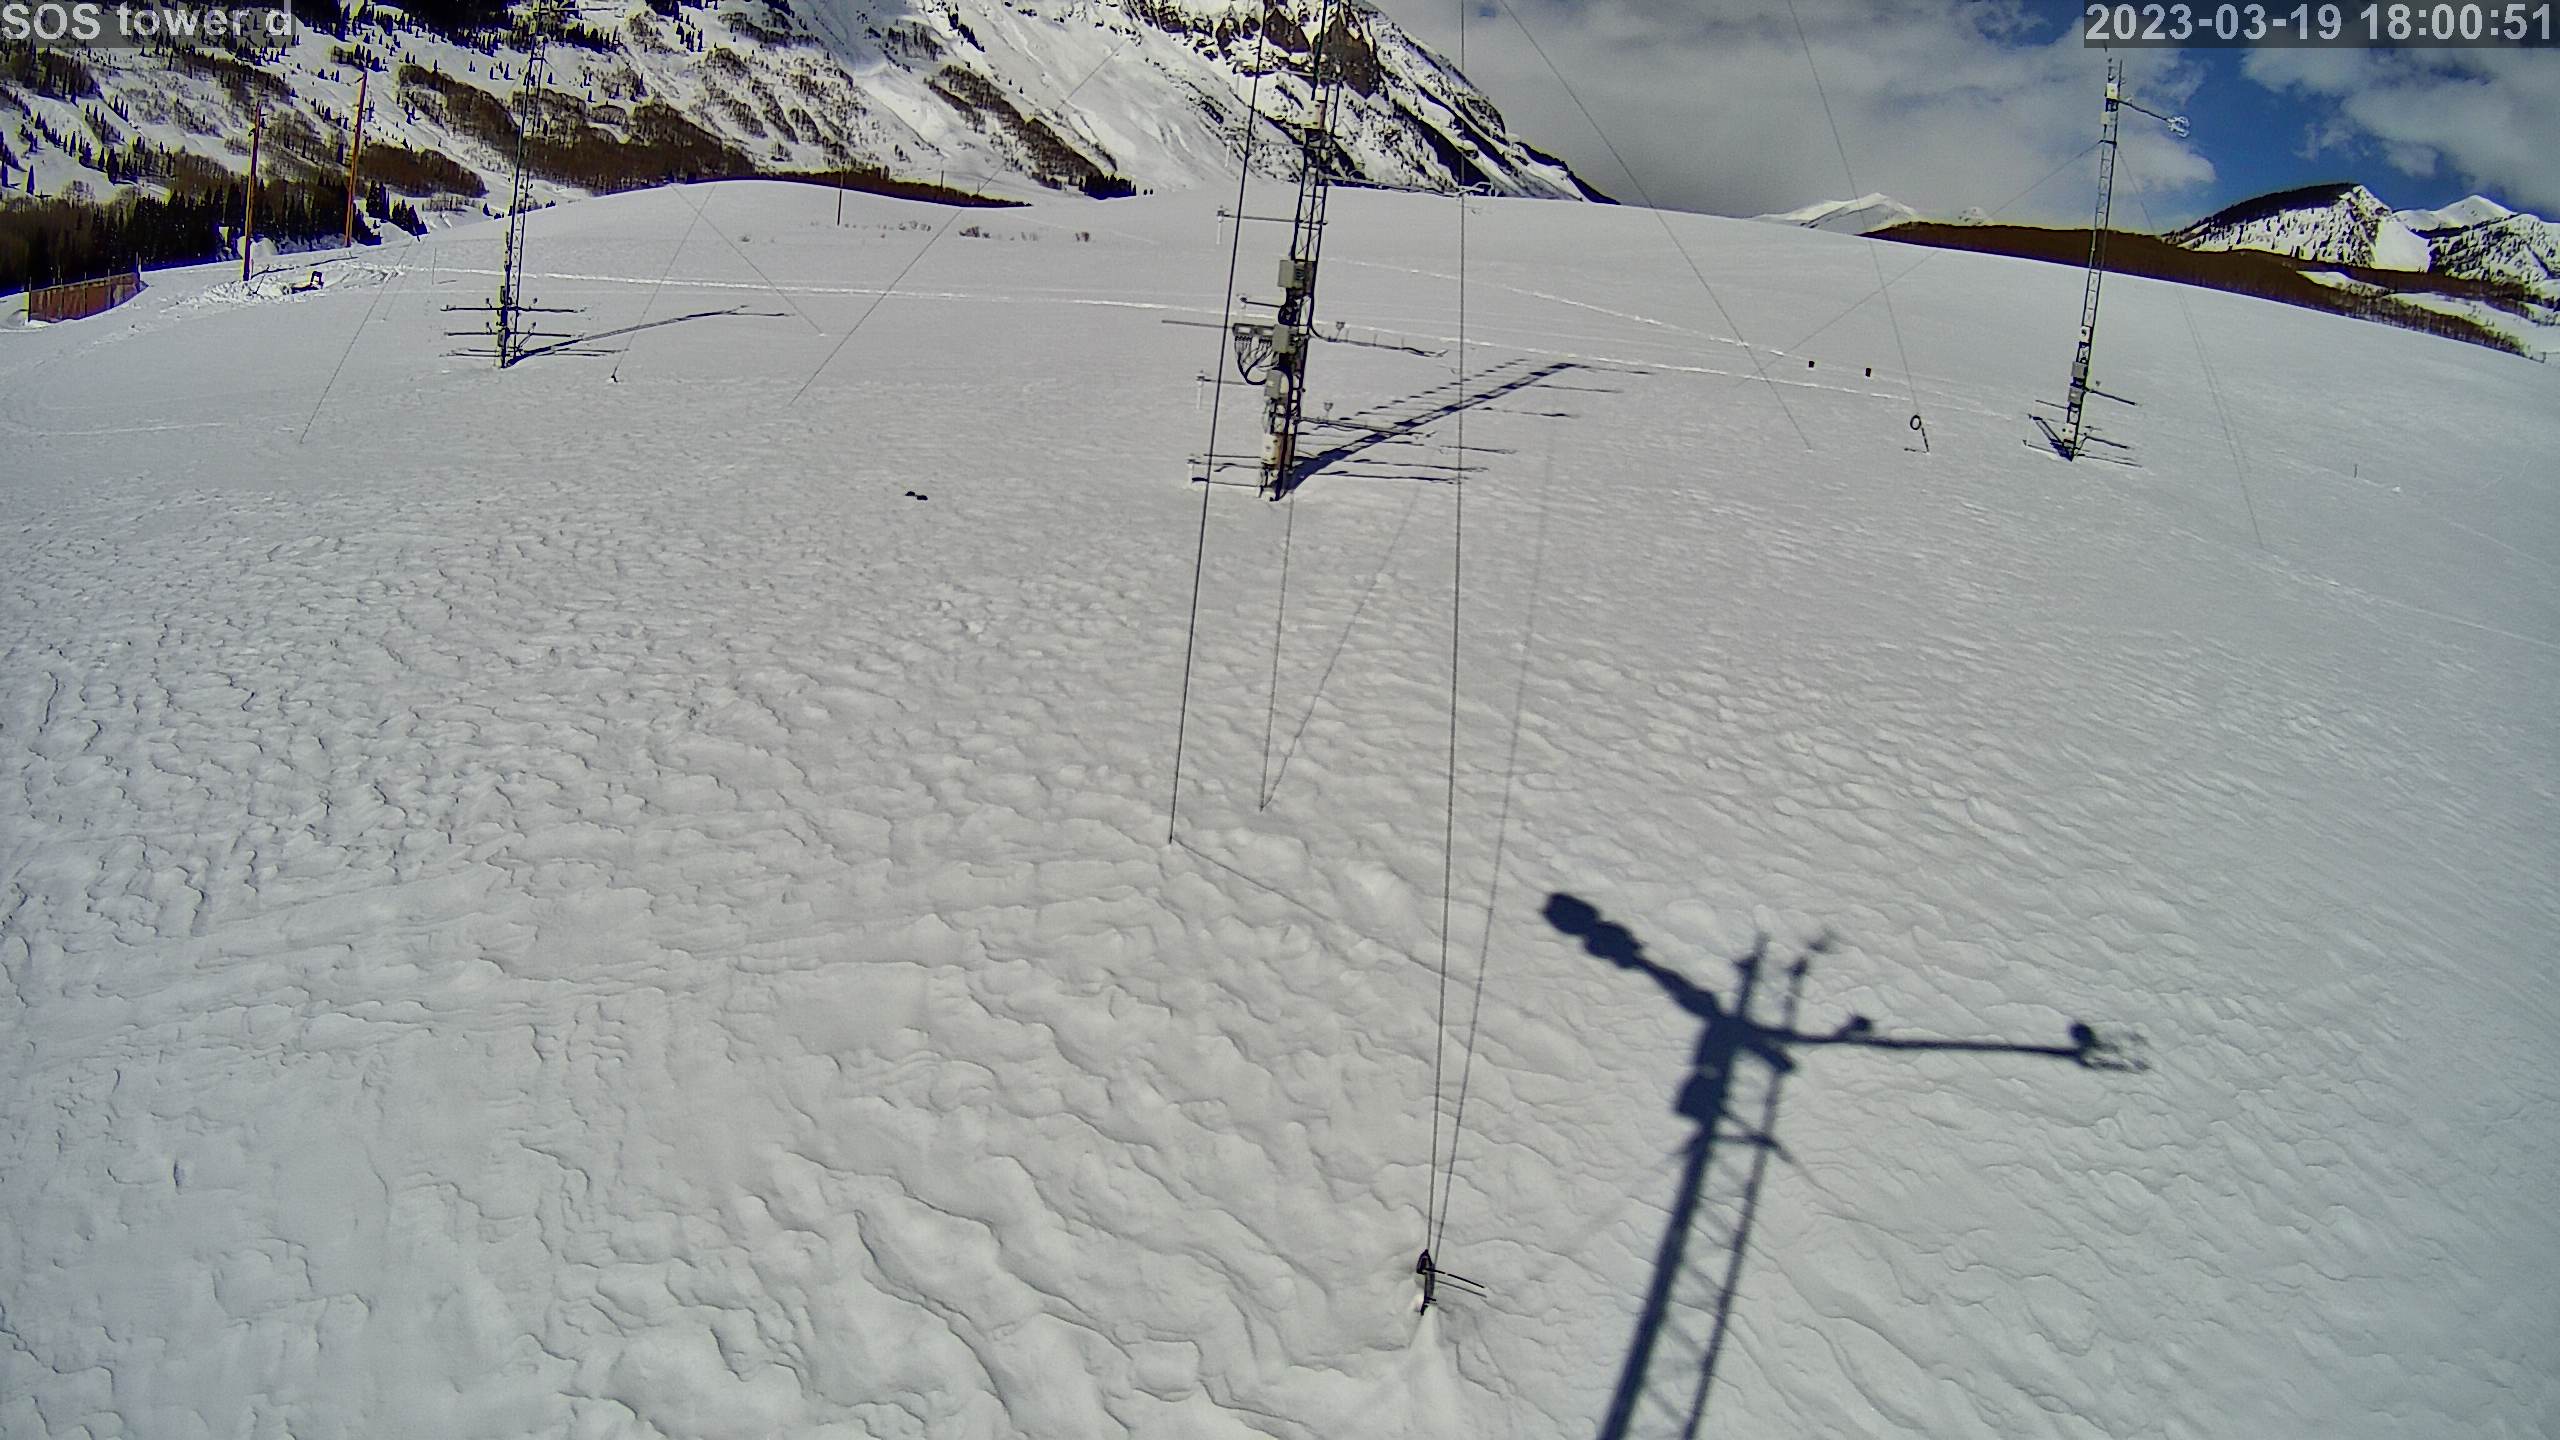
|
photo 2023031919
|
photo 2023031920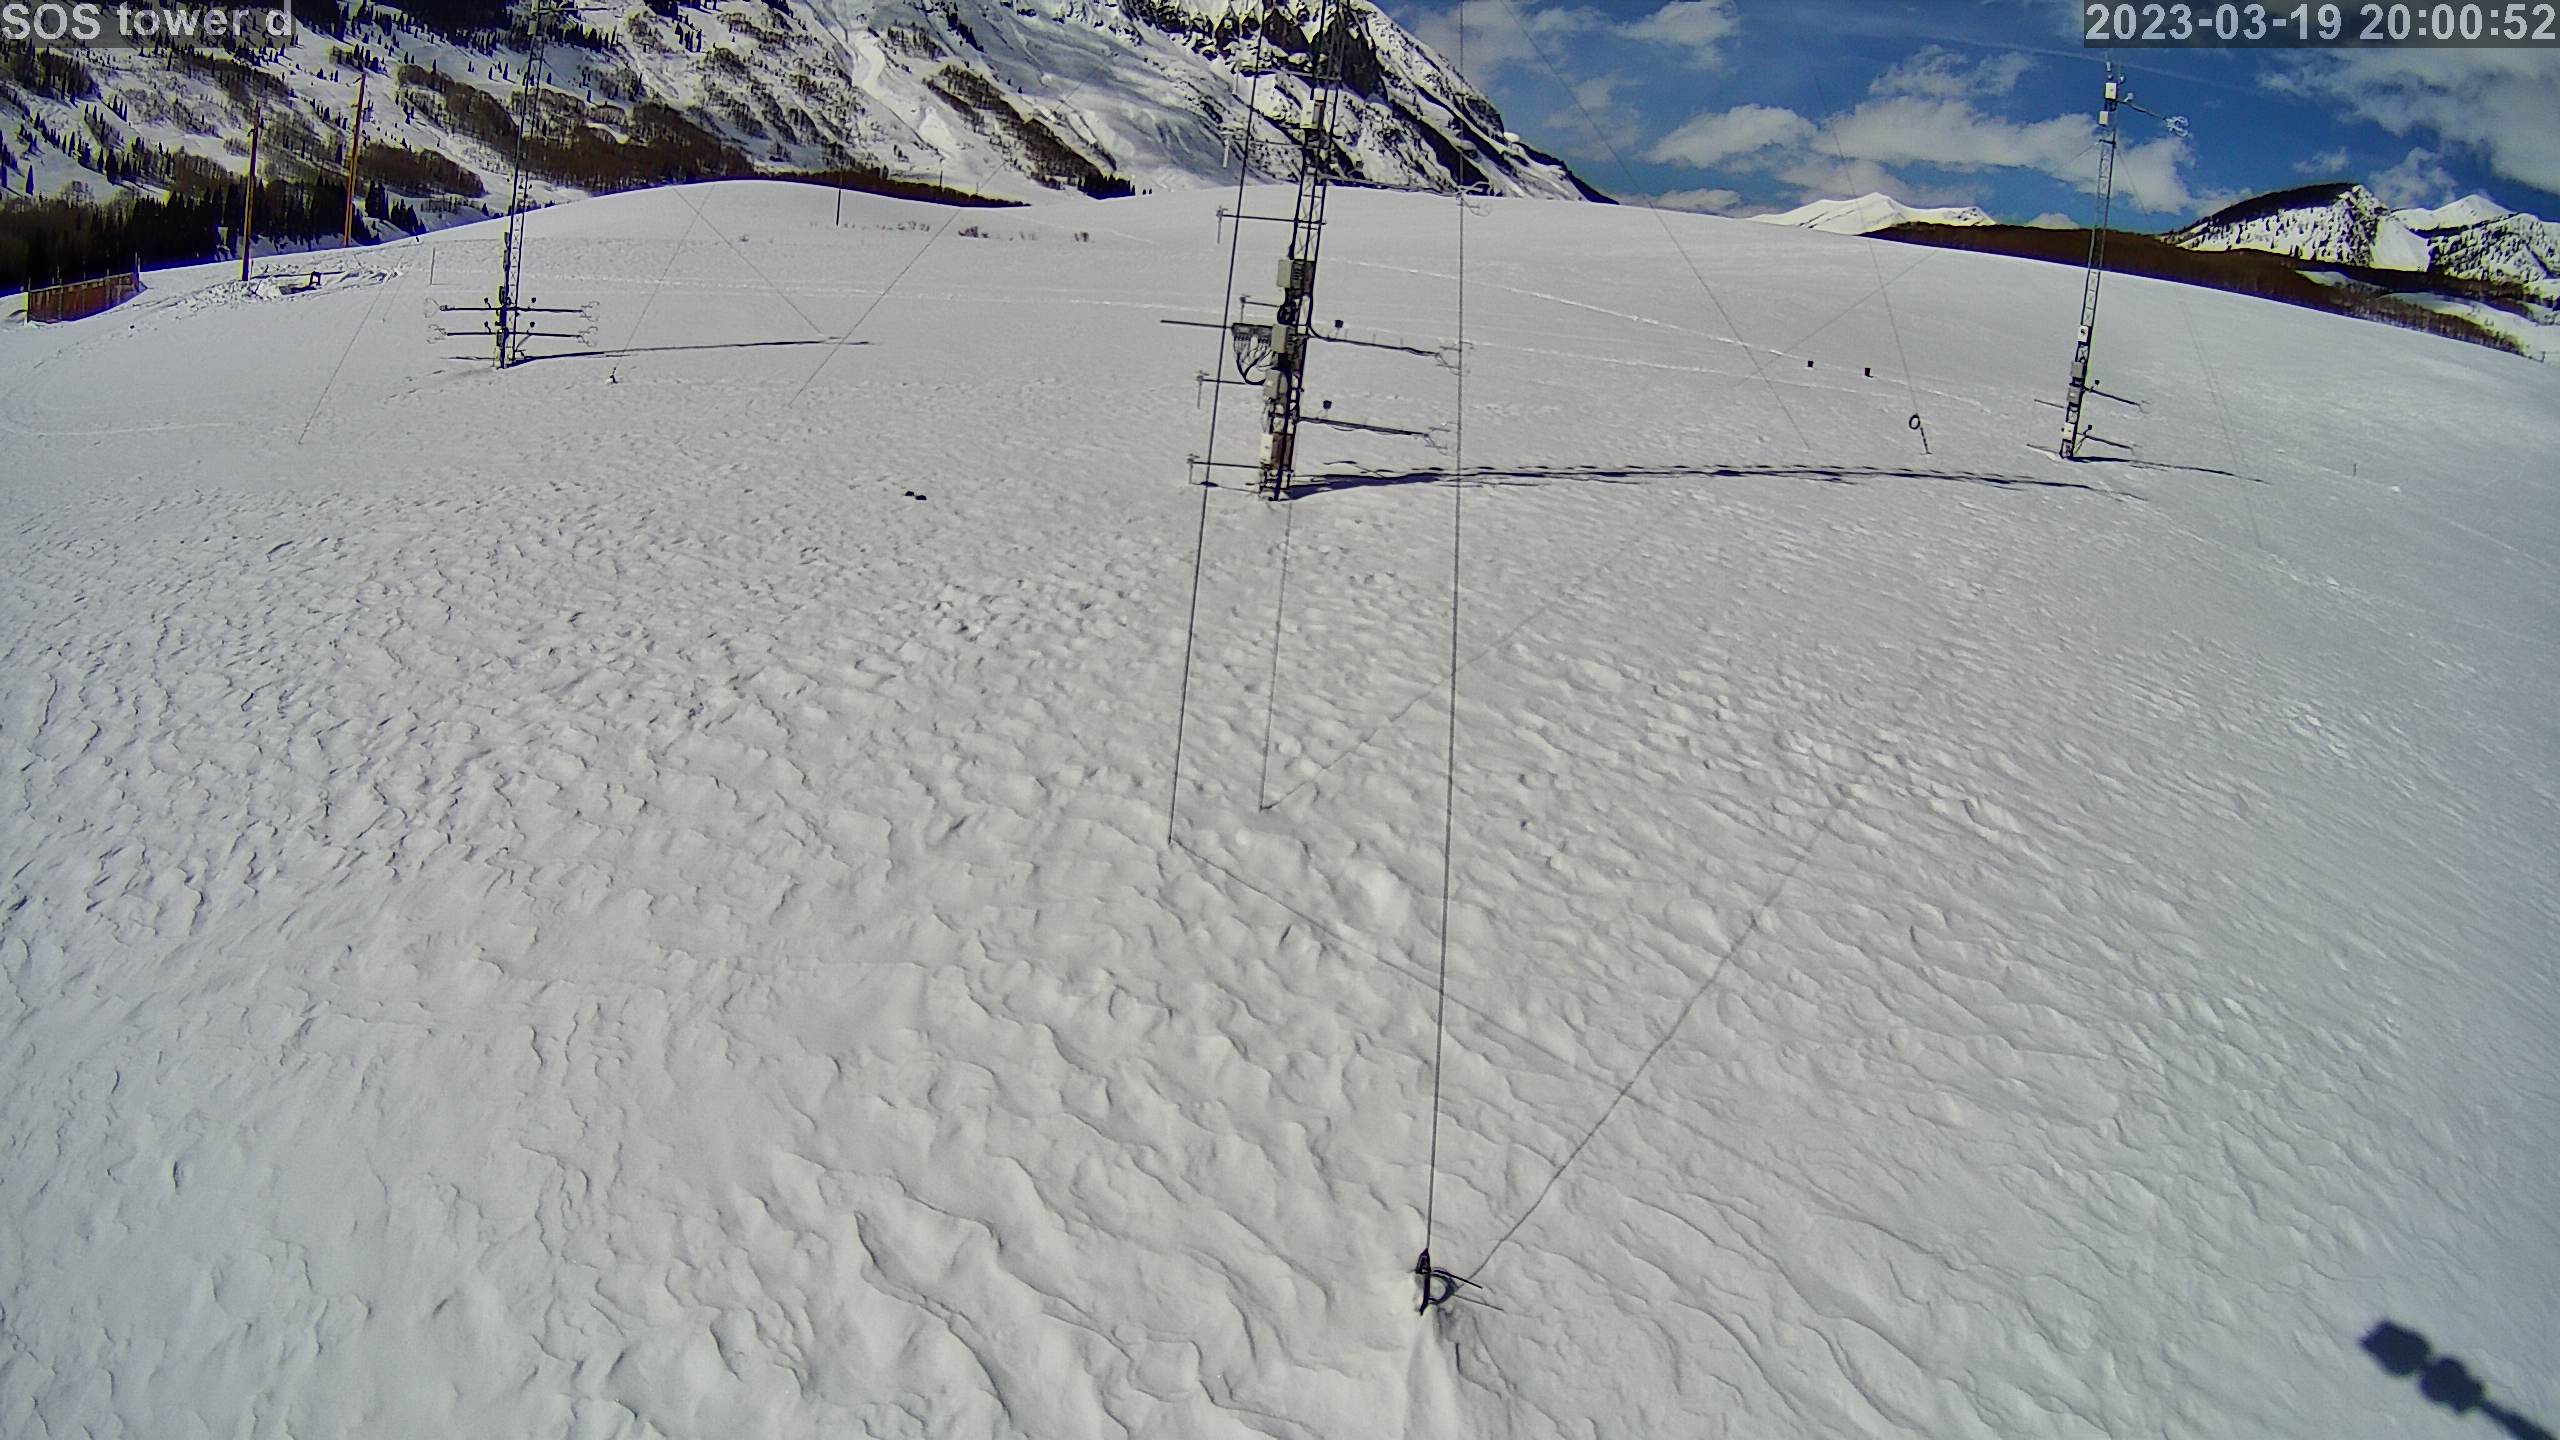
|
photo 2023031921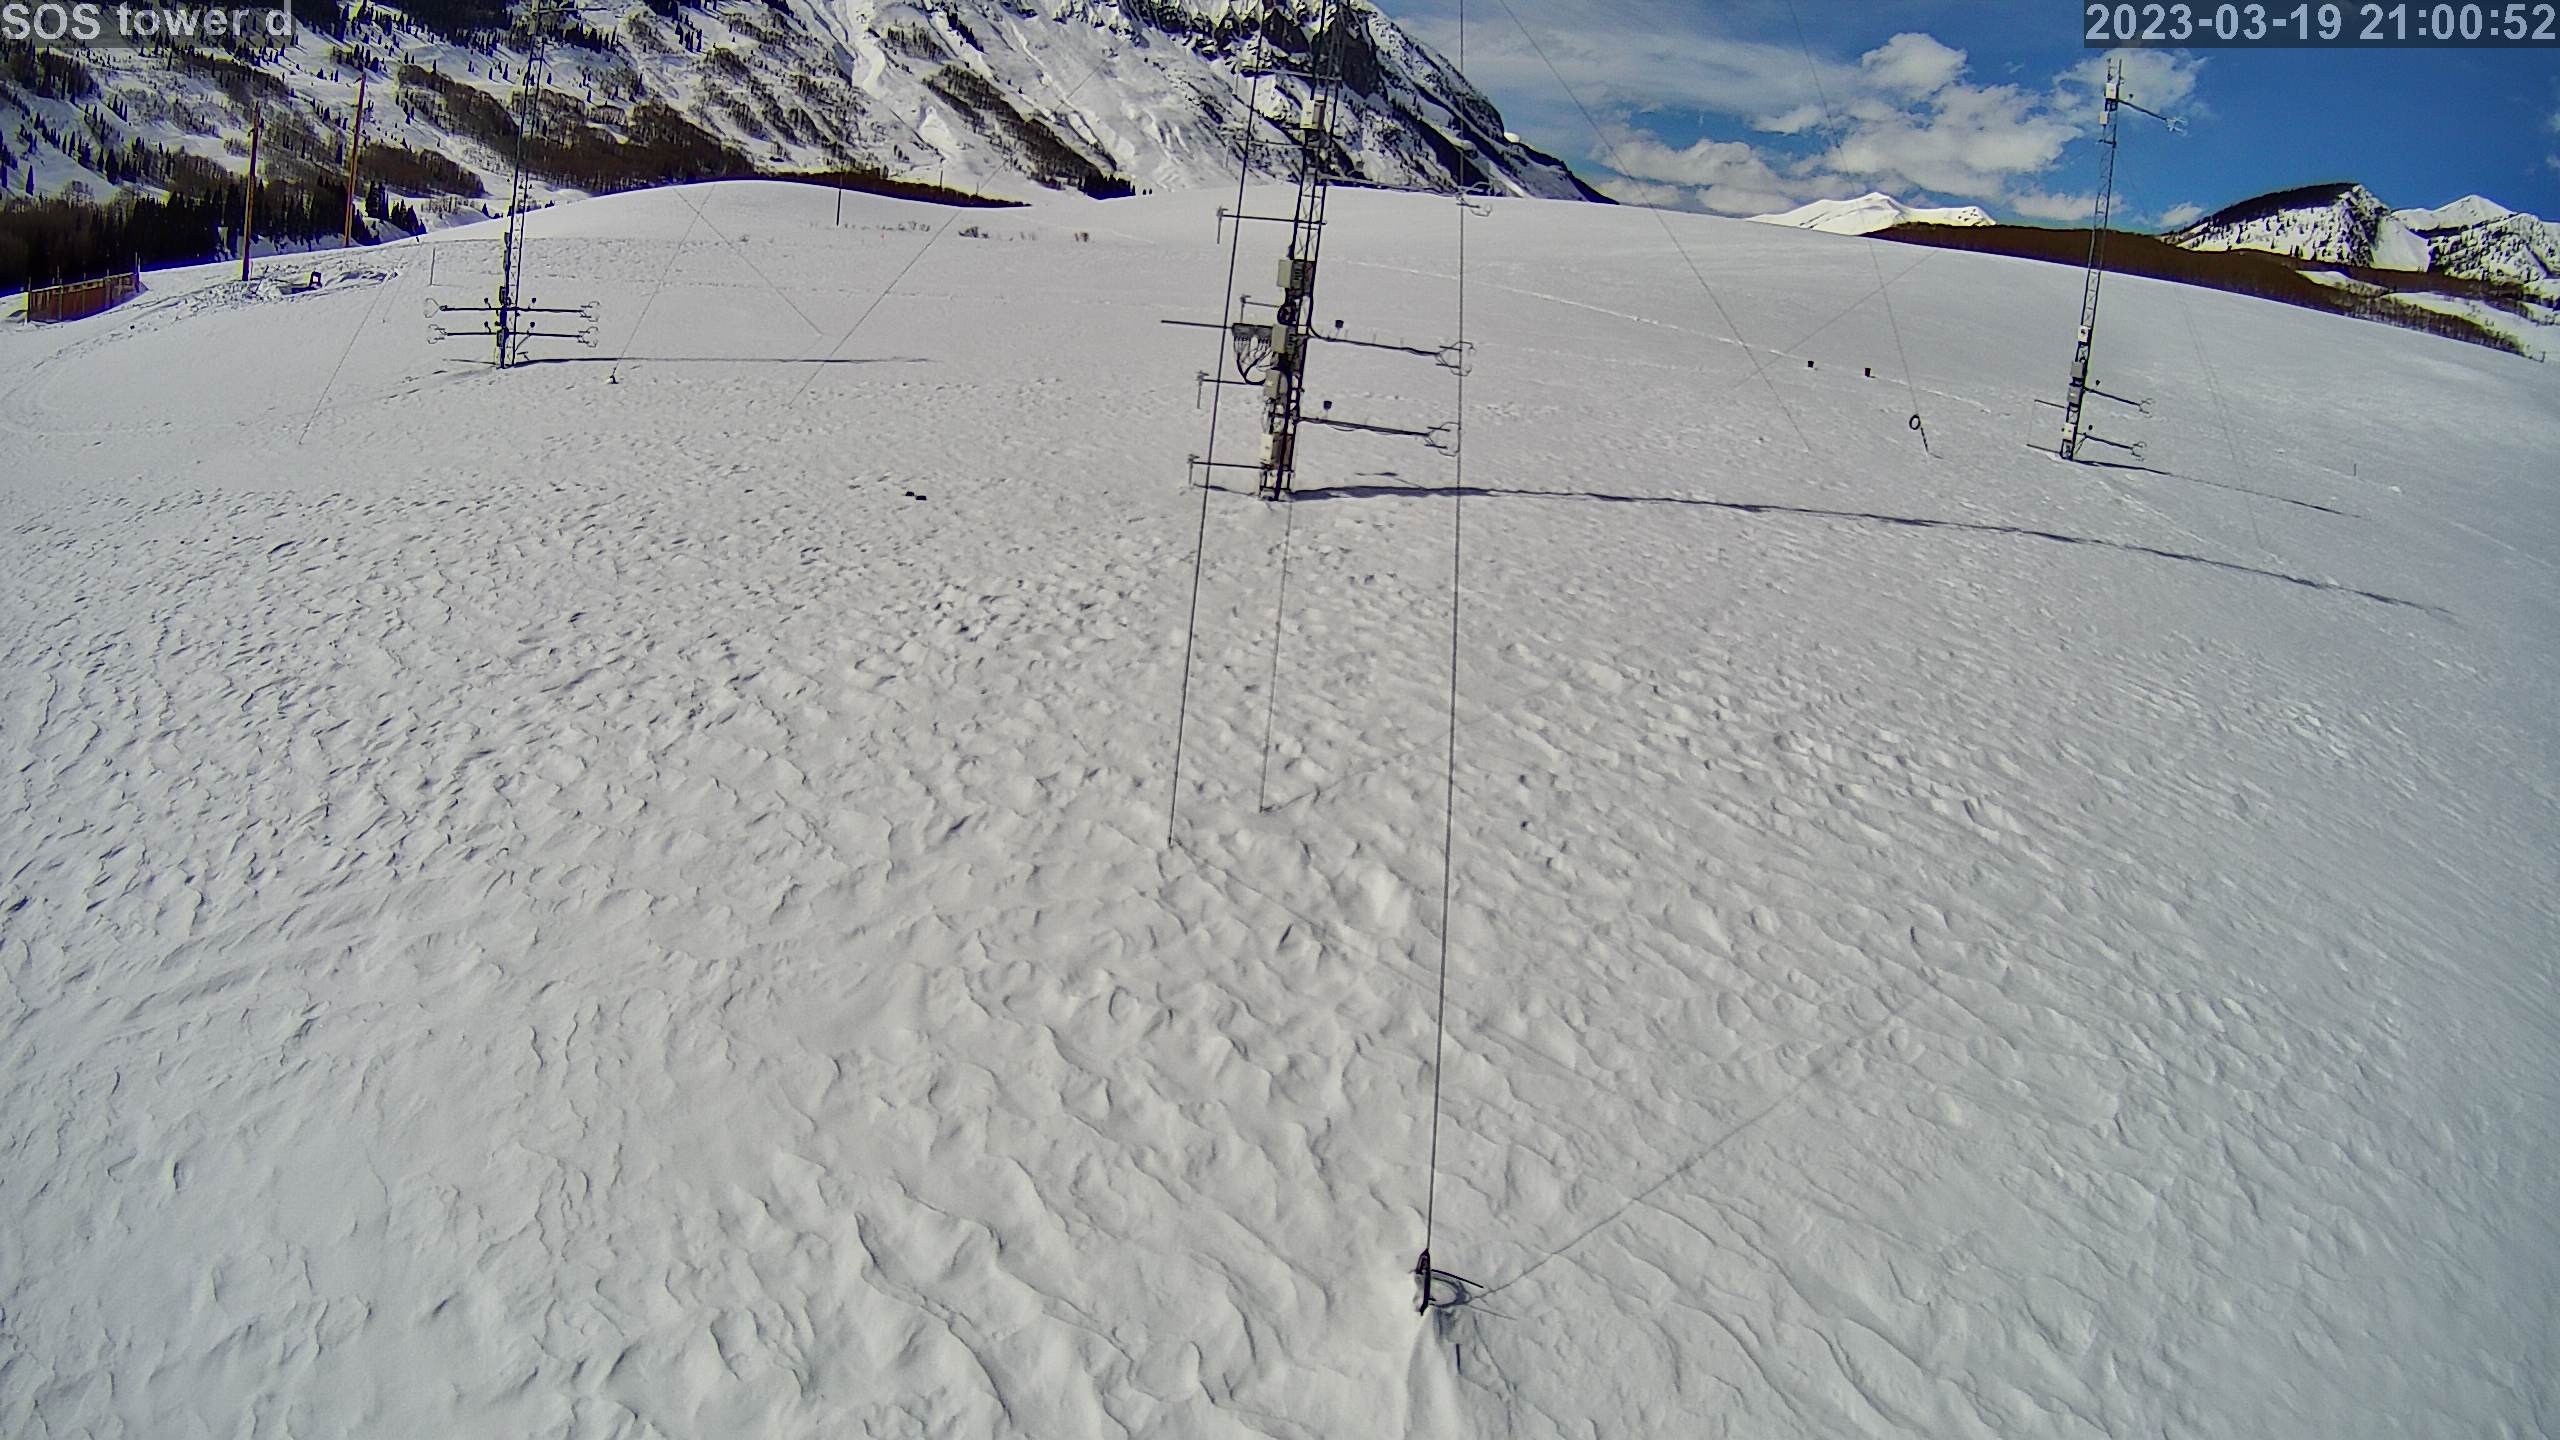
|
photo 2023031922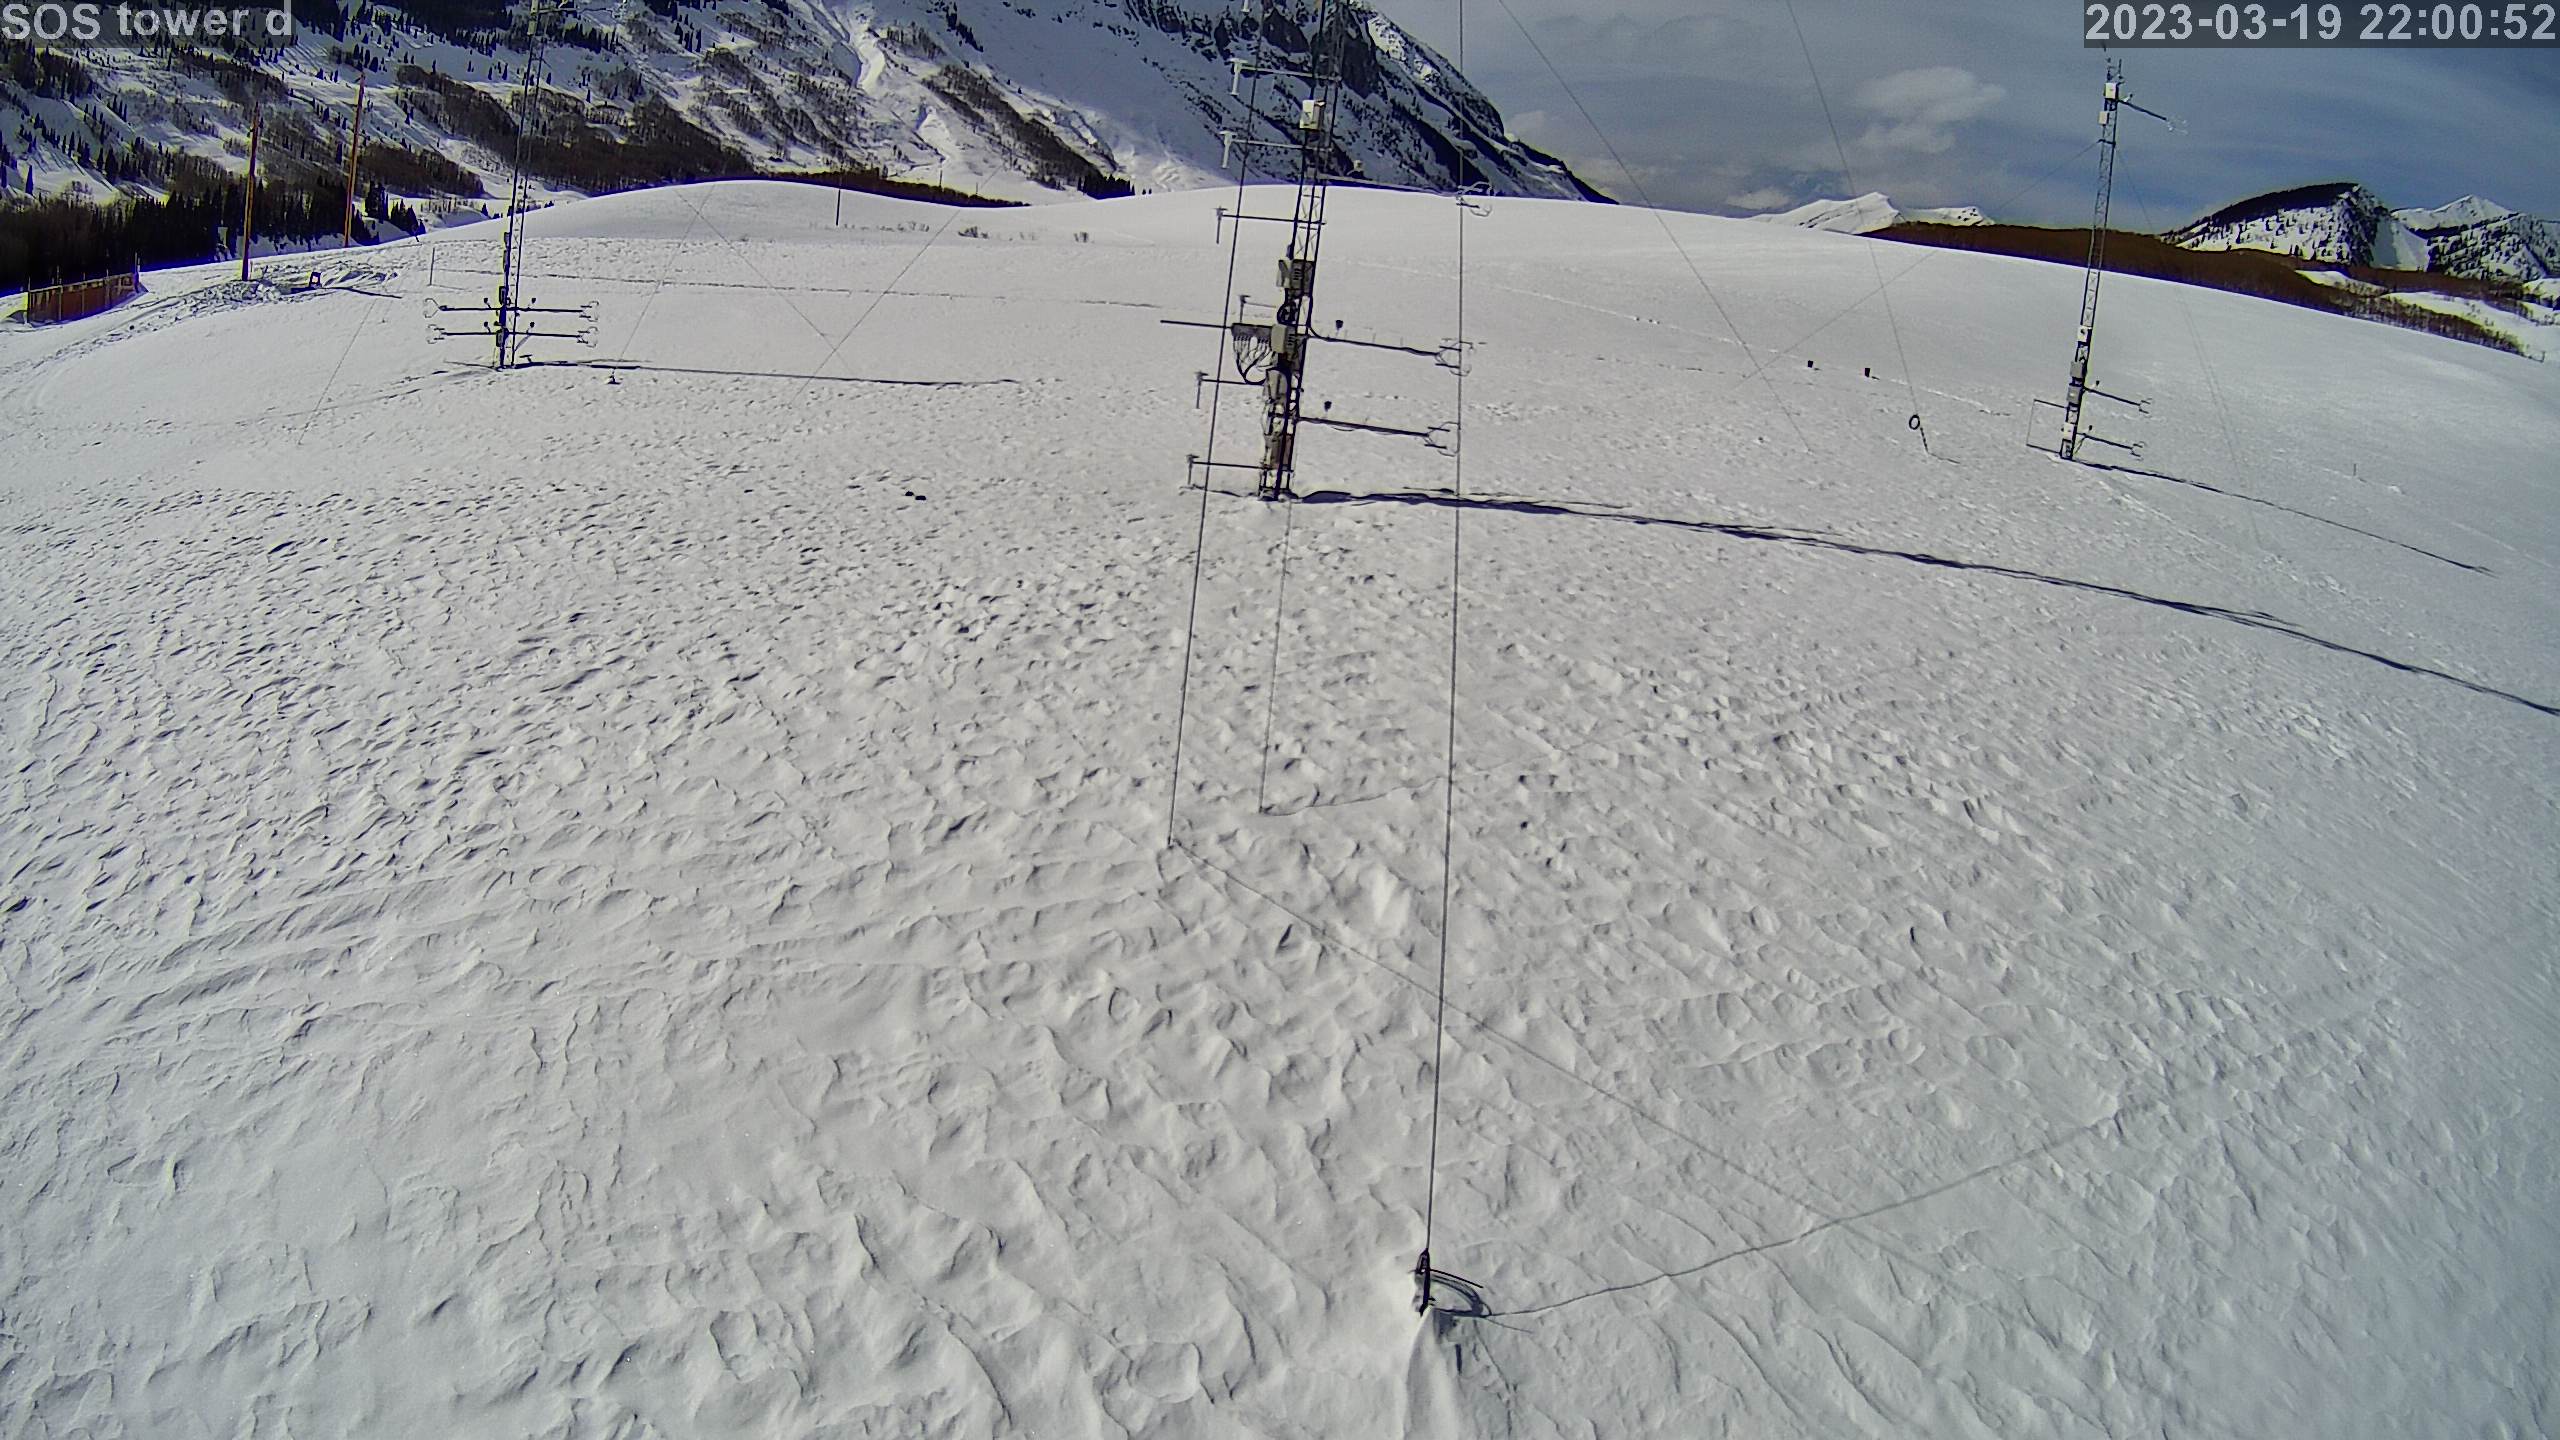
|
photo 2023031923
|