| Previous day | Select day | Next day |
The most recent plots are generally updated every 15 minutes. Use the browser reload button to make sure you are seeing the latest version of a plot.
In order to distinquish the traces on the vertical profile plots, a slight offset in X is added to some traces. This is indicated by a "(n)" in the legend for the trace.
If you right-click on an image, most browsers will provide a menu to download or display the plot in another window.
photo 20230318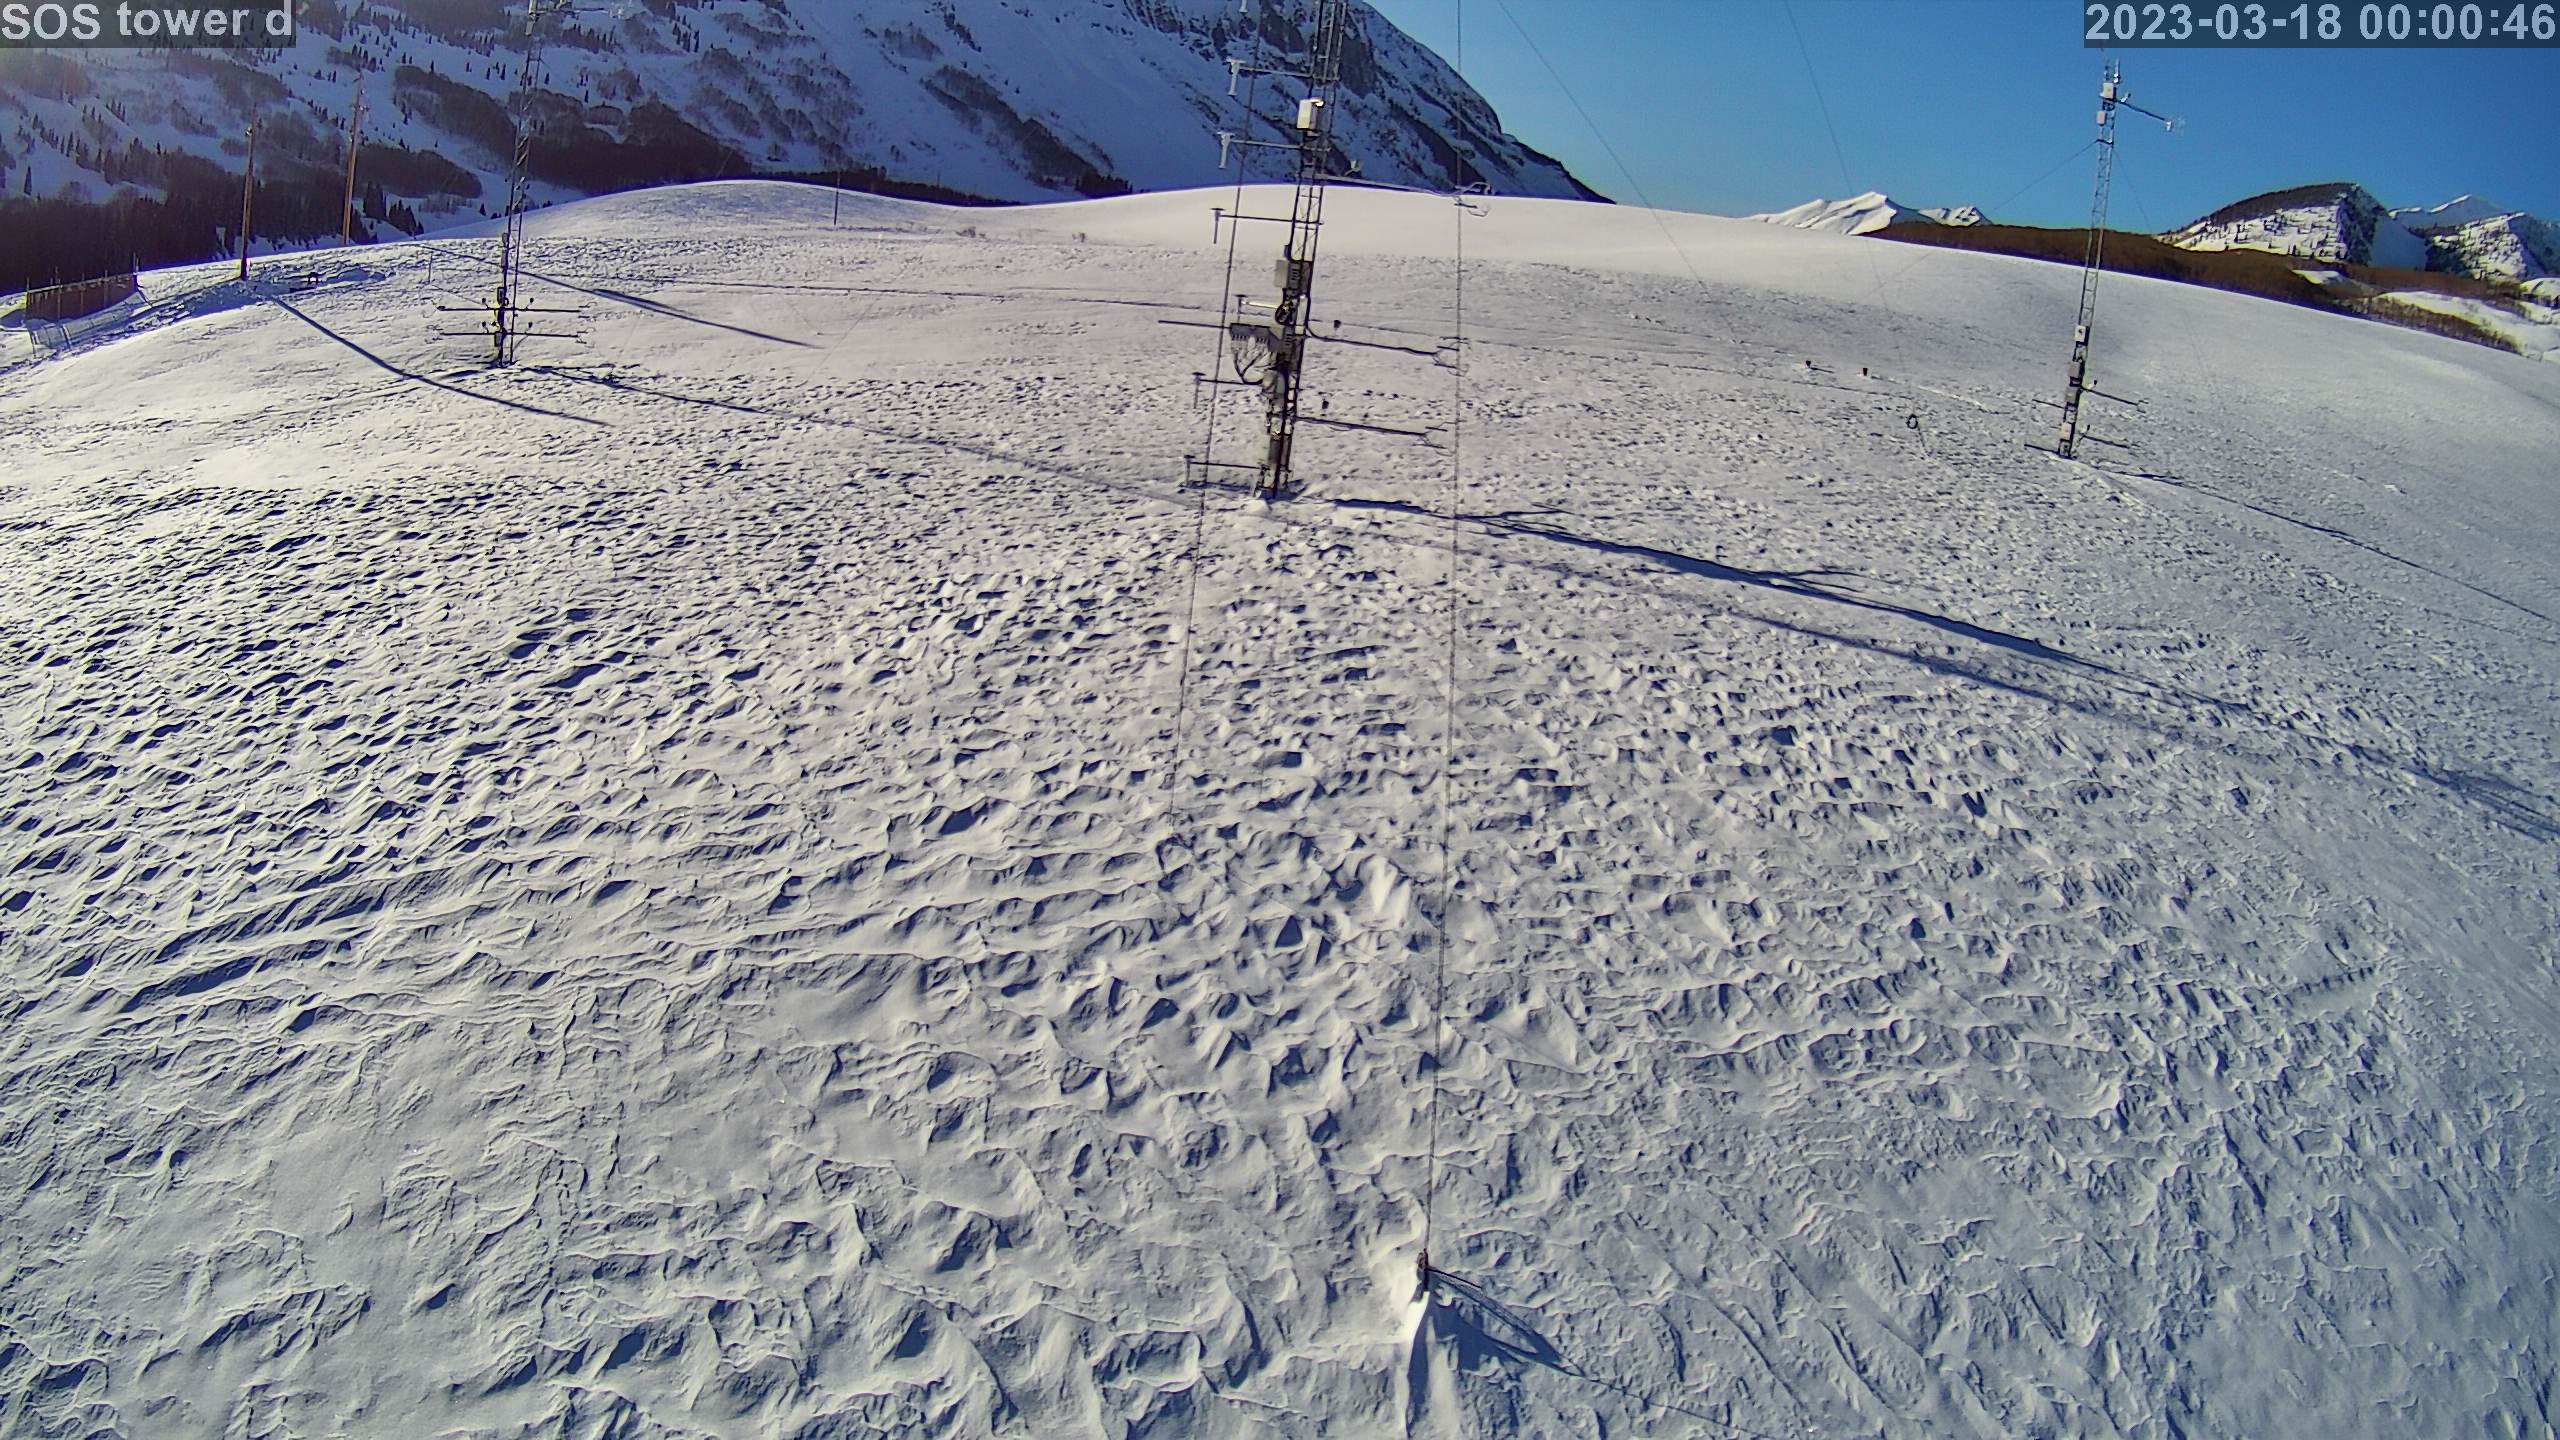
|
photo 2023031801
|
photo 2023031802
|
photo 2023031803
|
photo 2023031804
|
photo 2023031805
|
photo 2023031806
|
photo 2023031807
|
photo 2023031808
|
photo 2023031809
|
photo 2023031810
|
photo 2023031811
|
photo 2023031812
|
photo 2023031813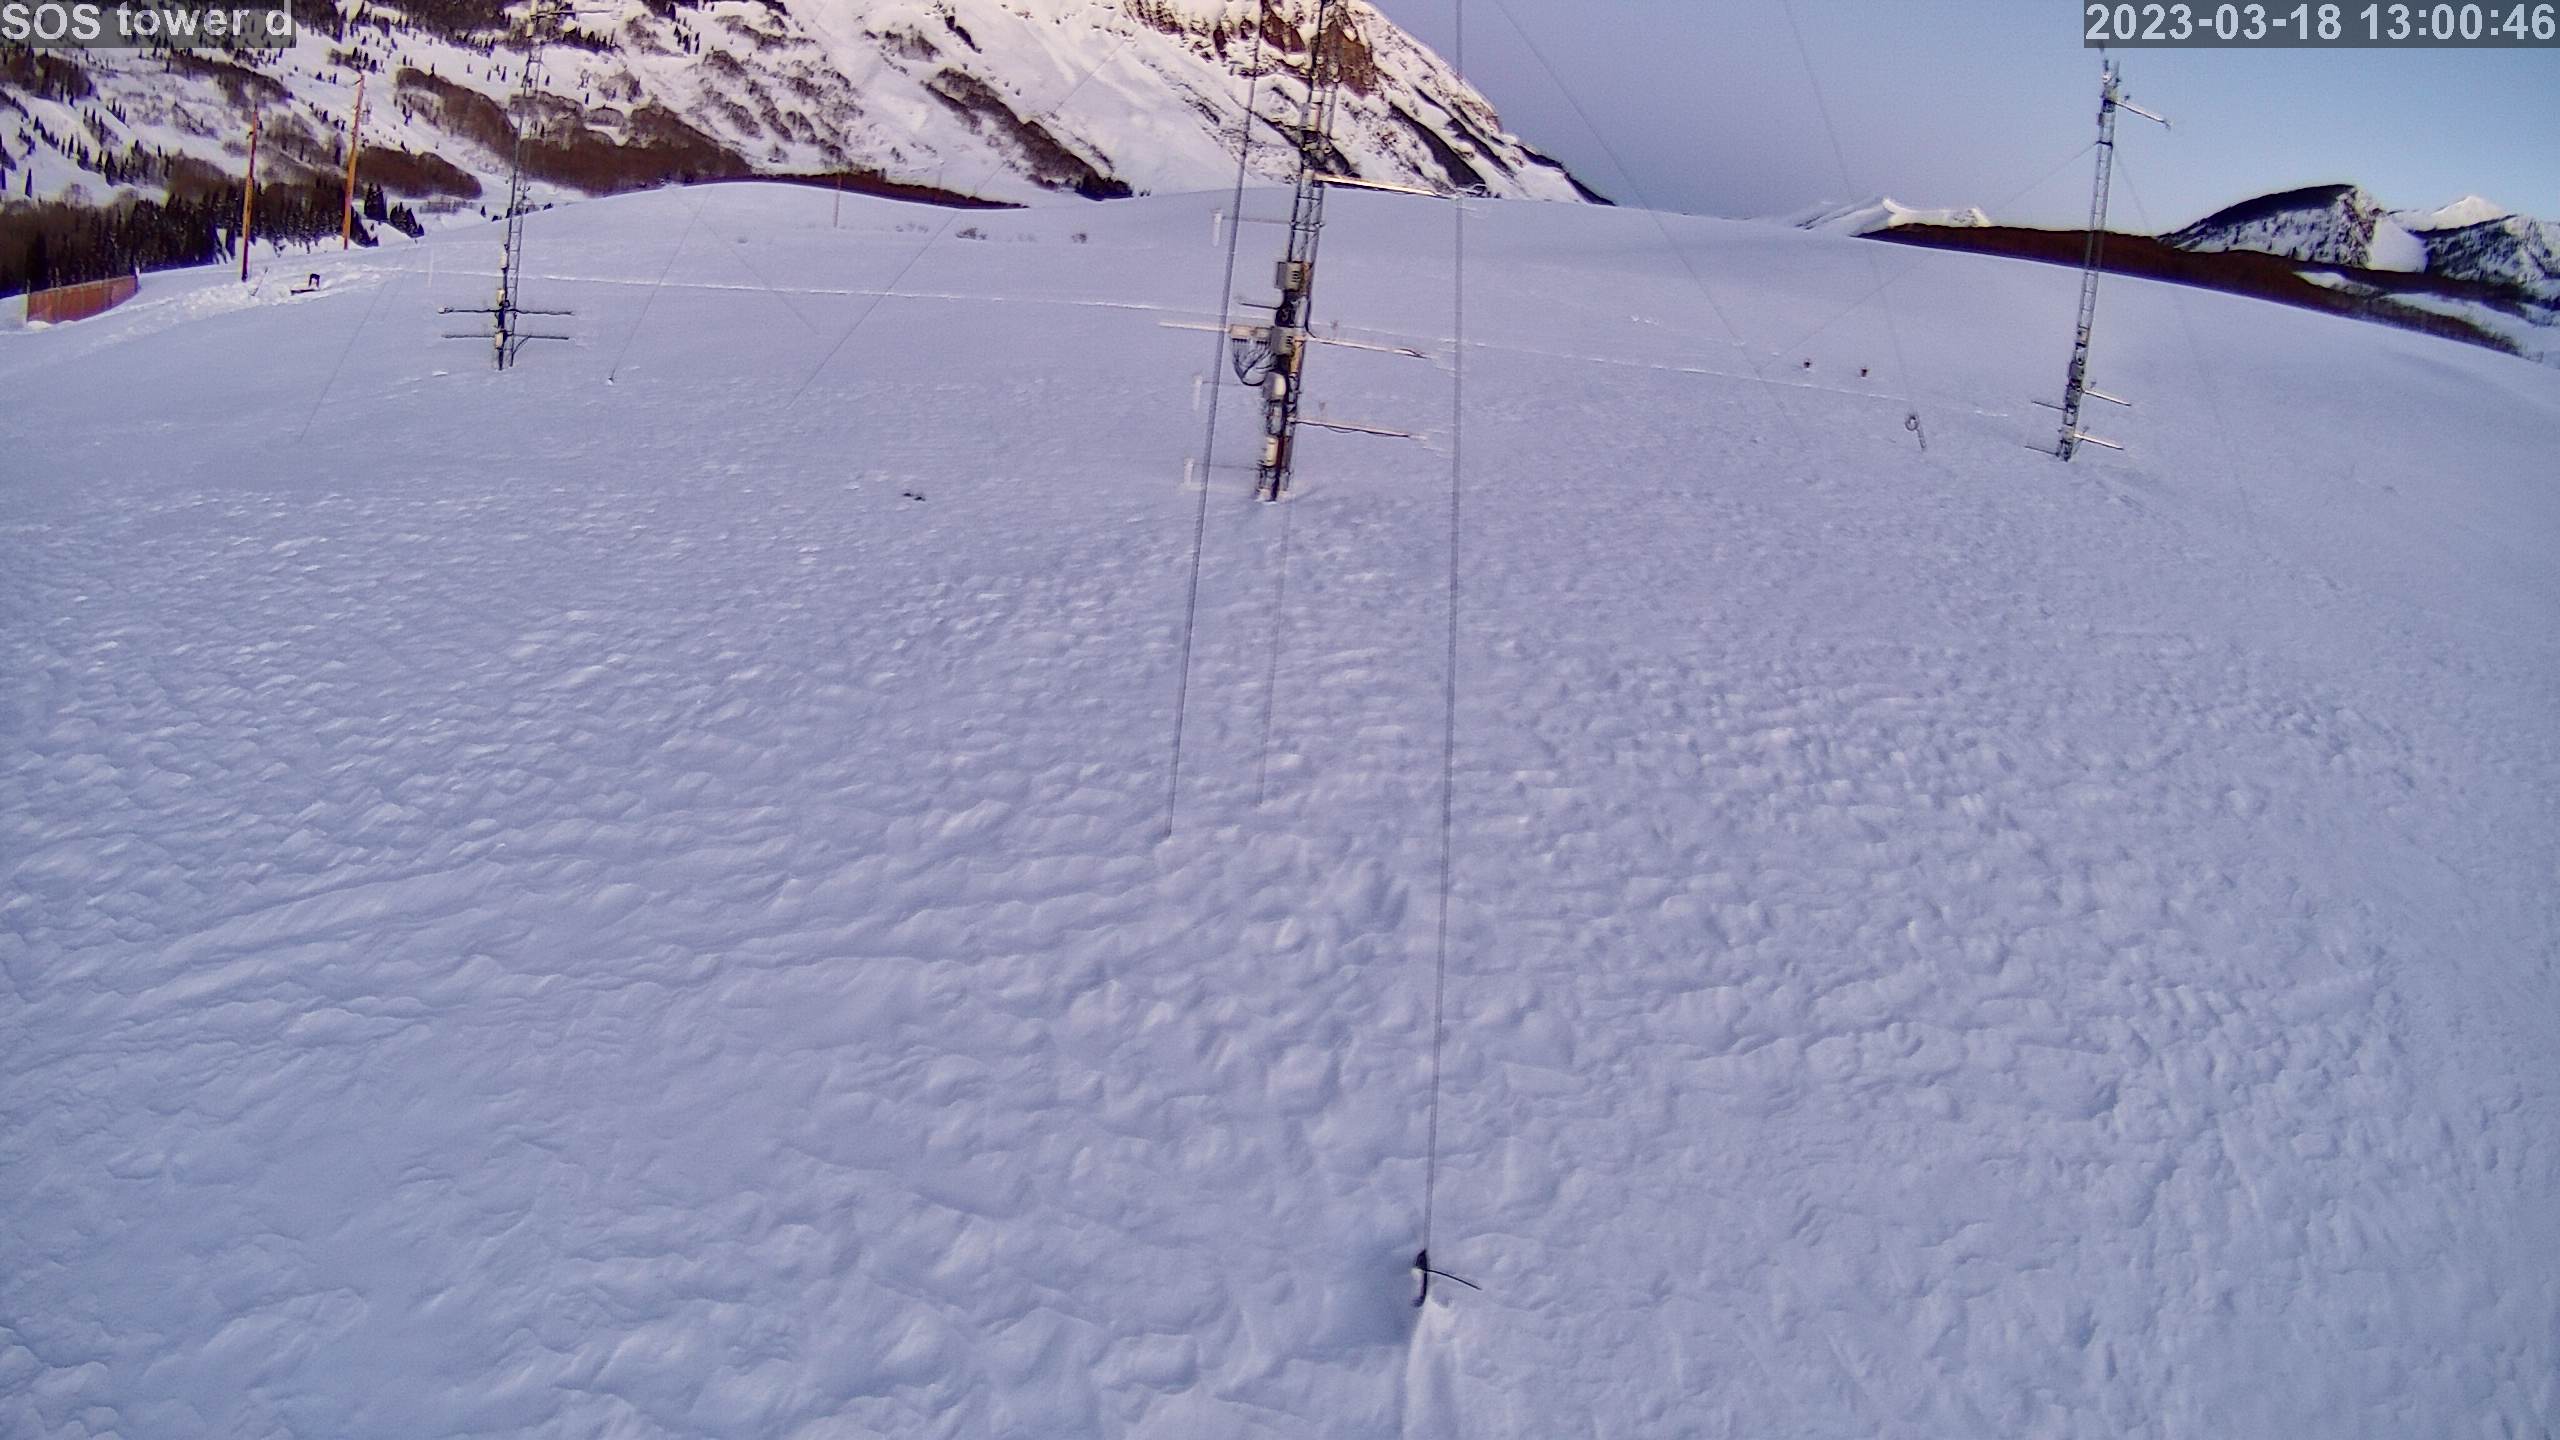
|
photo 2023031814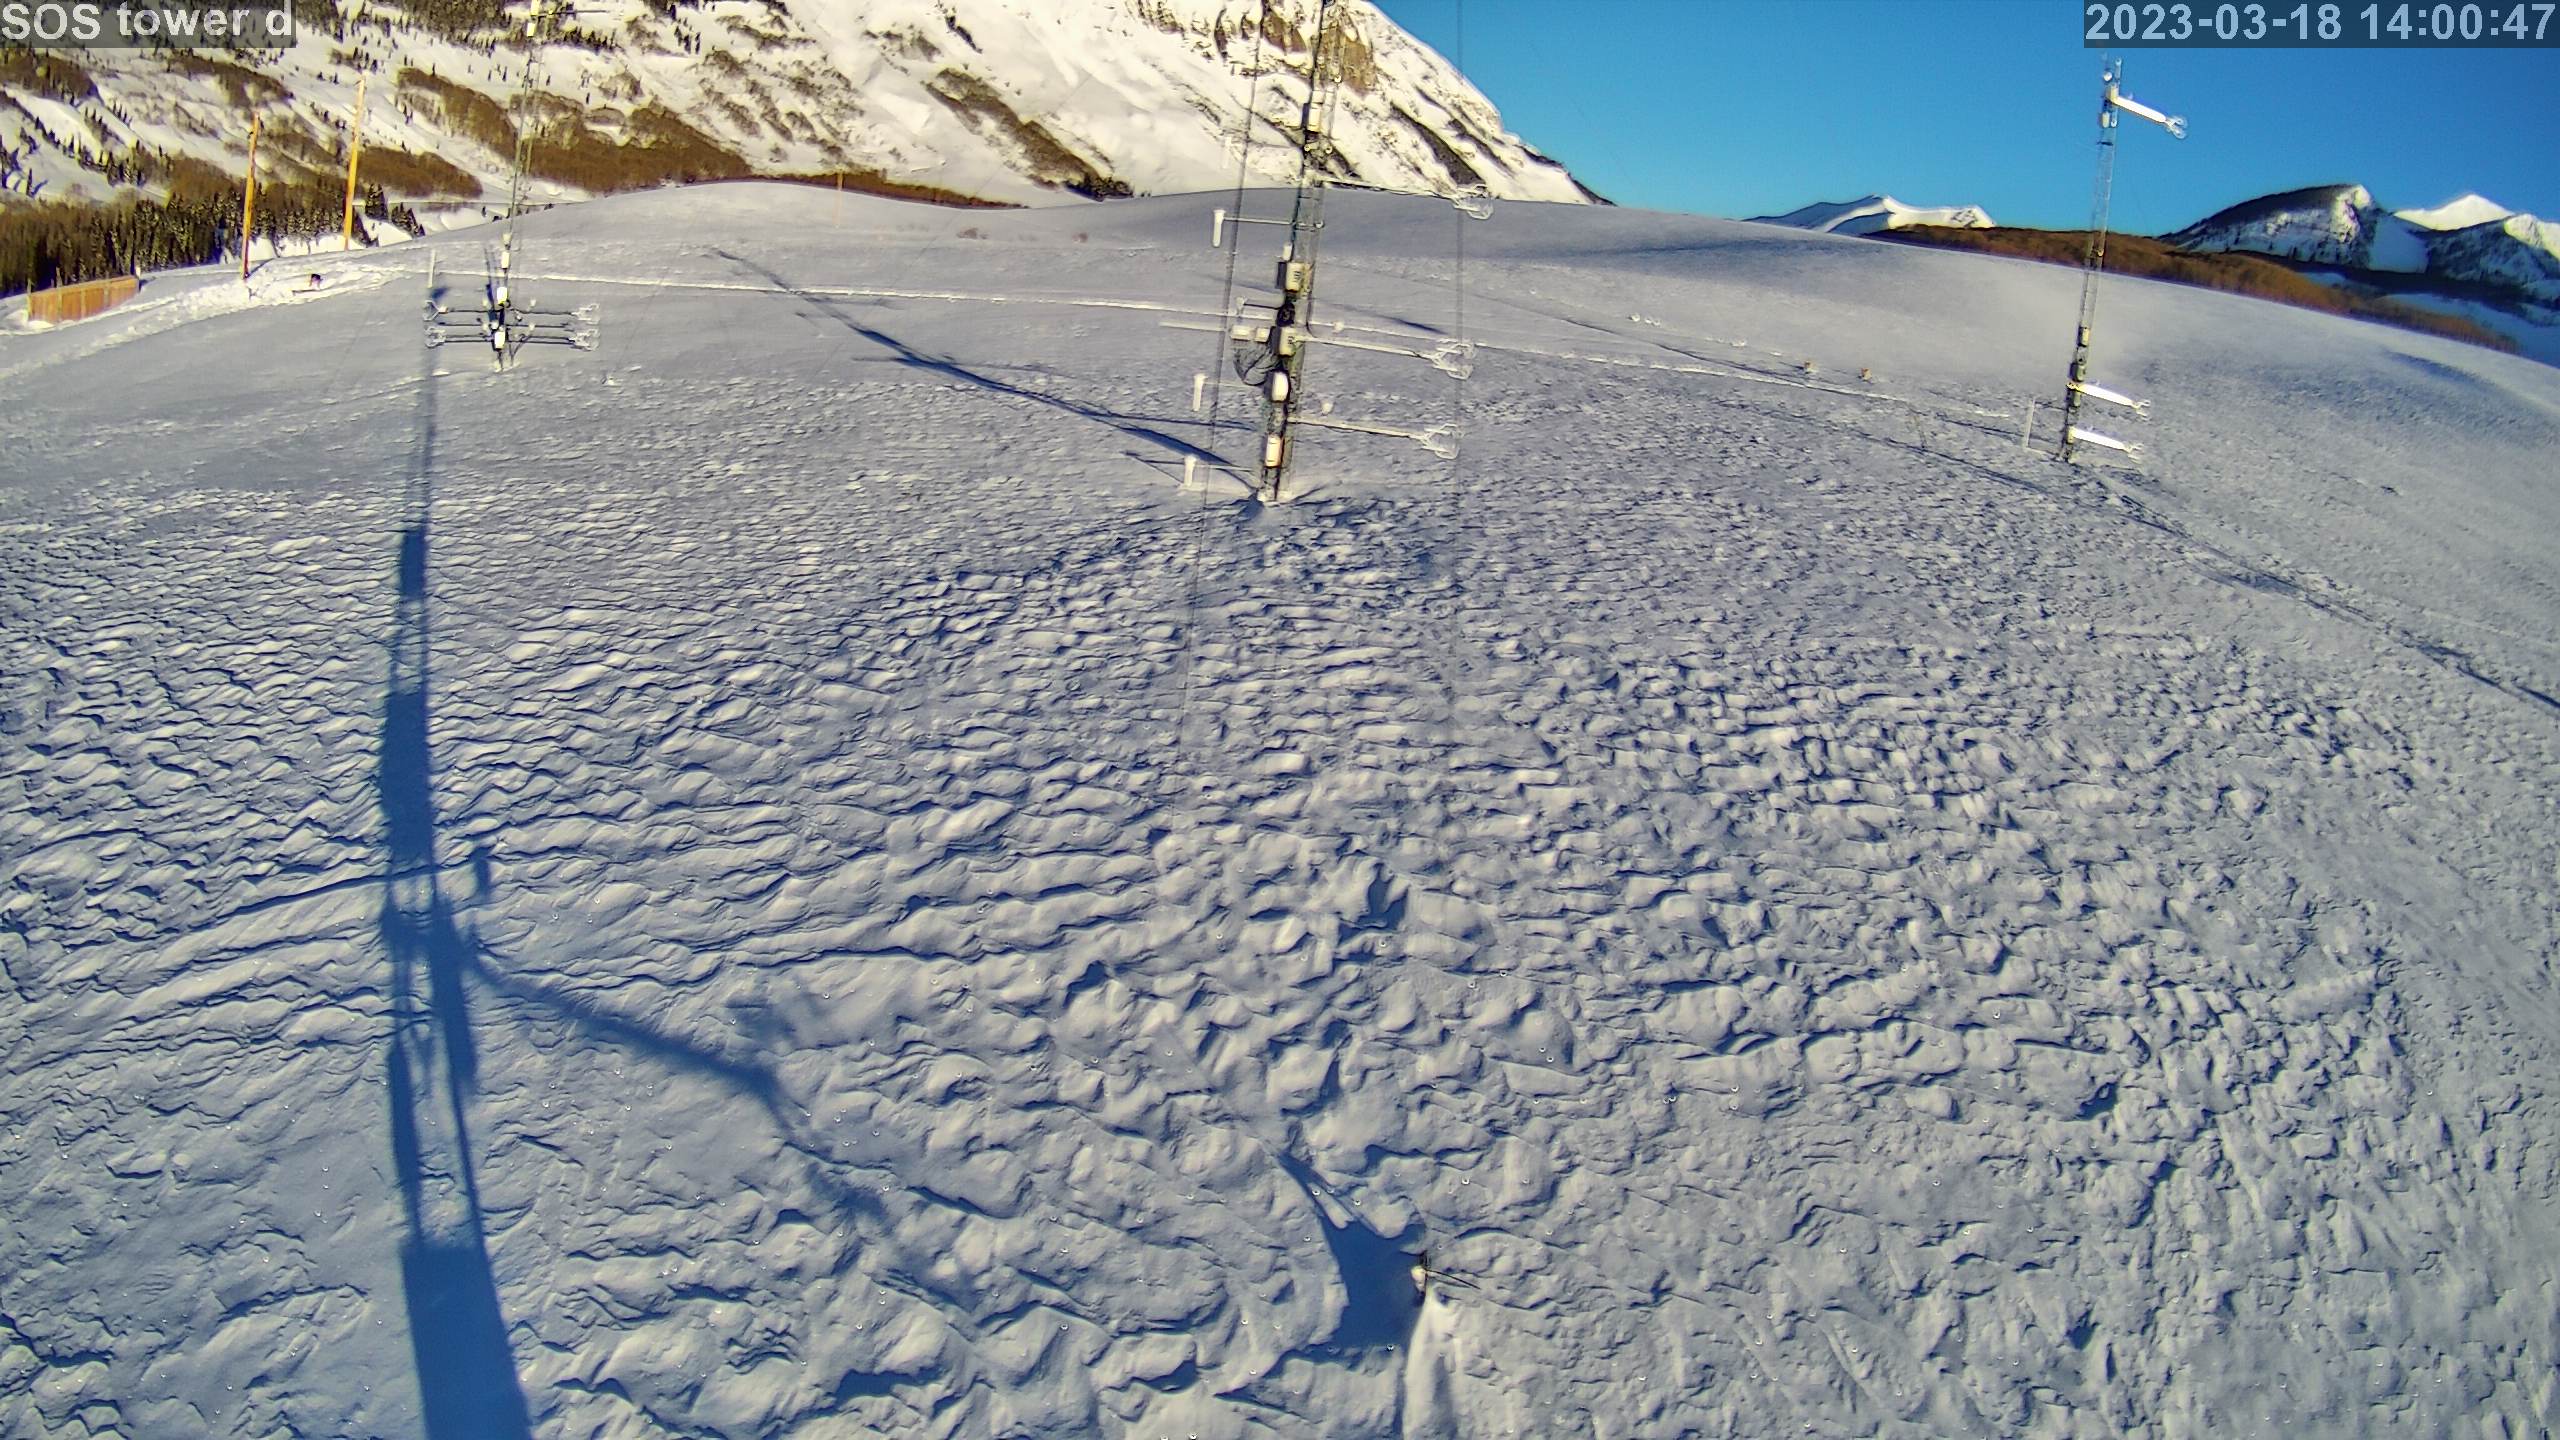
|
photo 2023031815
|
photo 2023031816
|
photo 2023031817
|
photo 2023031818
|
photo 2023031819
|
photo 2023031820
|
photo 2023031821
|
photo 2023031822
|
photo 2023031823
|