| Previous day | Select day | Next day |
The most recent plots are generally updated every 15 minutes. Use the browser reload button to make sure you are seeing the latest version of a plot.
In order to distinquish the traces on the vertical profile plots, a slight offset in X is added to some traces. This is indicated by a "(n)" in the legend for the trace.
If you right-click on an image, most browsers will provide a menu to download or display the plot in another window.
photo 20230317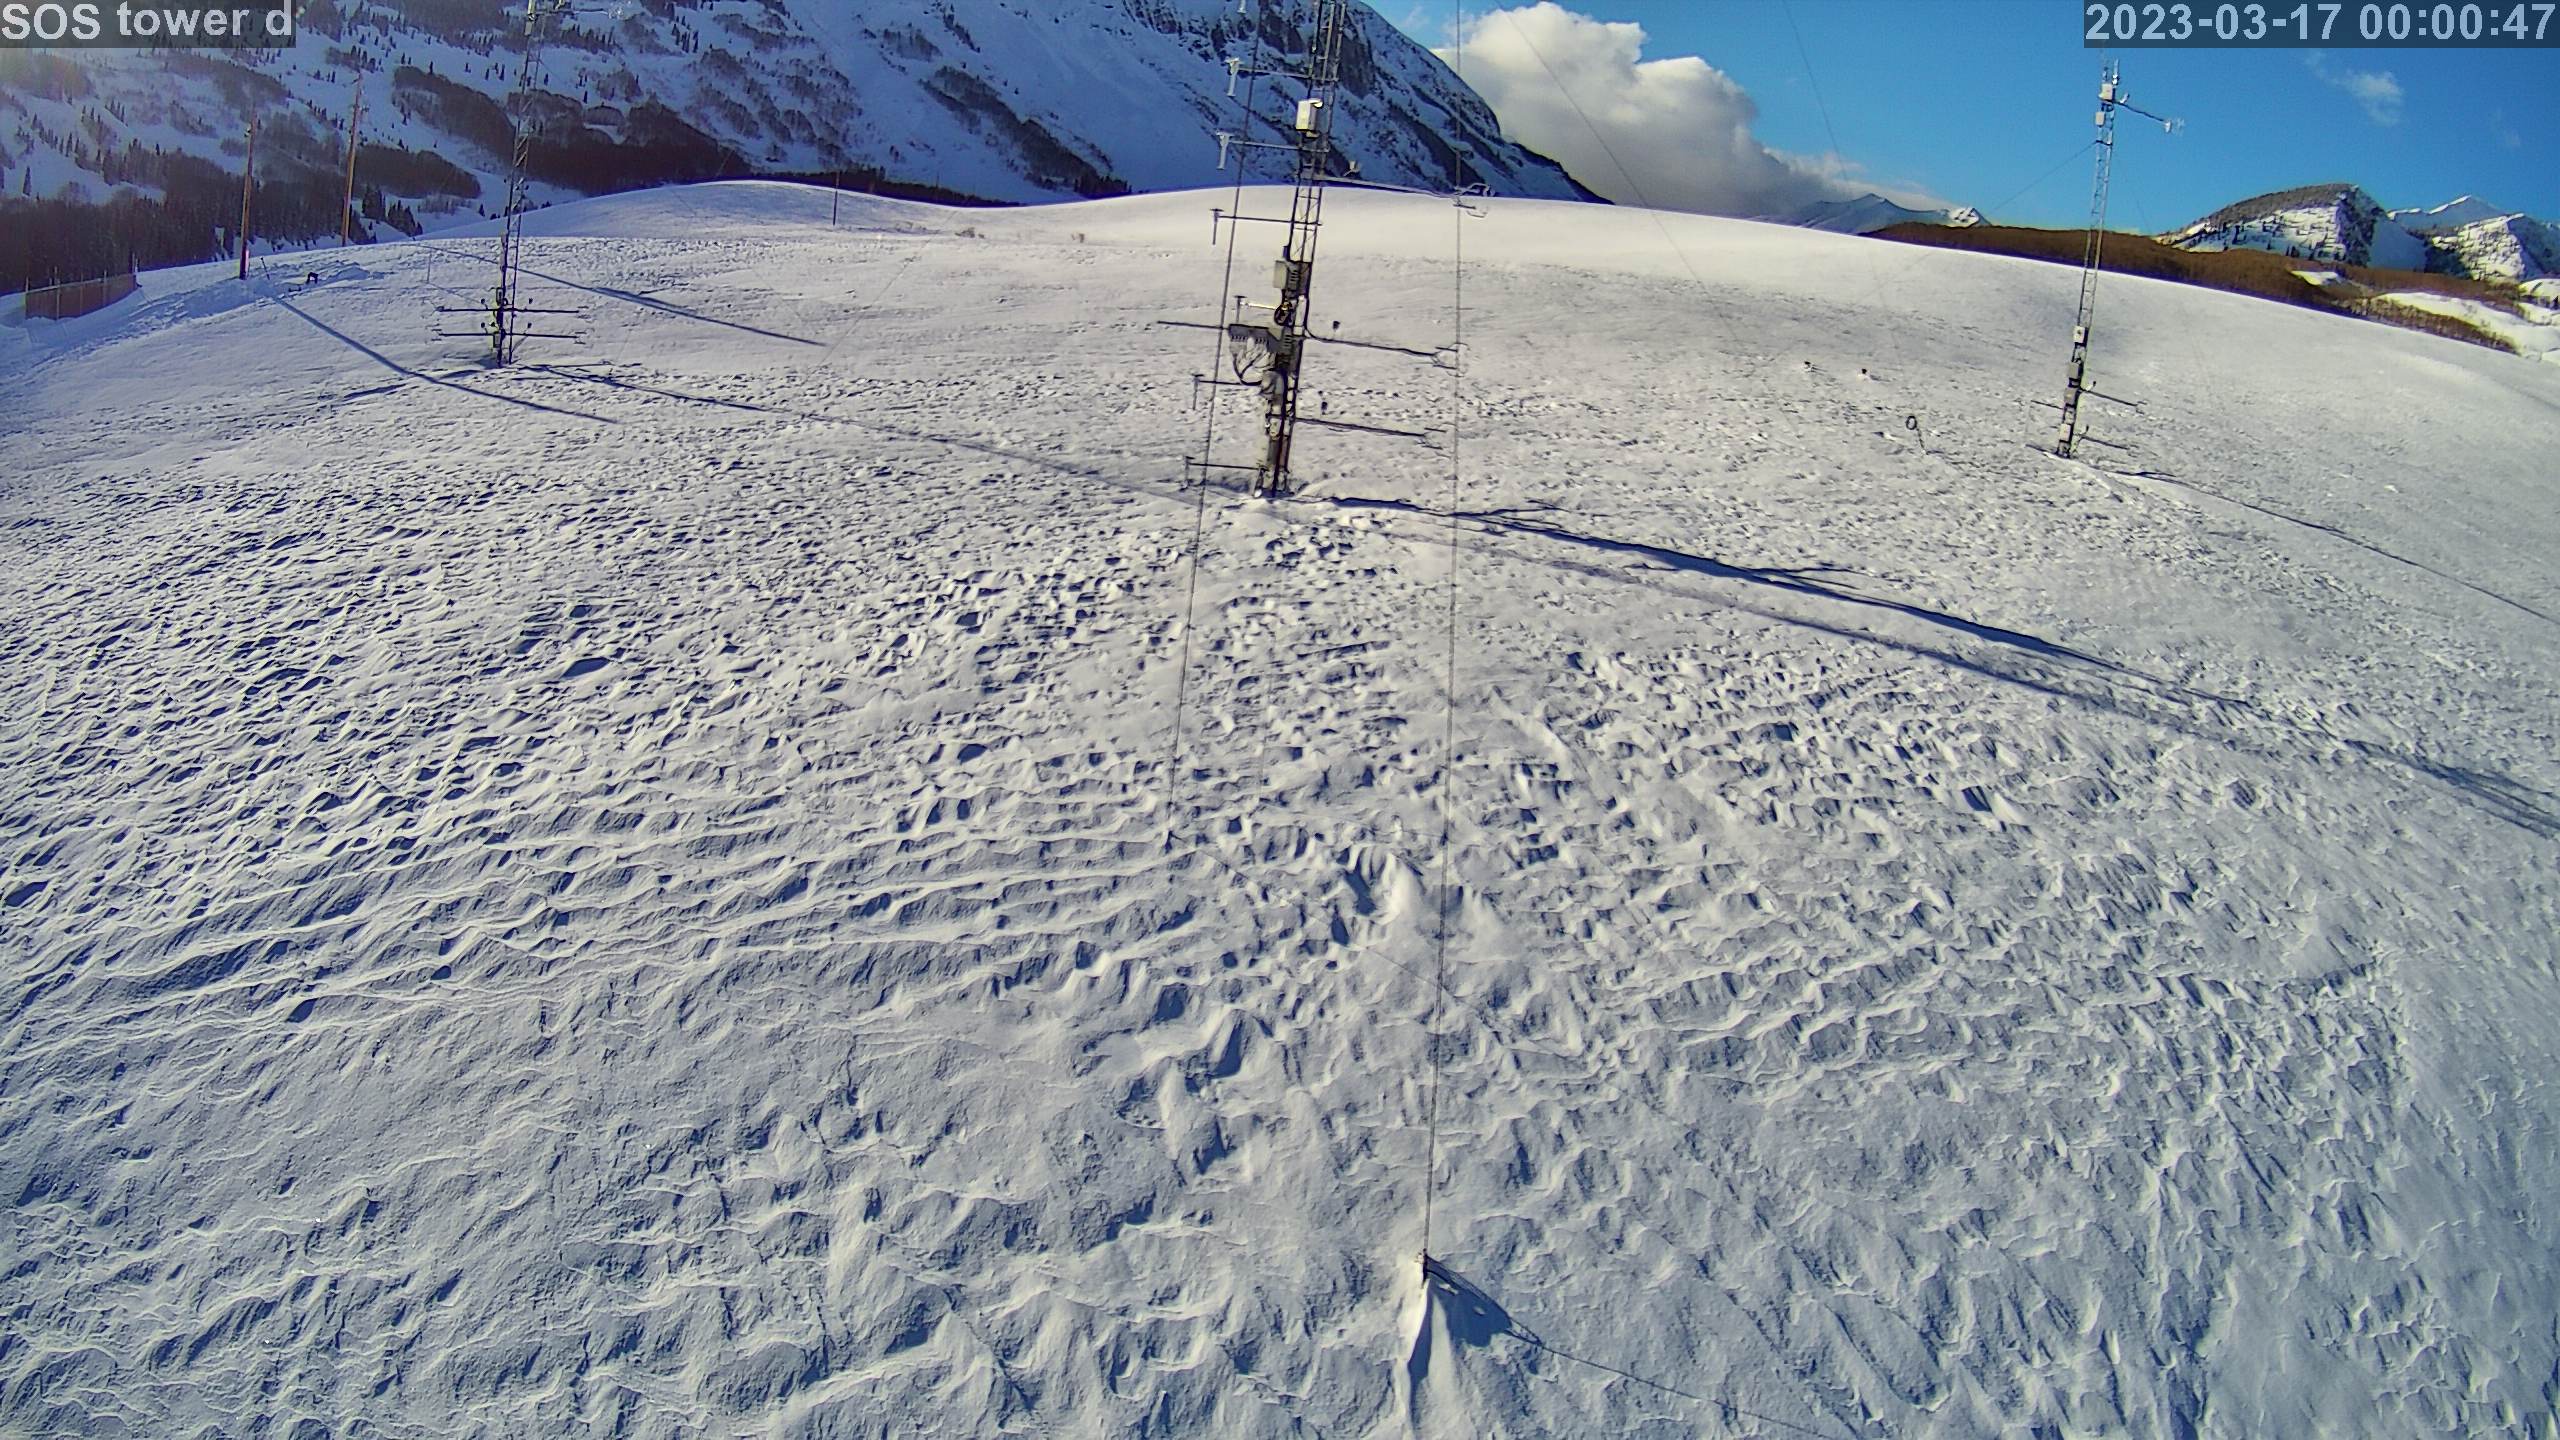
|
photo 2023031701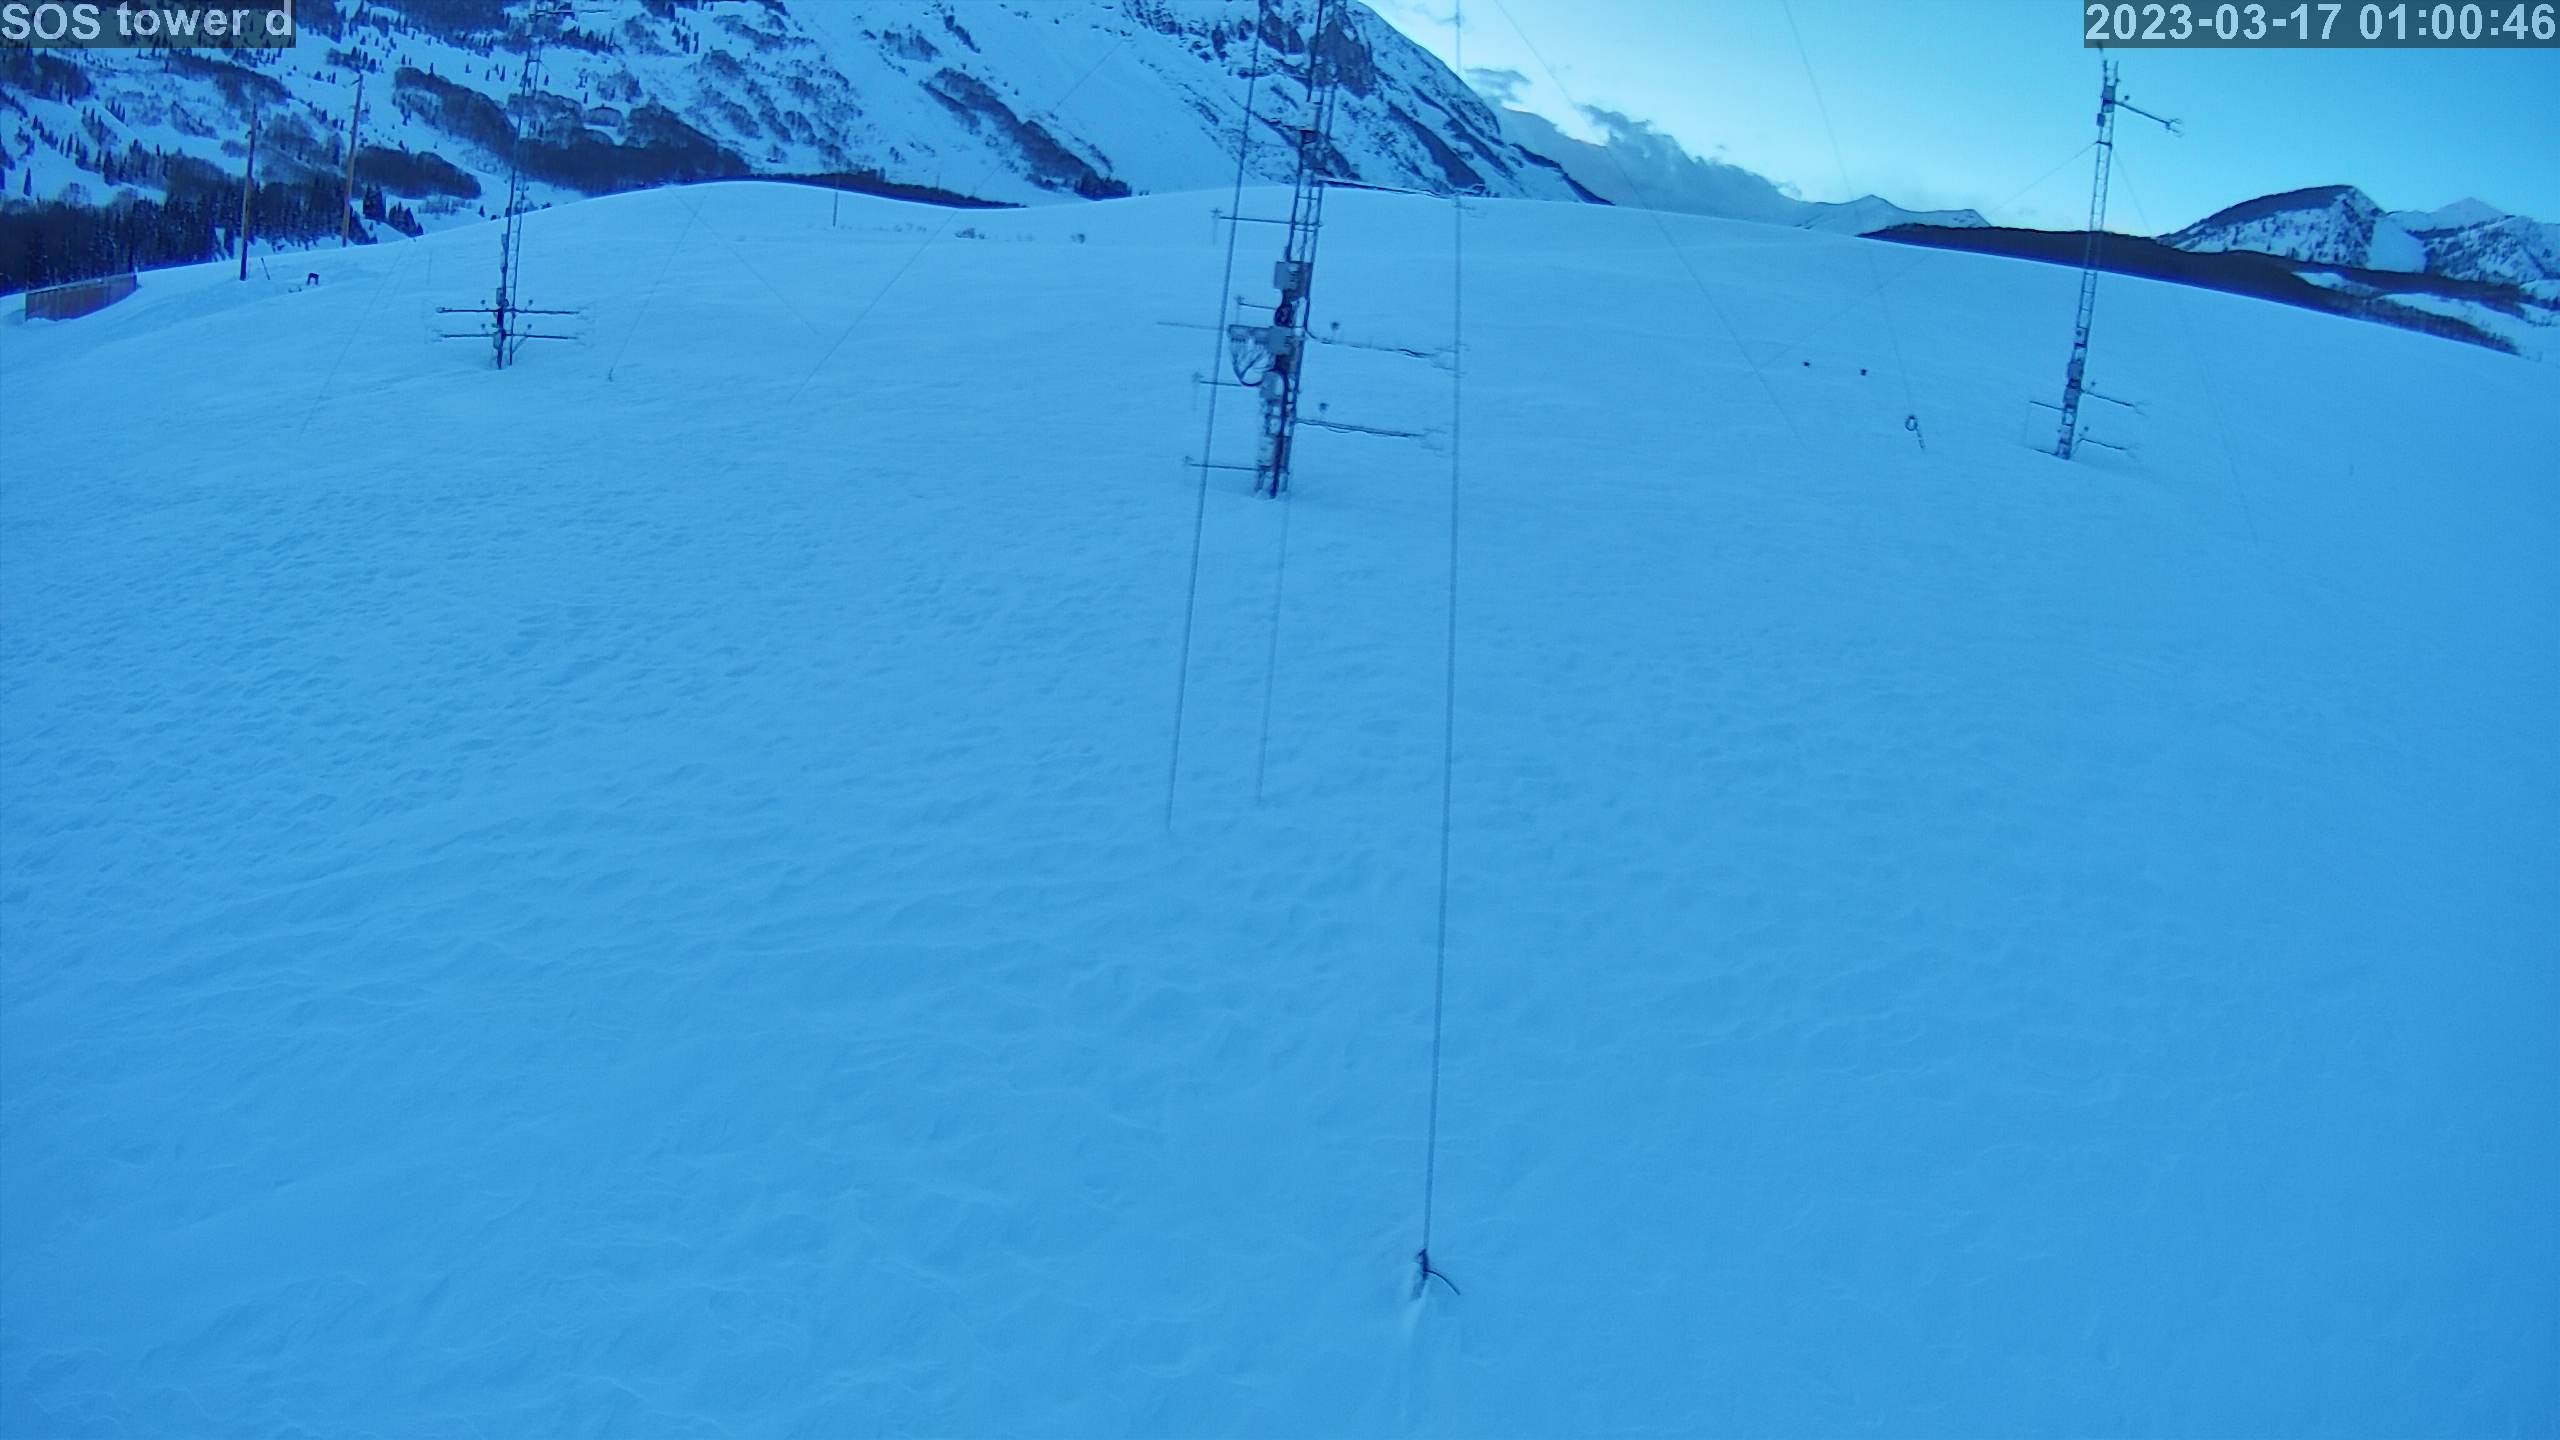
|
photo 2023031702
|
photo 2023031703
|
photo 2023031704
|
photo 2023031705
|
photo 2023031706
|
photo 2023031707
|
photo 2023031708
|
photo 2023031709
|
photo 2023031710
|
photo 2023031711
|
photo 2023031712
|
photo 2023031713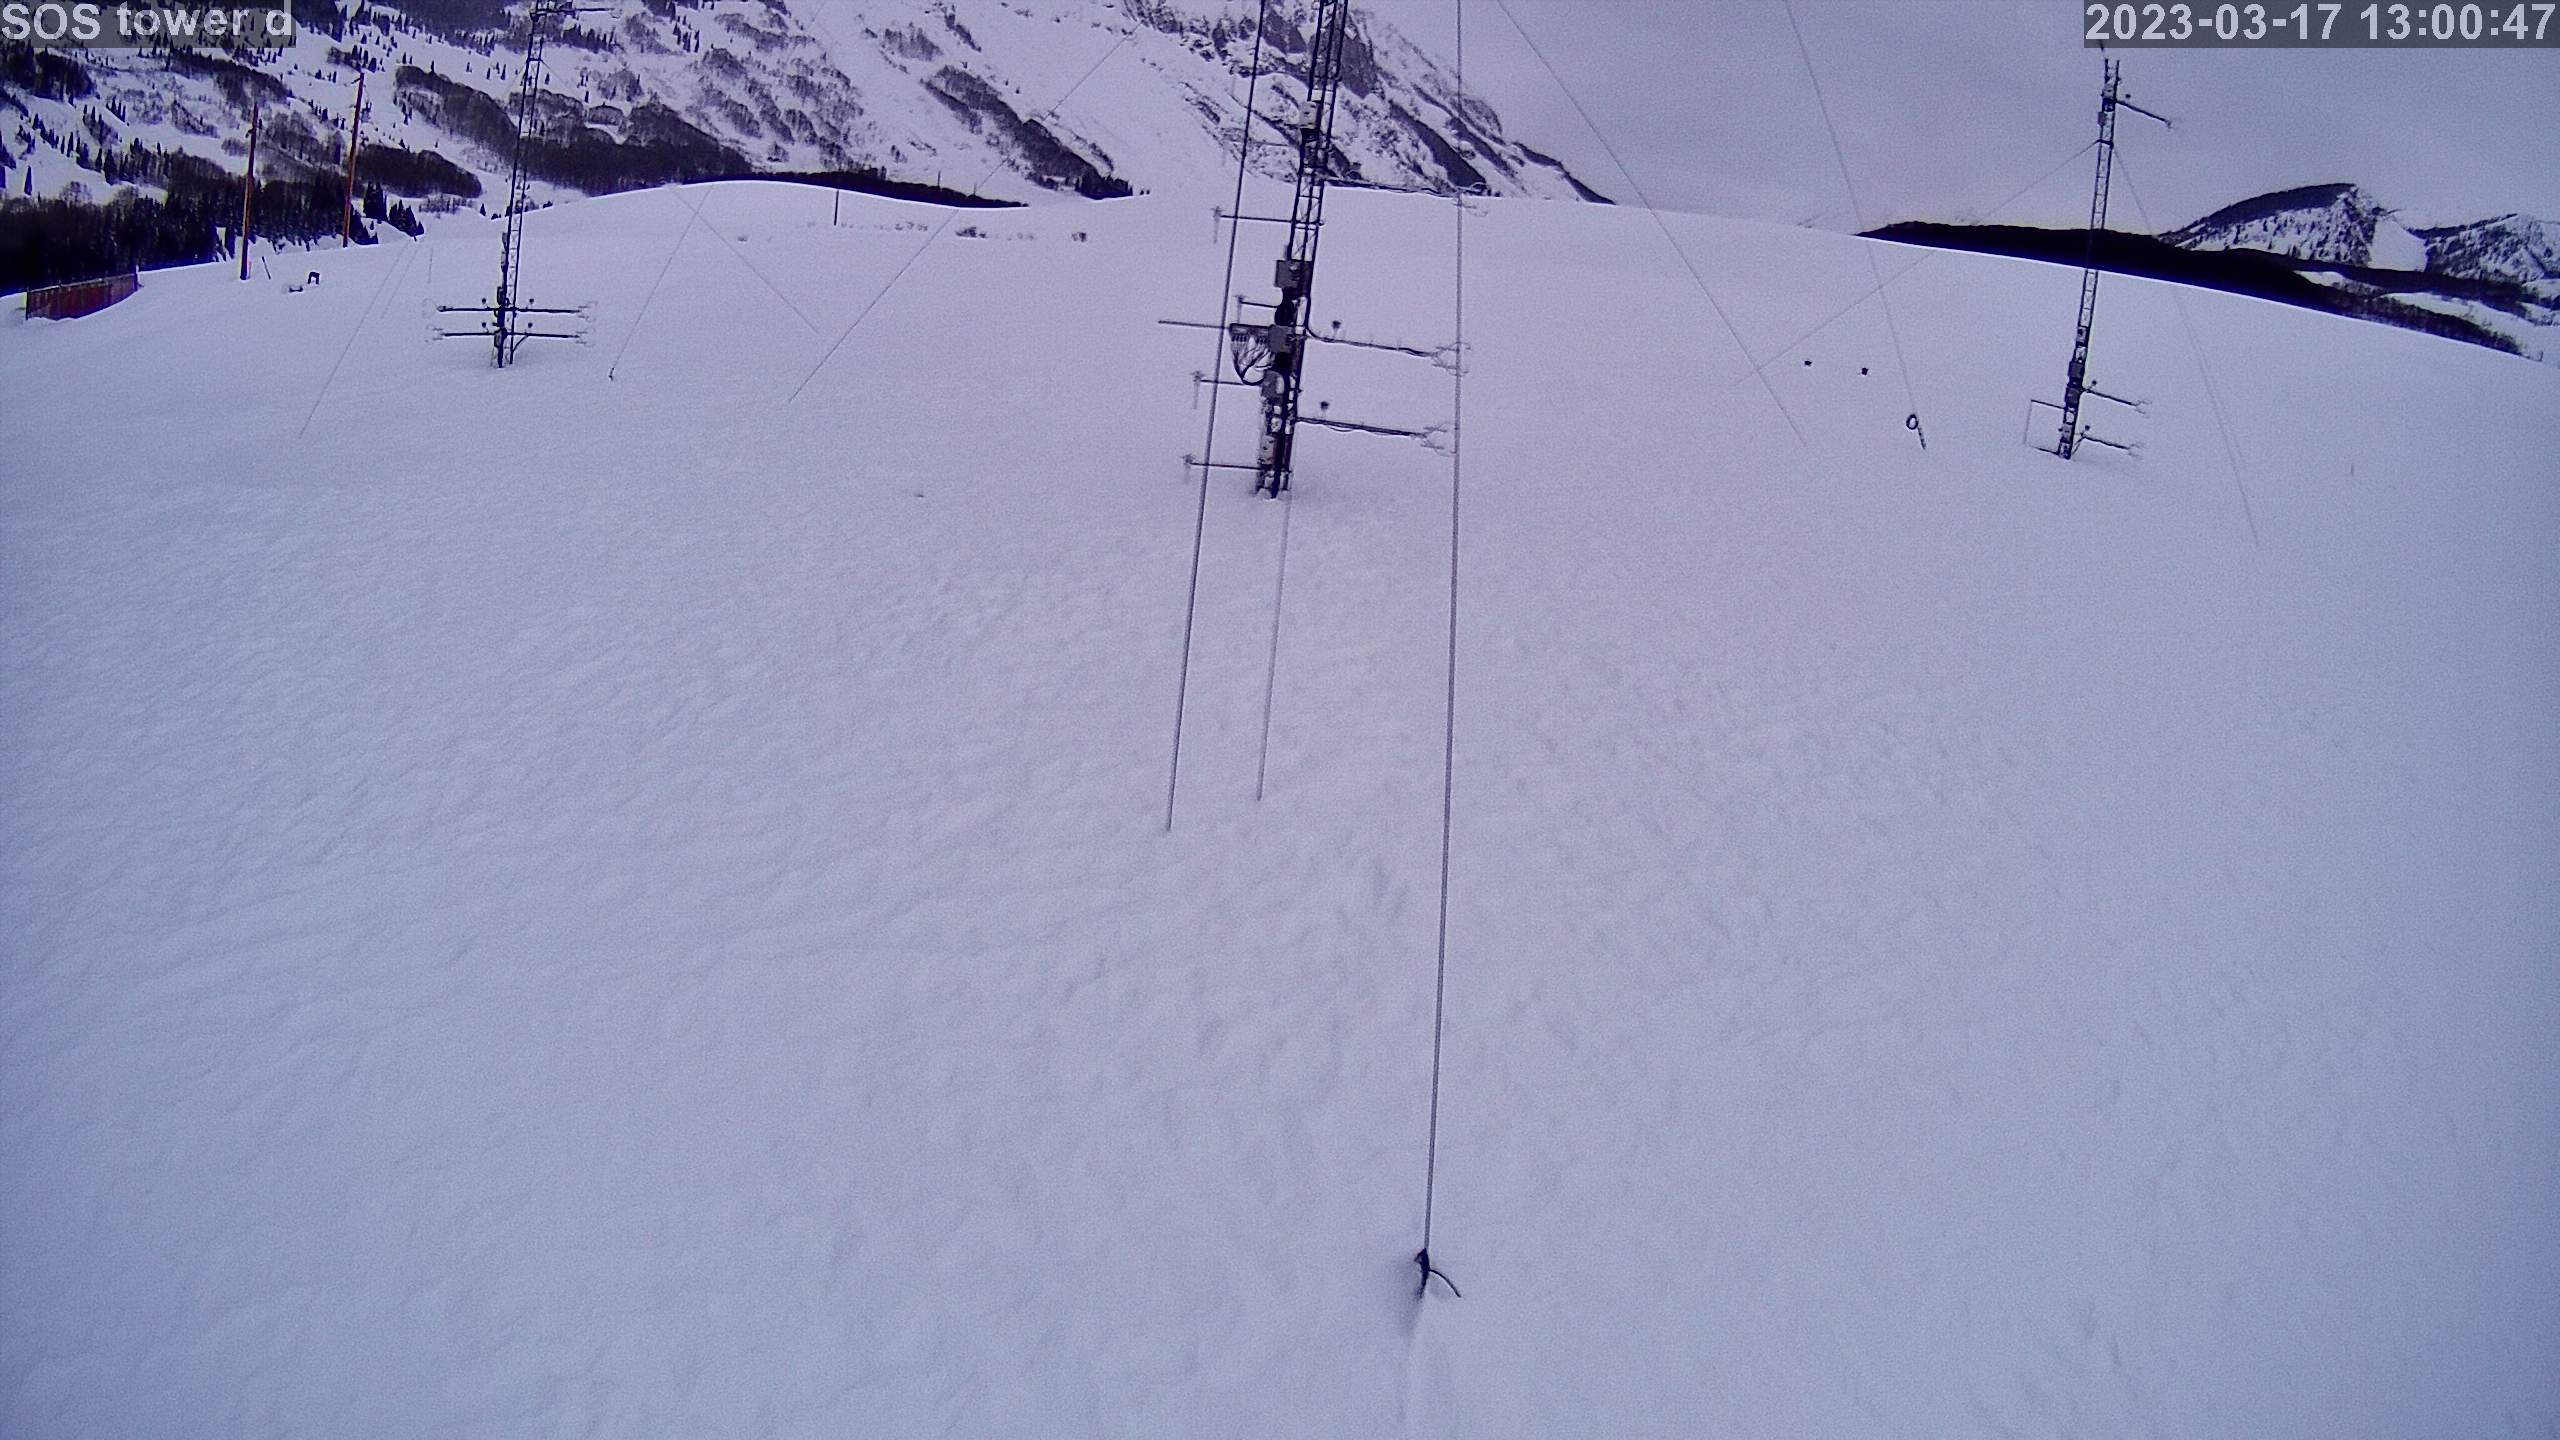
|
photo 2023031714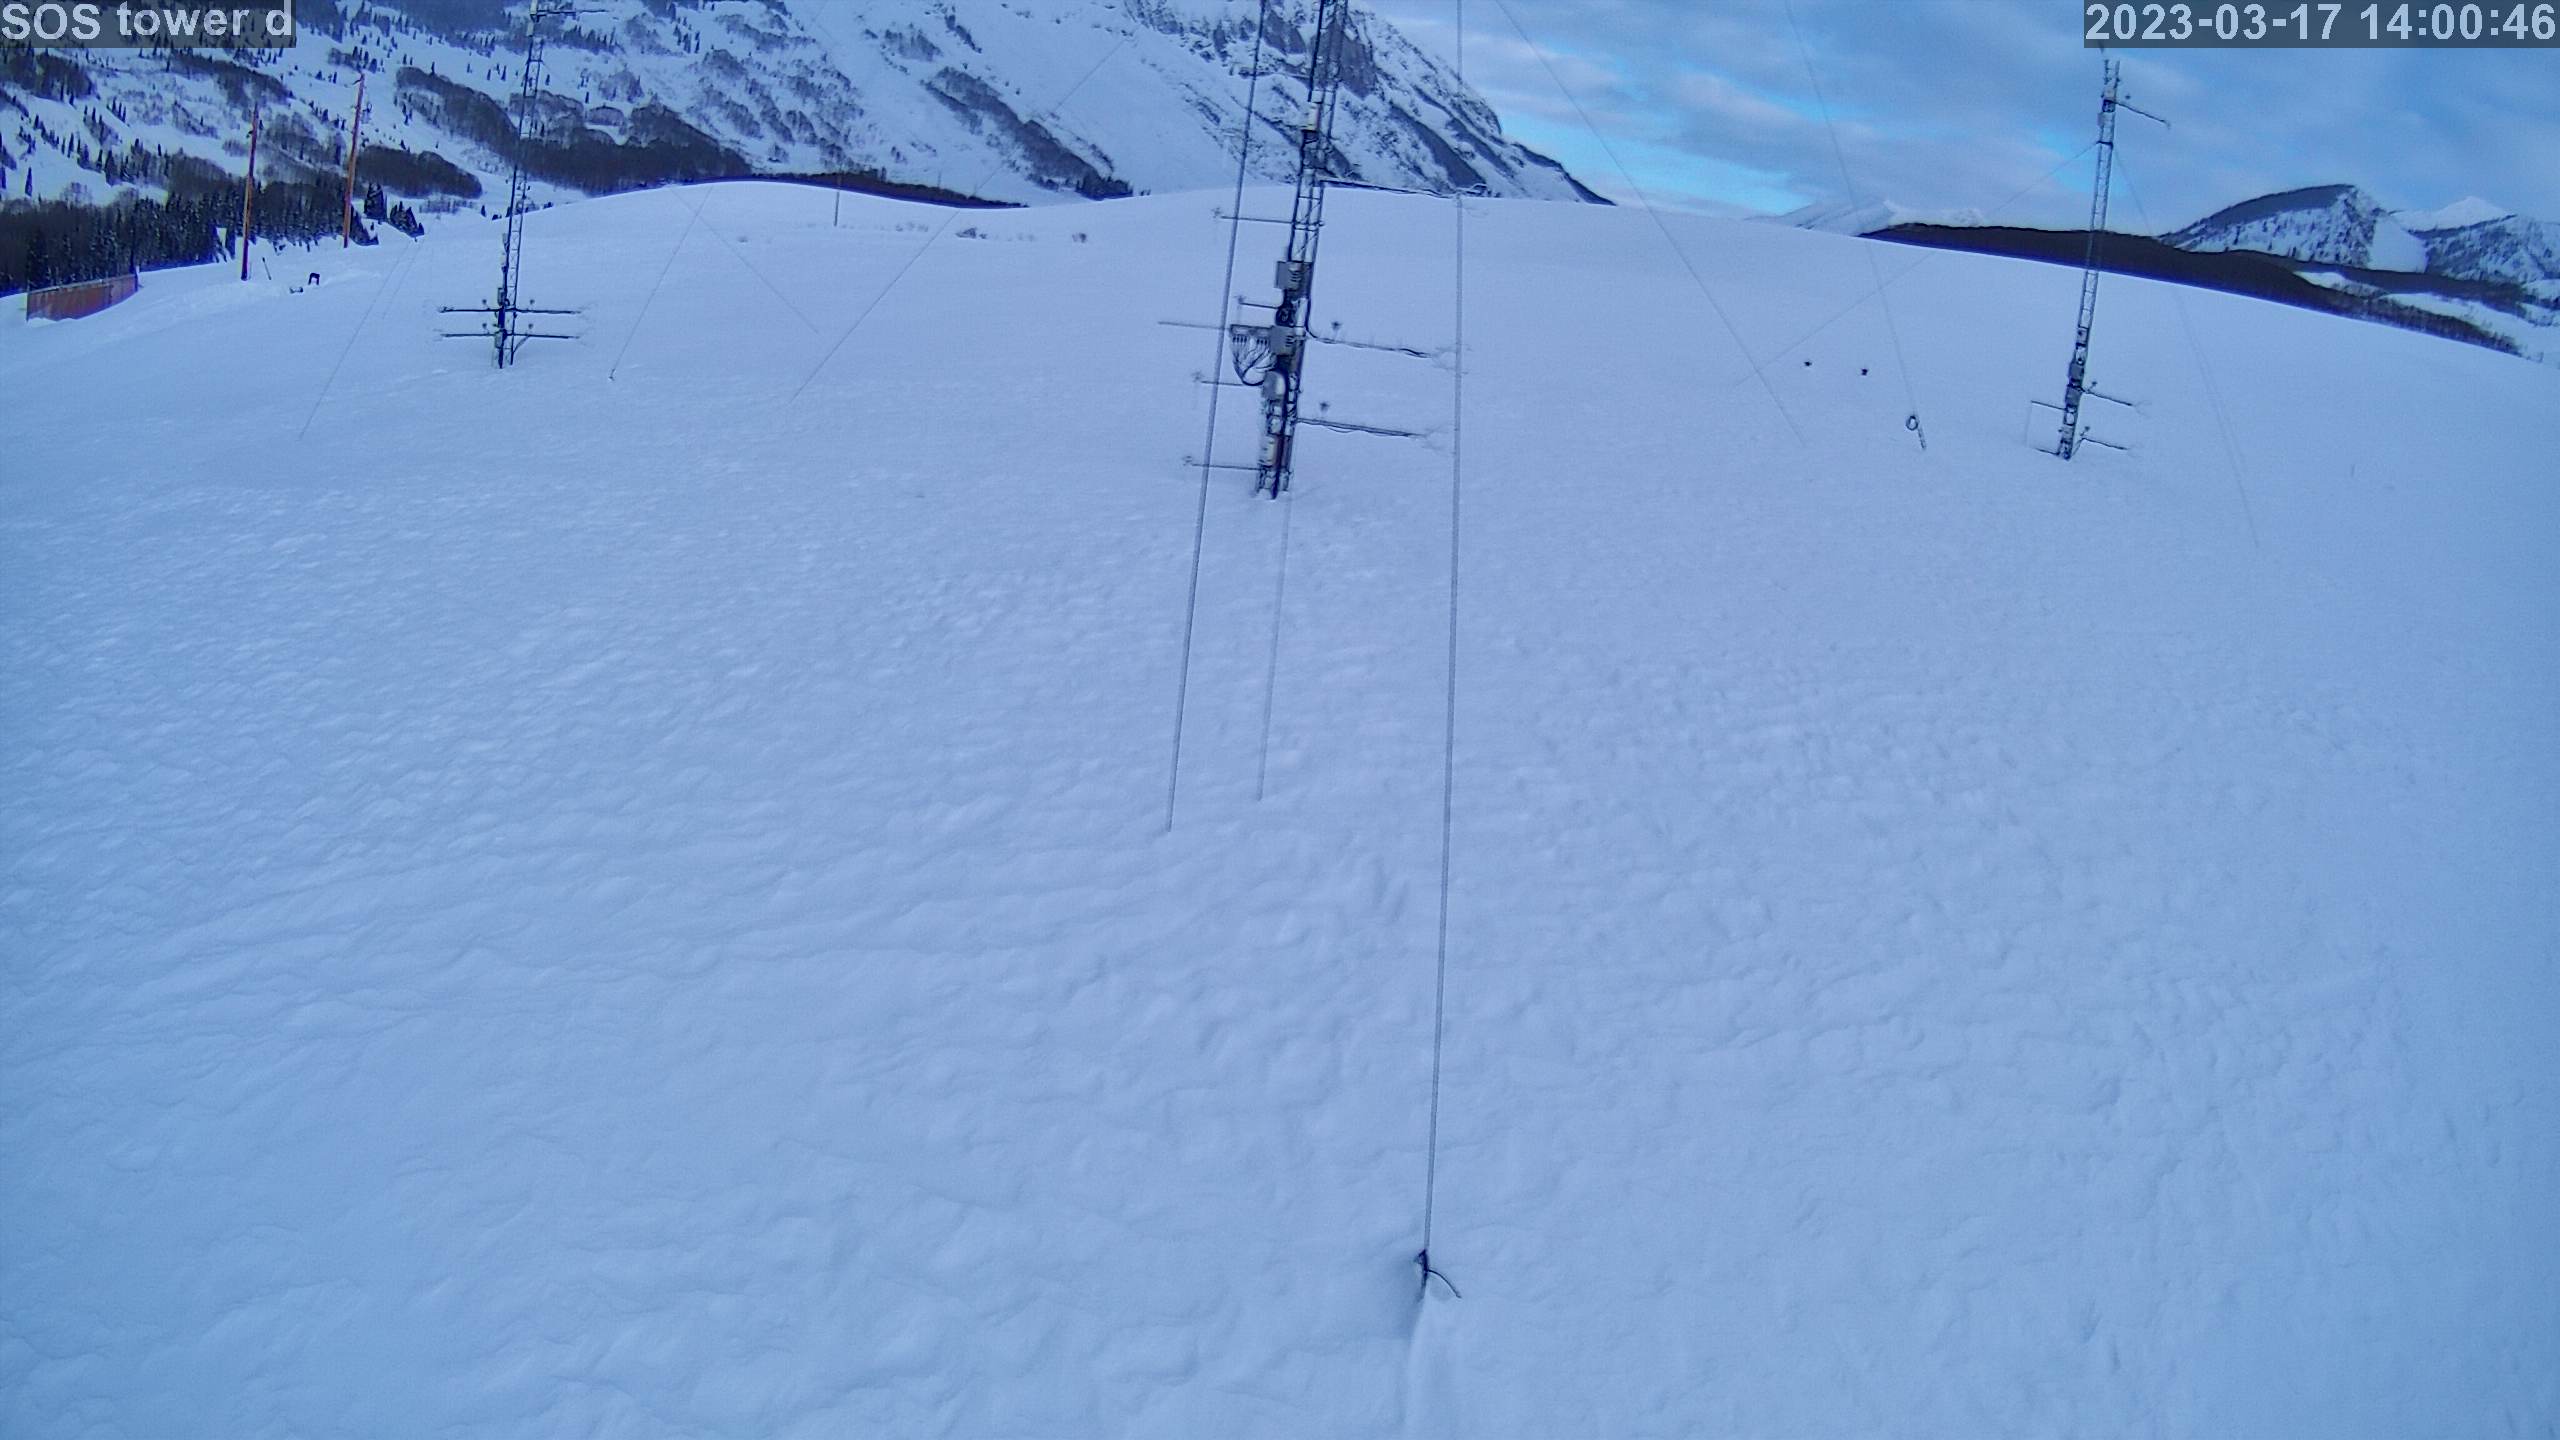
|
photo 2023031715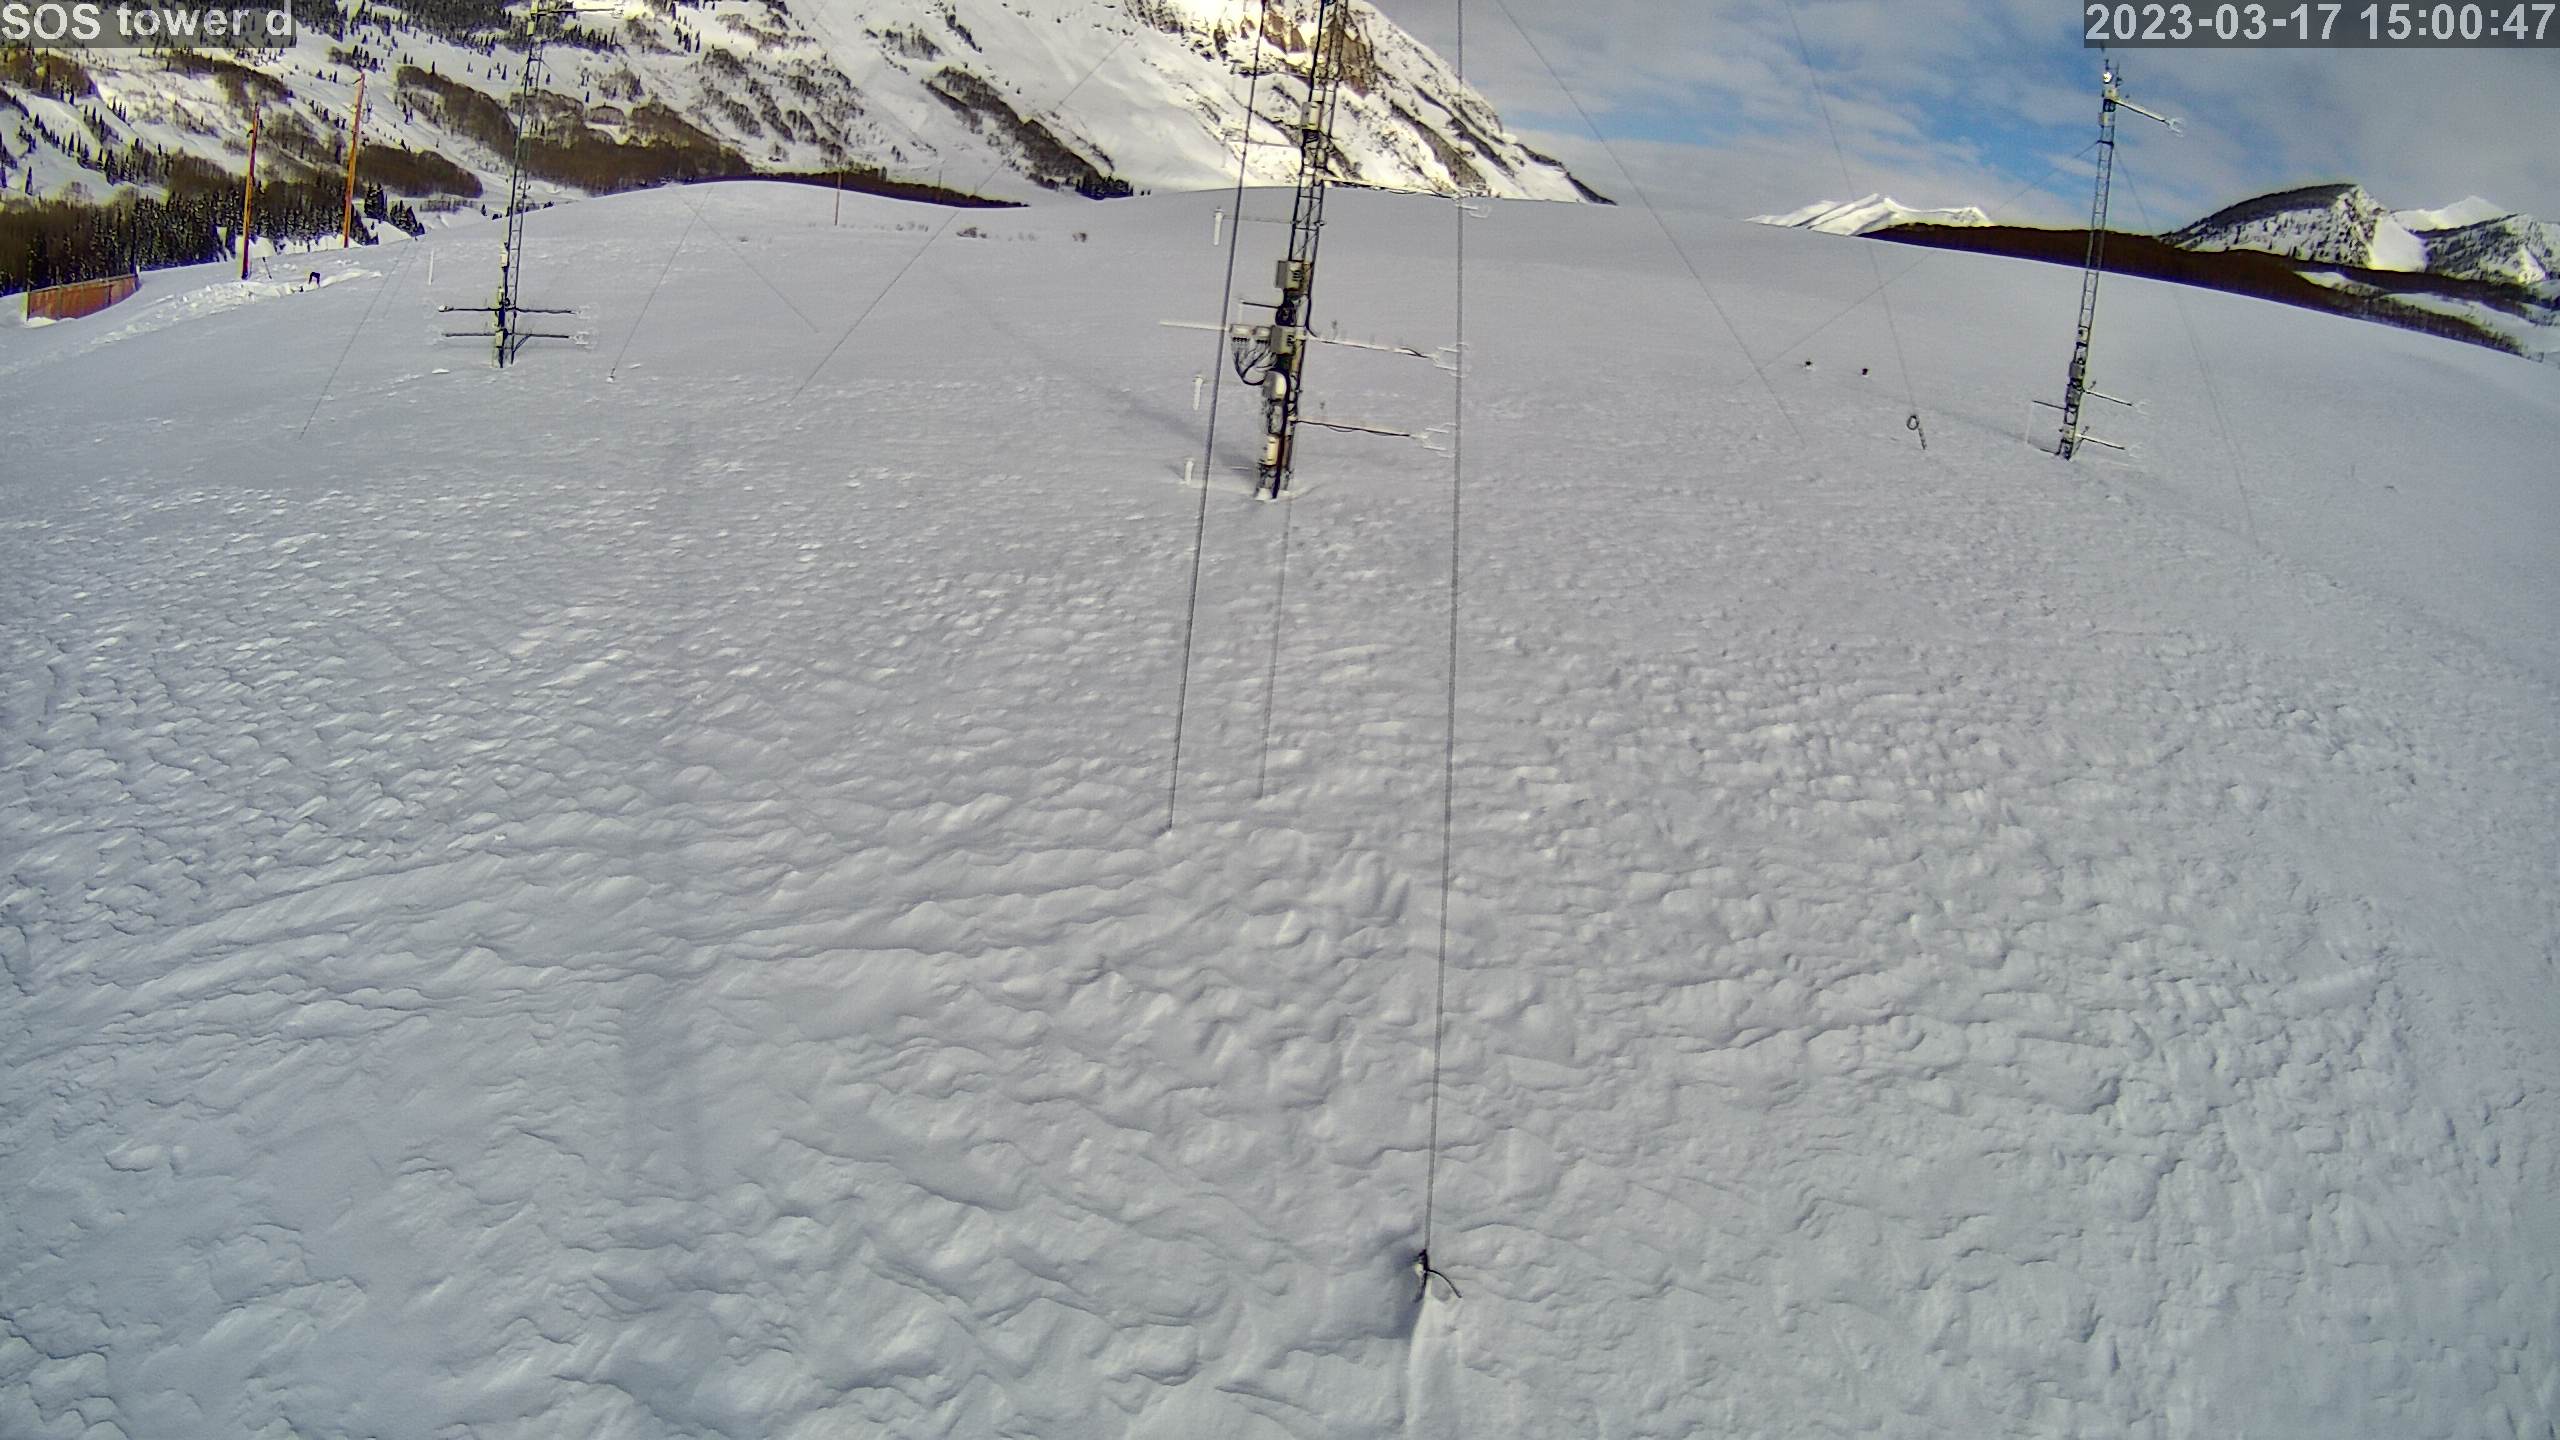
|
photo 2023031716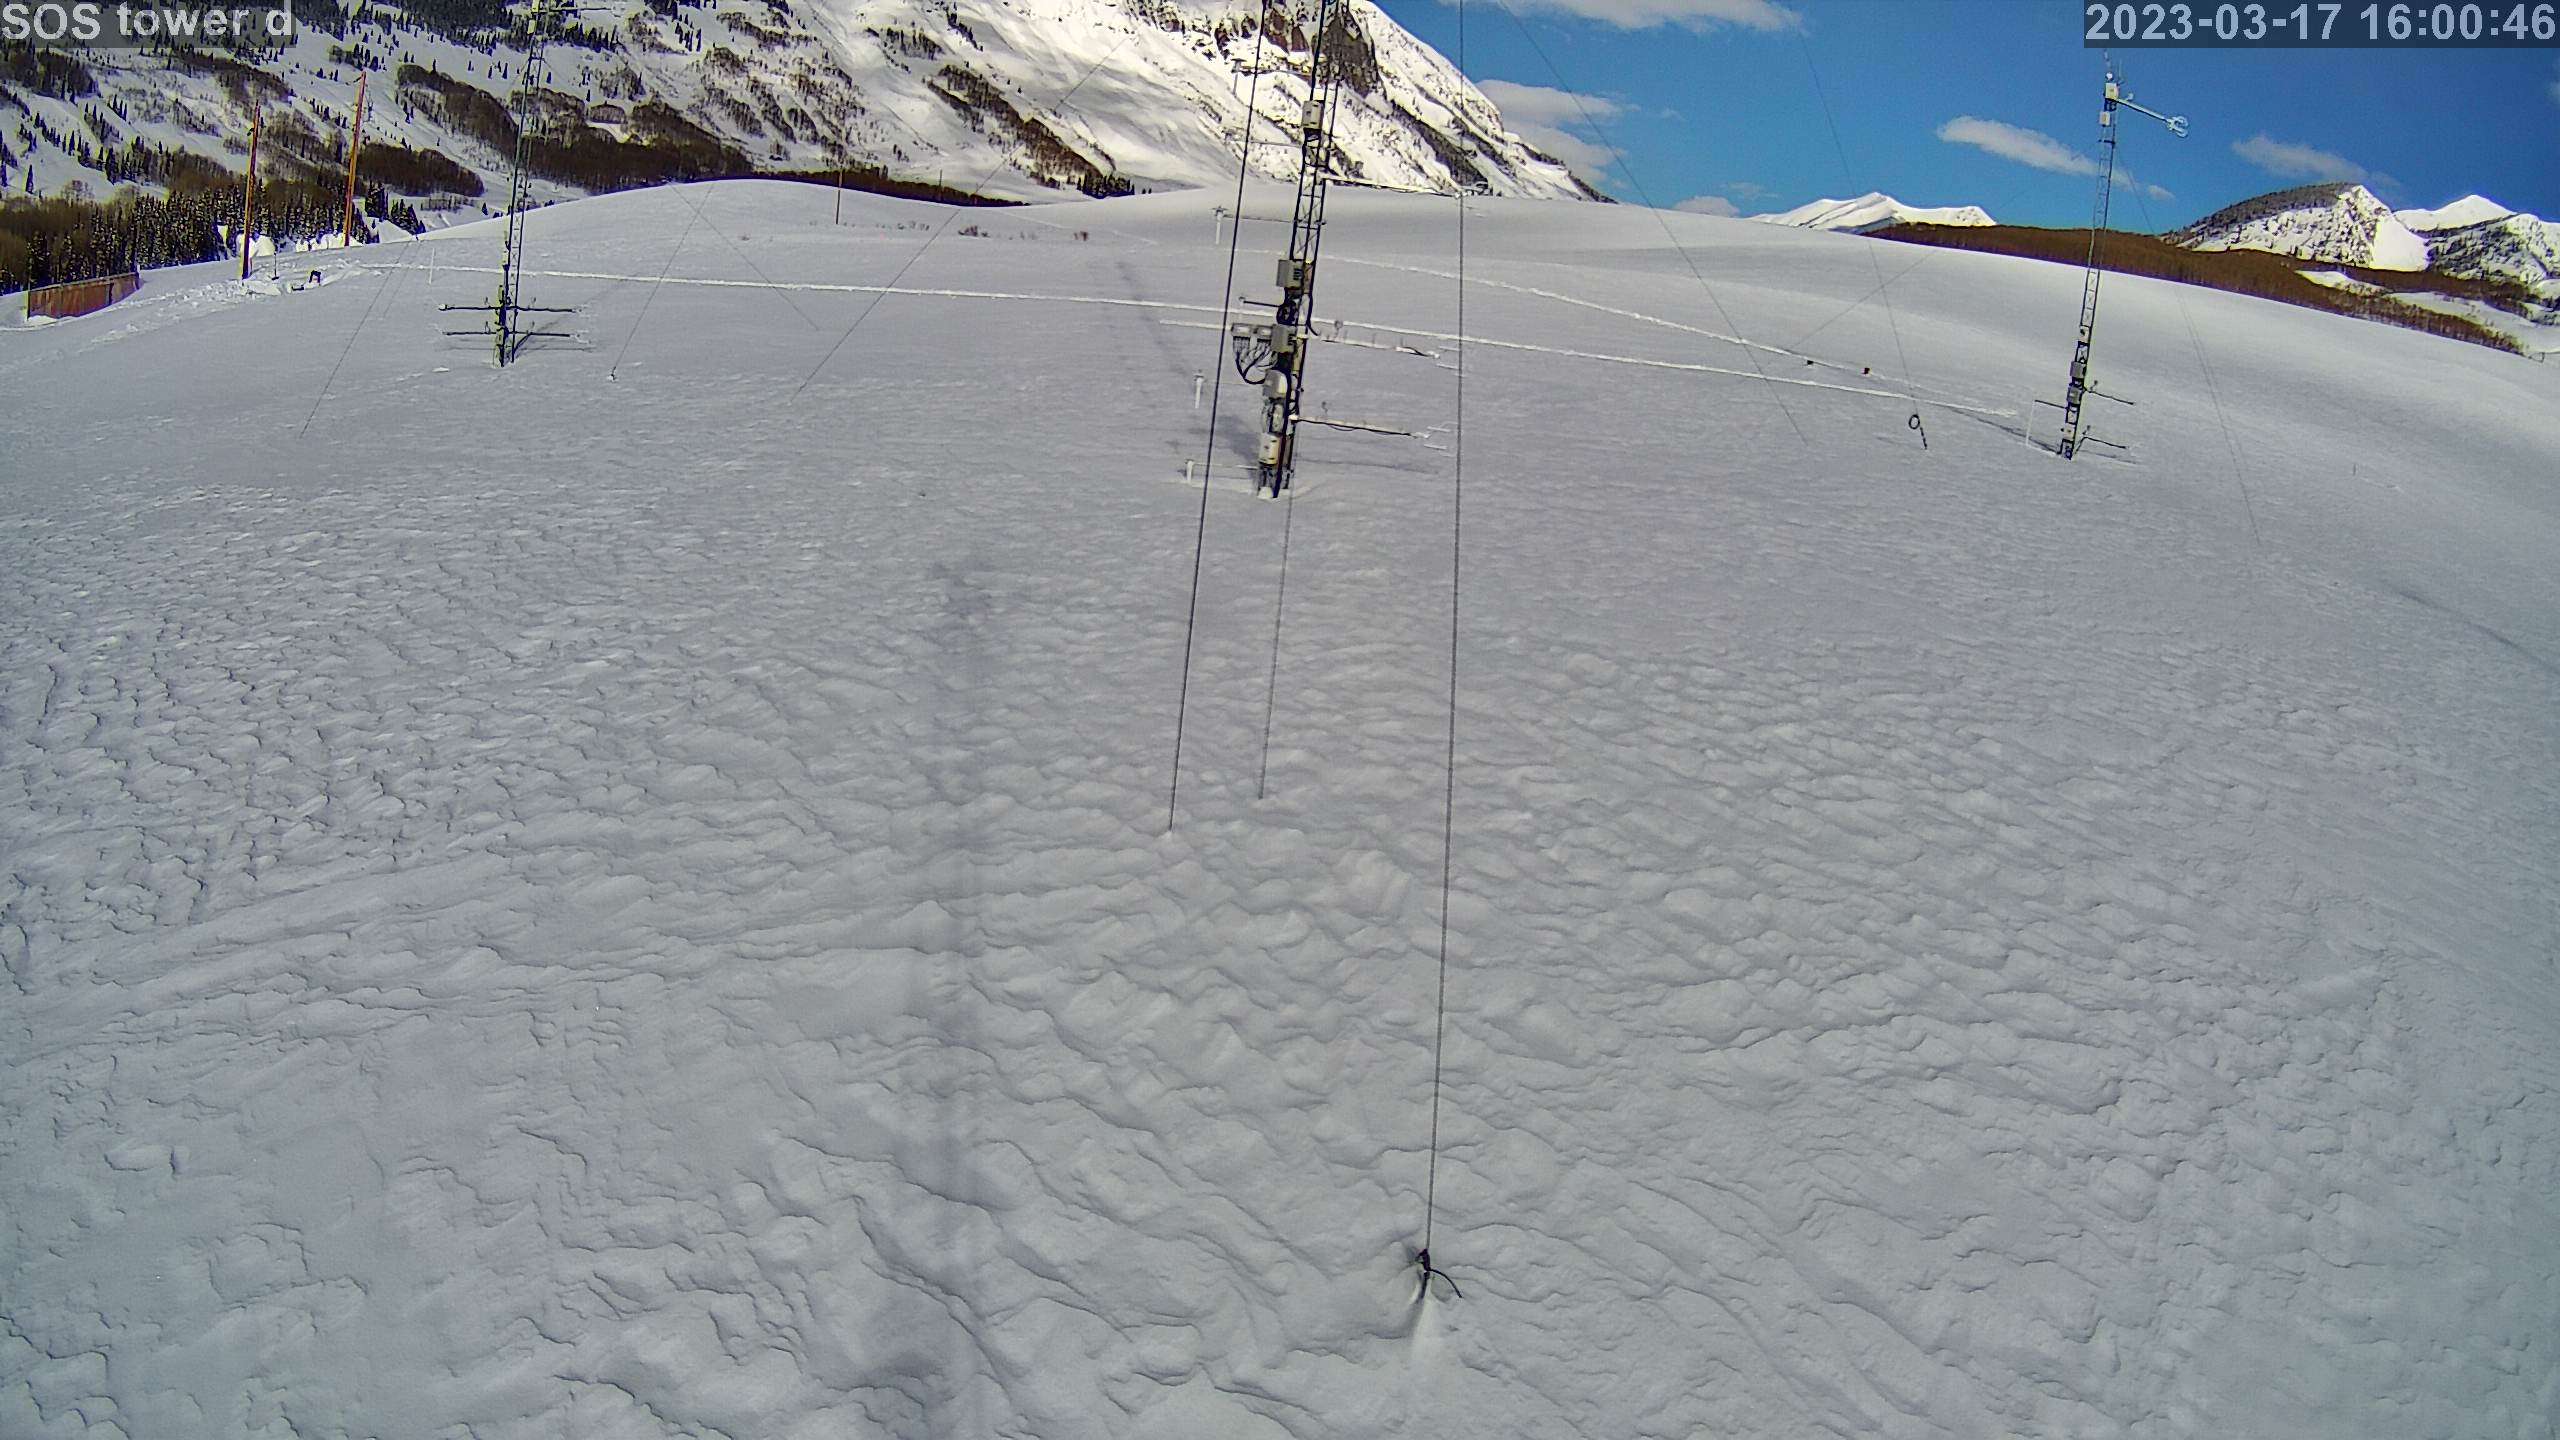
|
photo 2023031717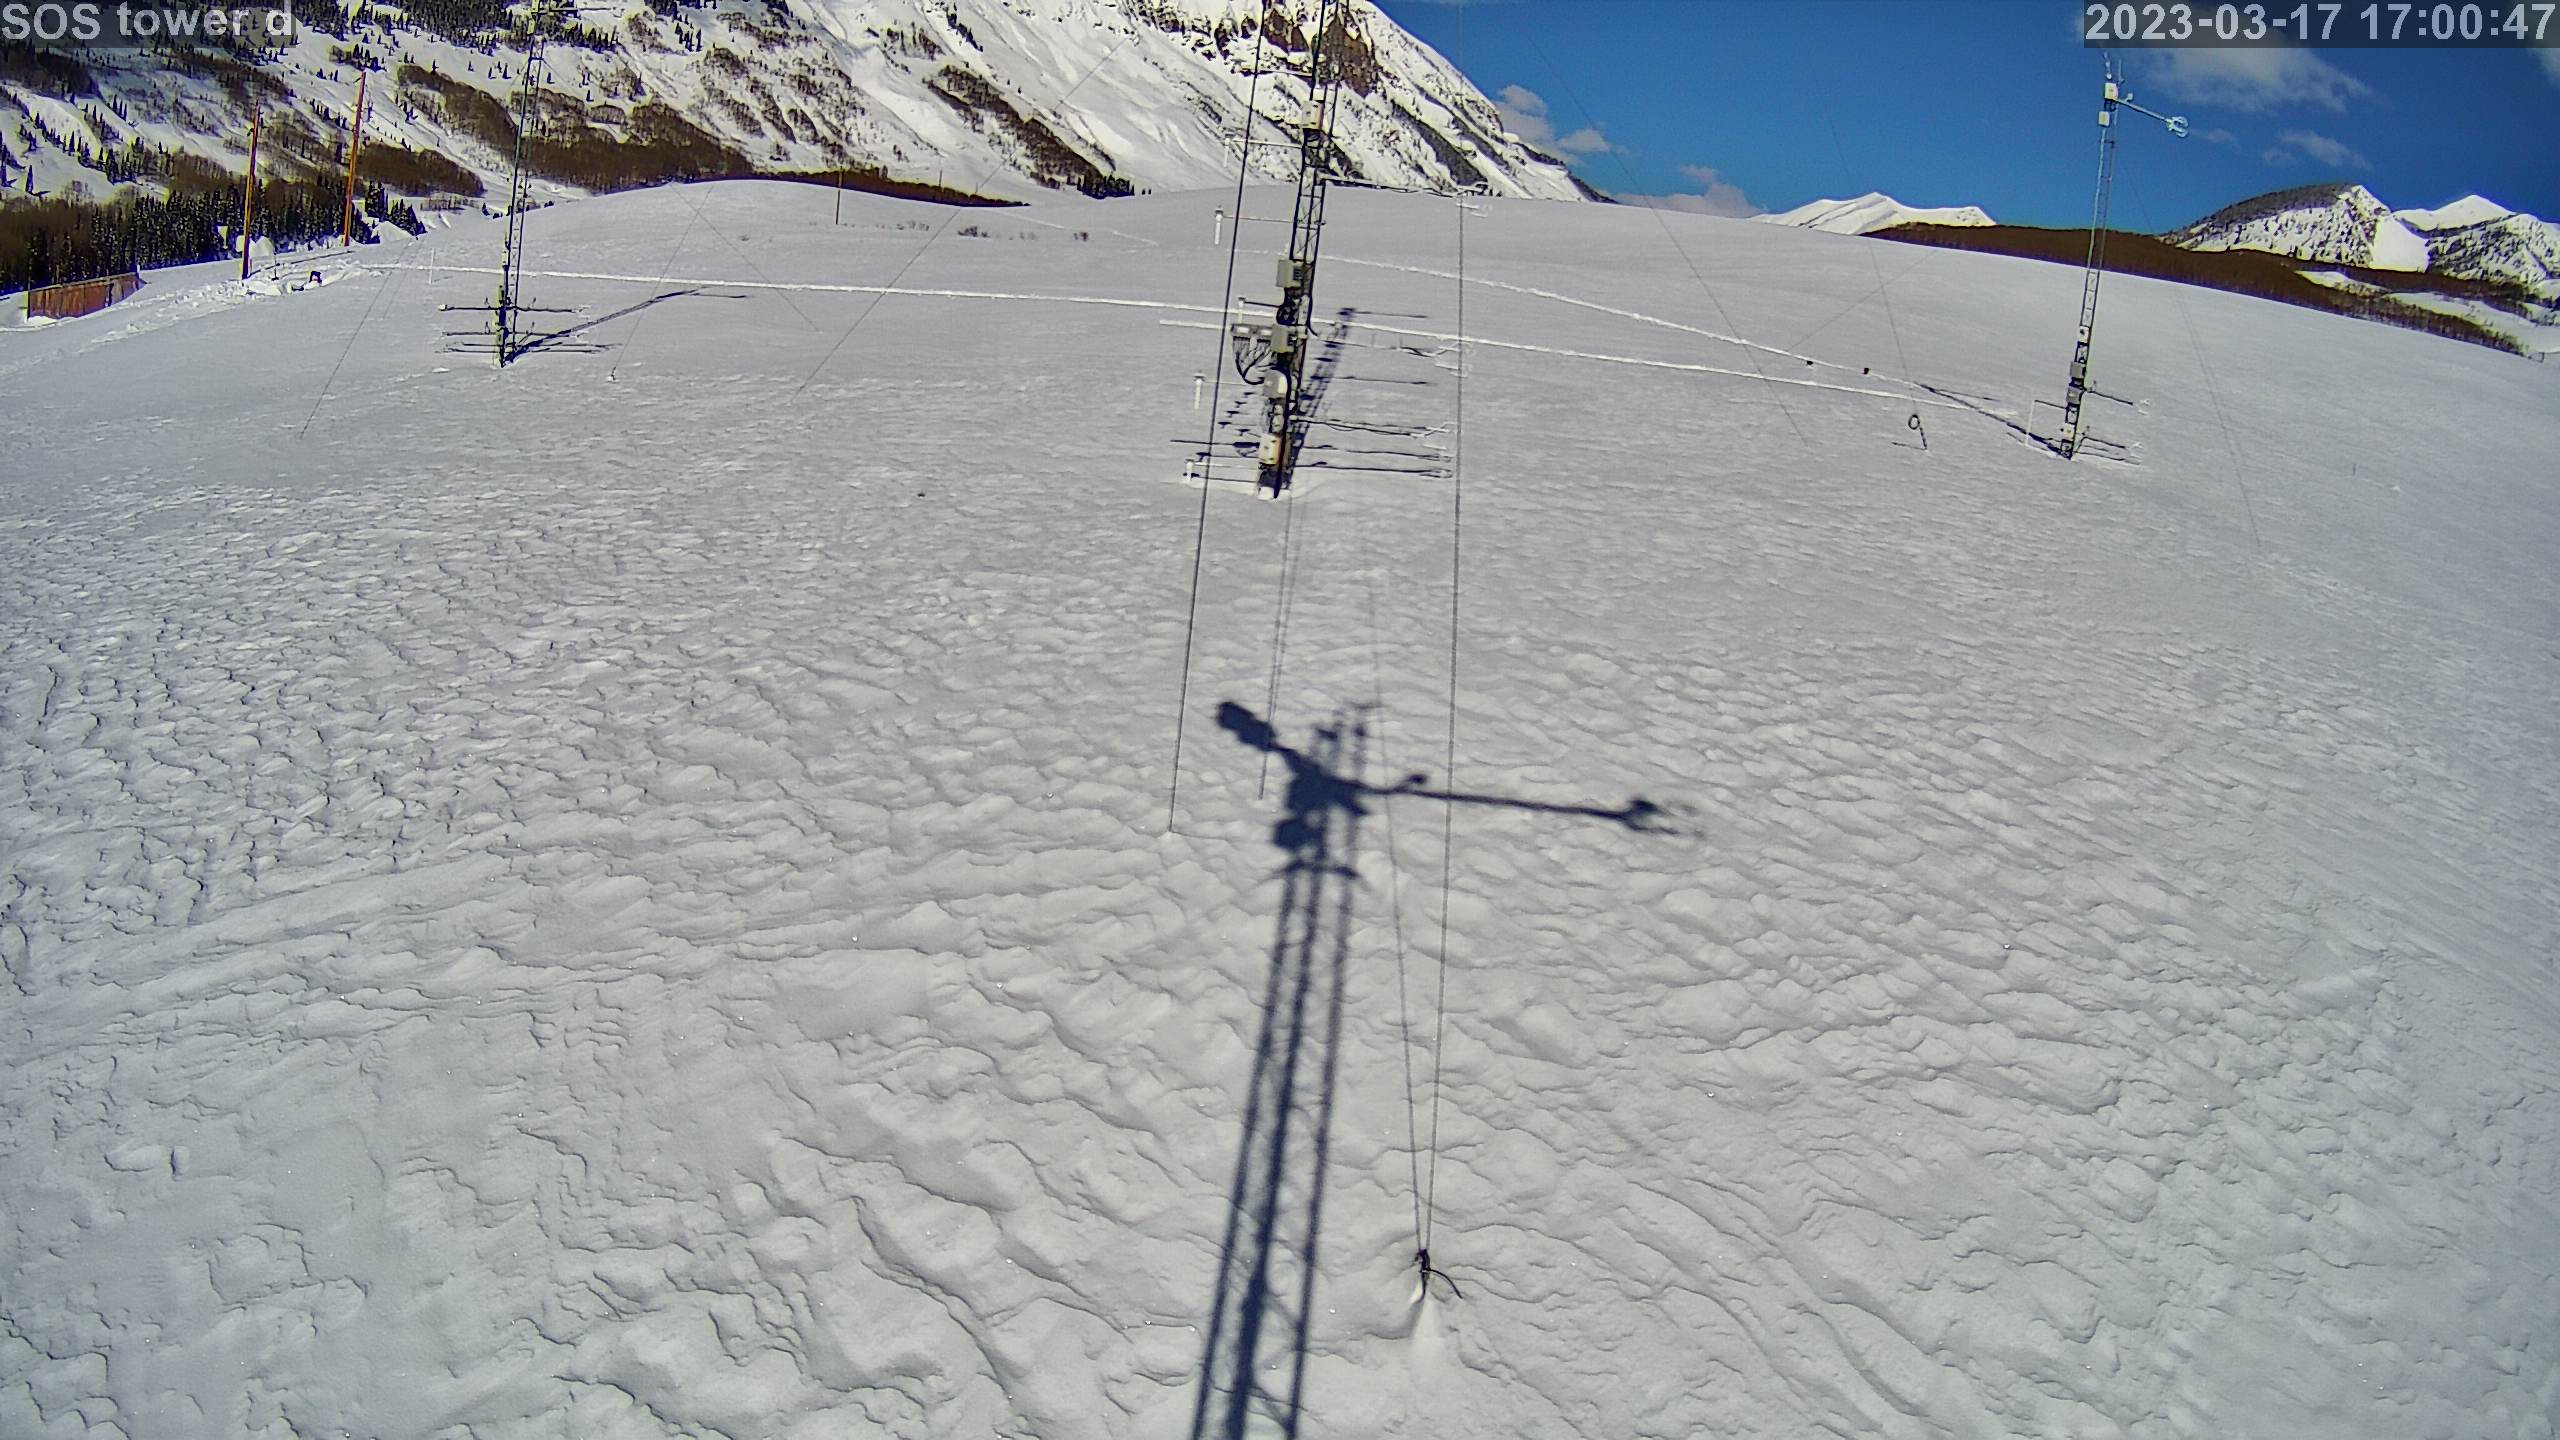
|
photo 2023031718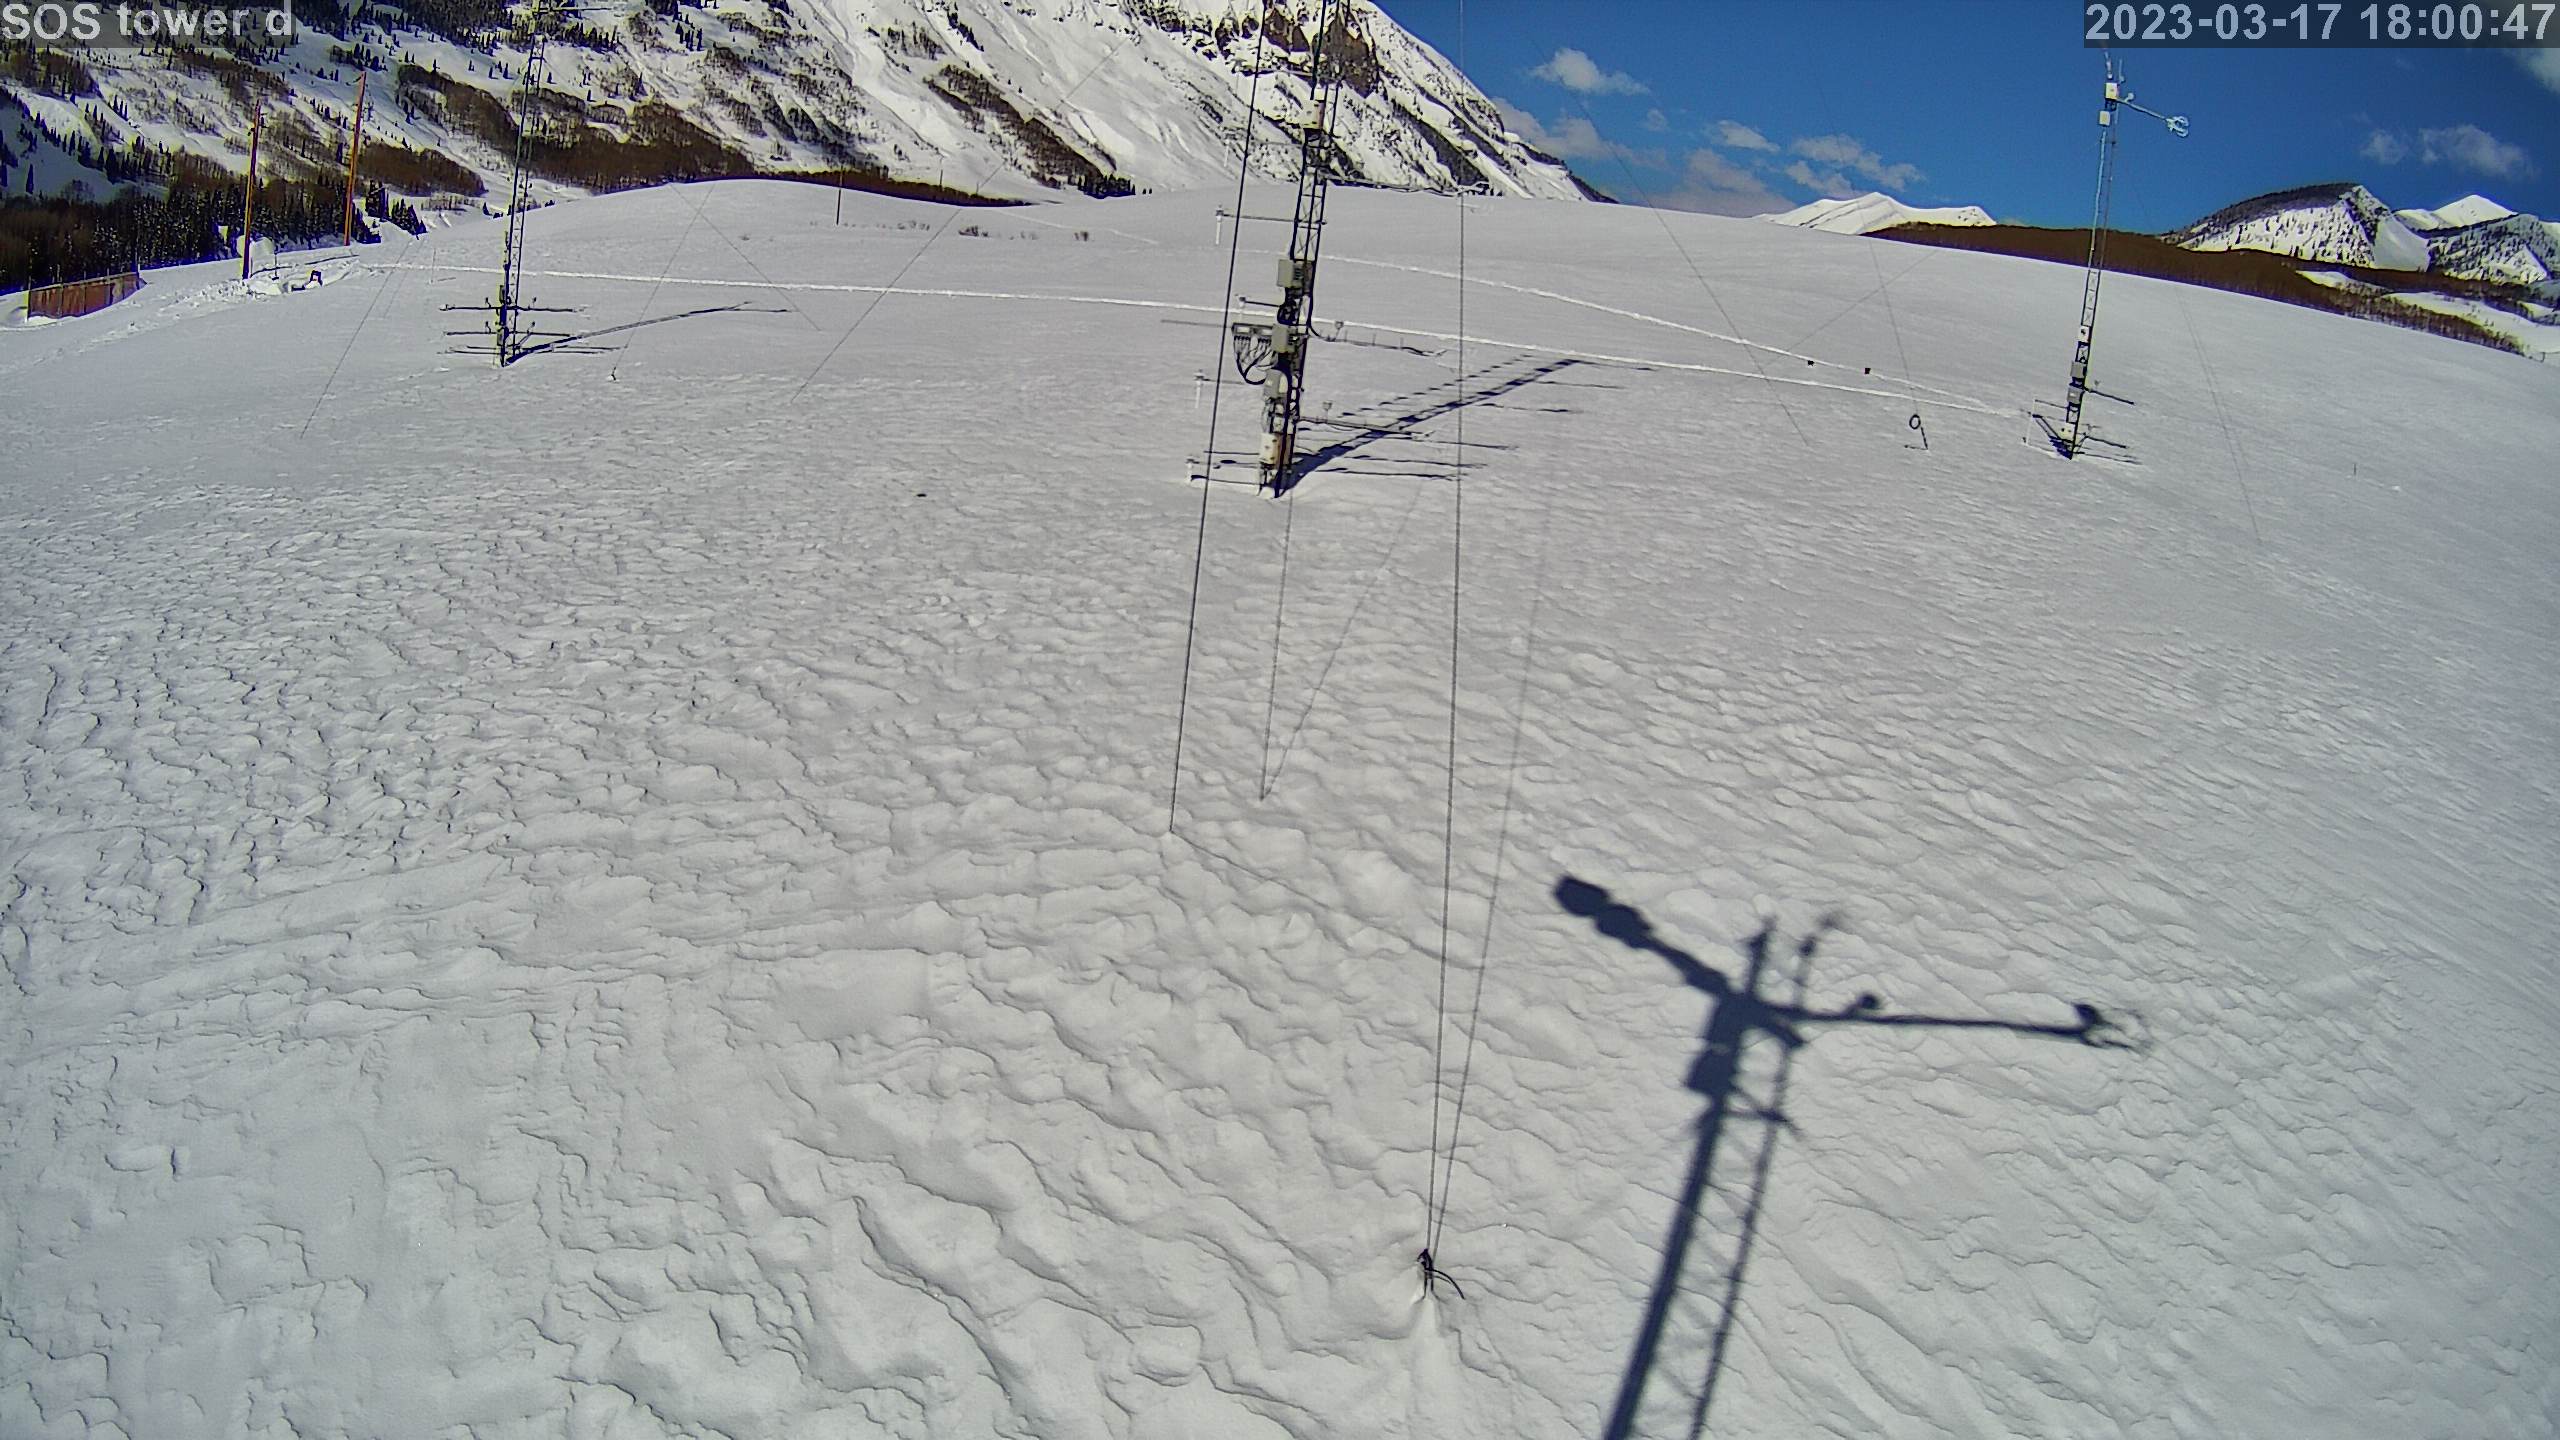
|
photo 2023031719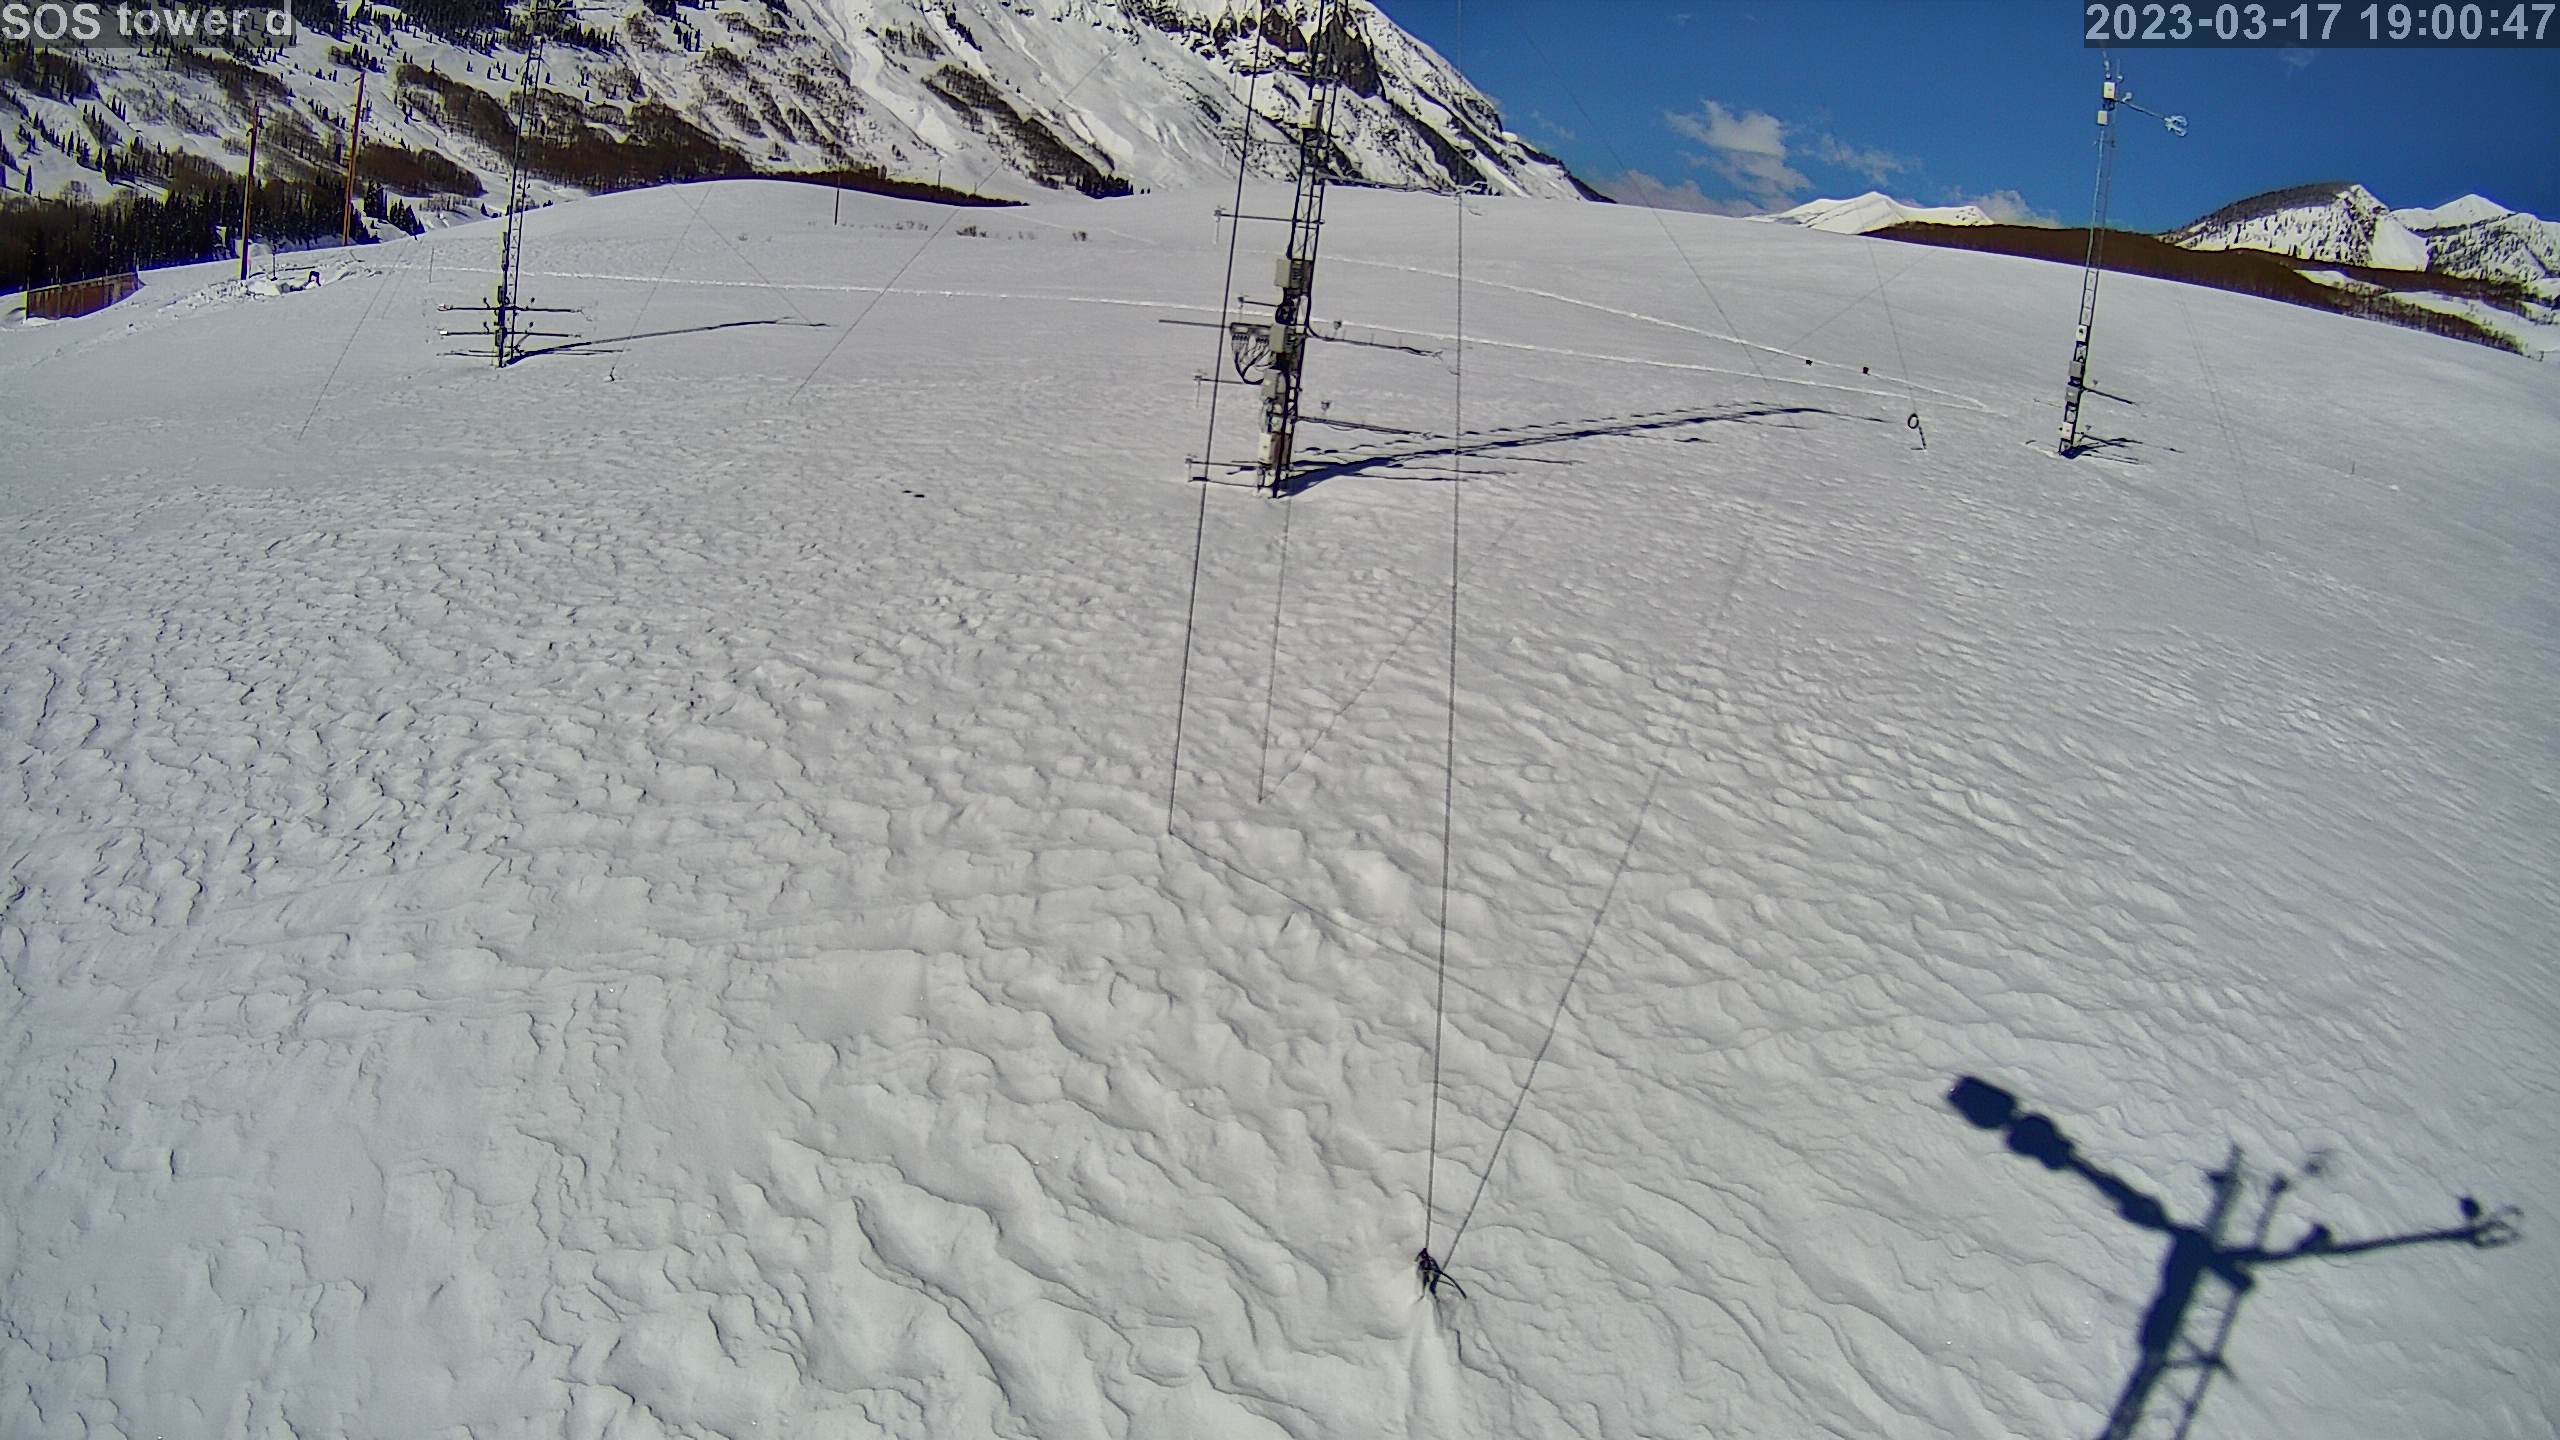
|
photo 2023031720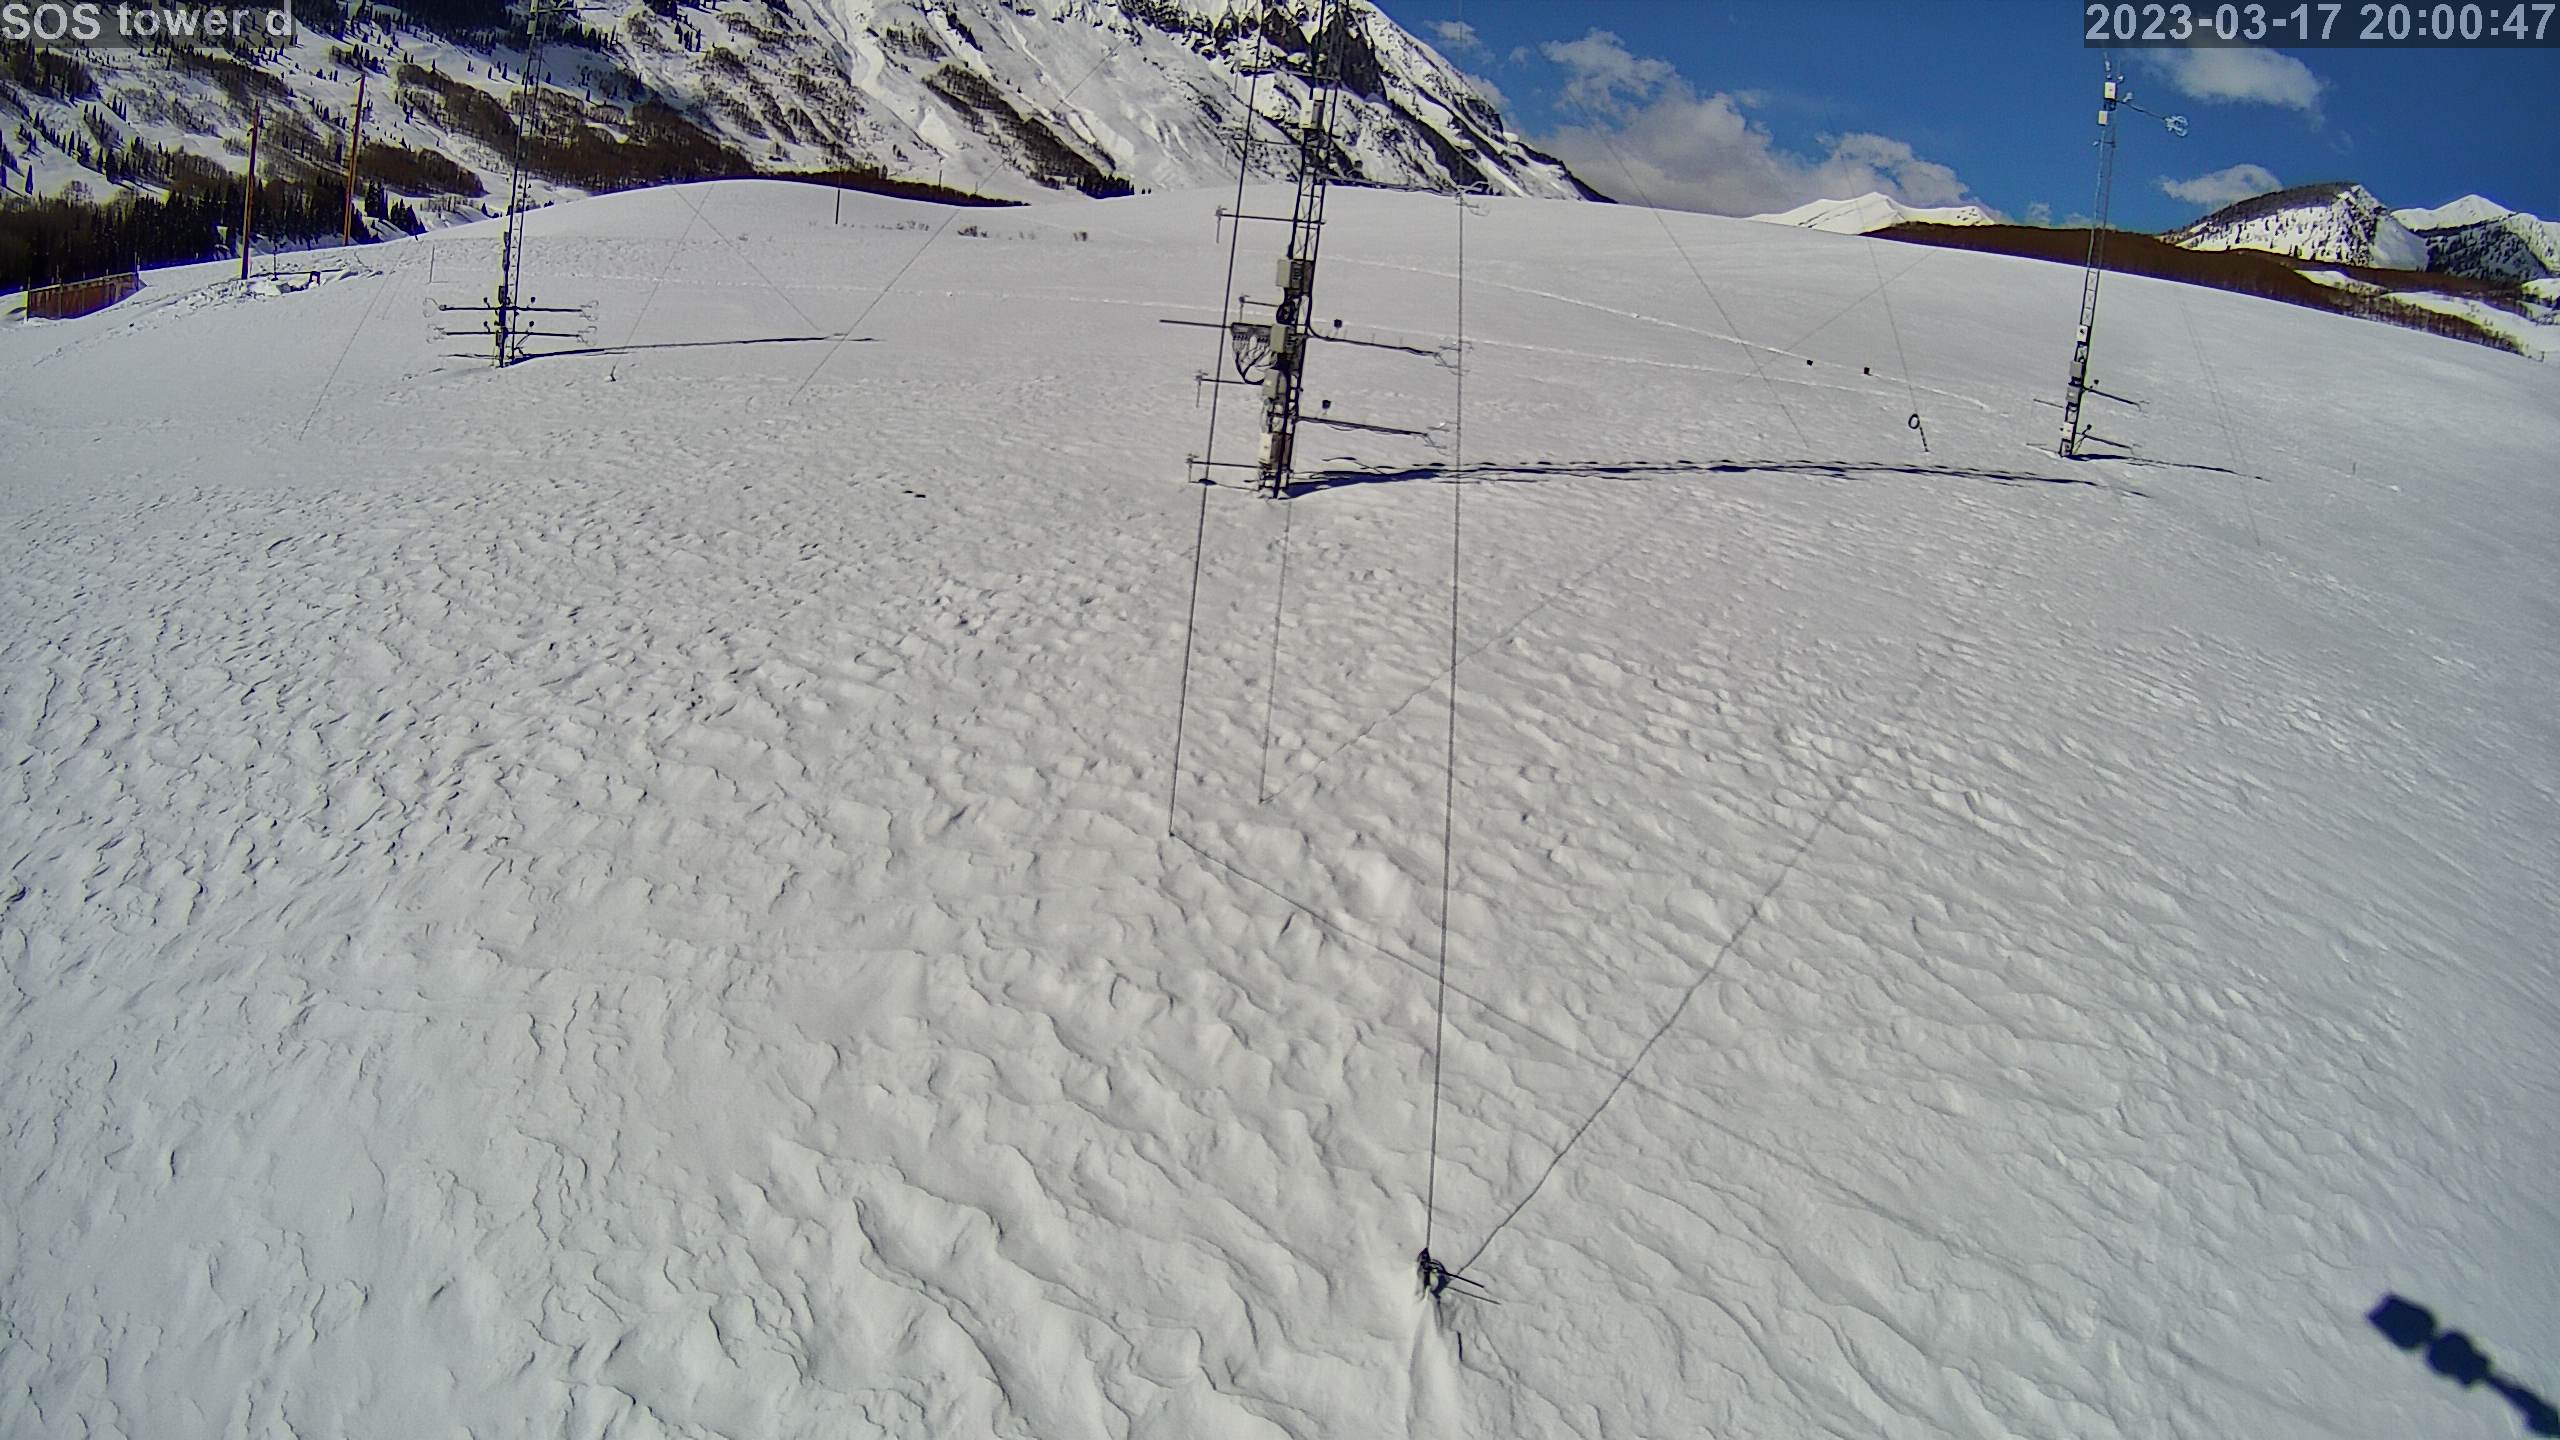
|
photo 2023031721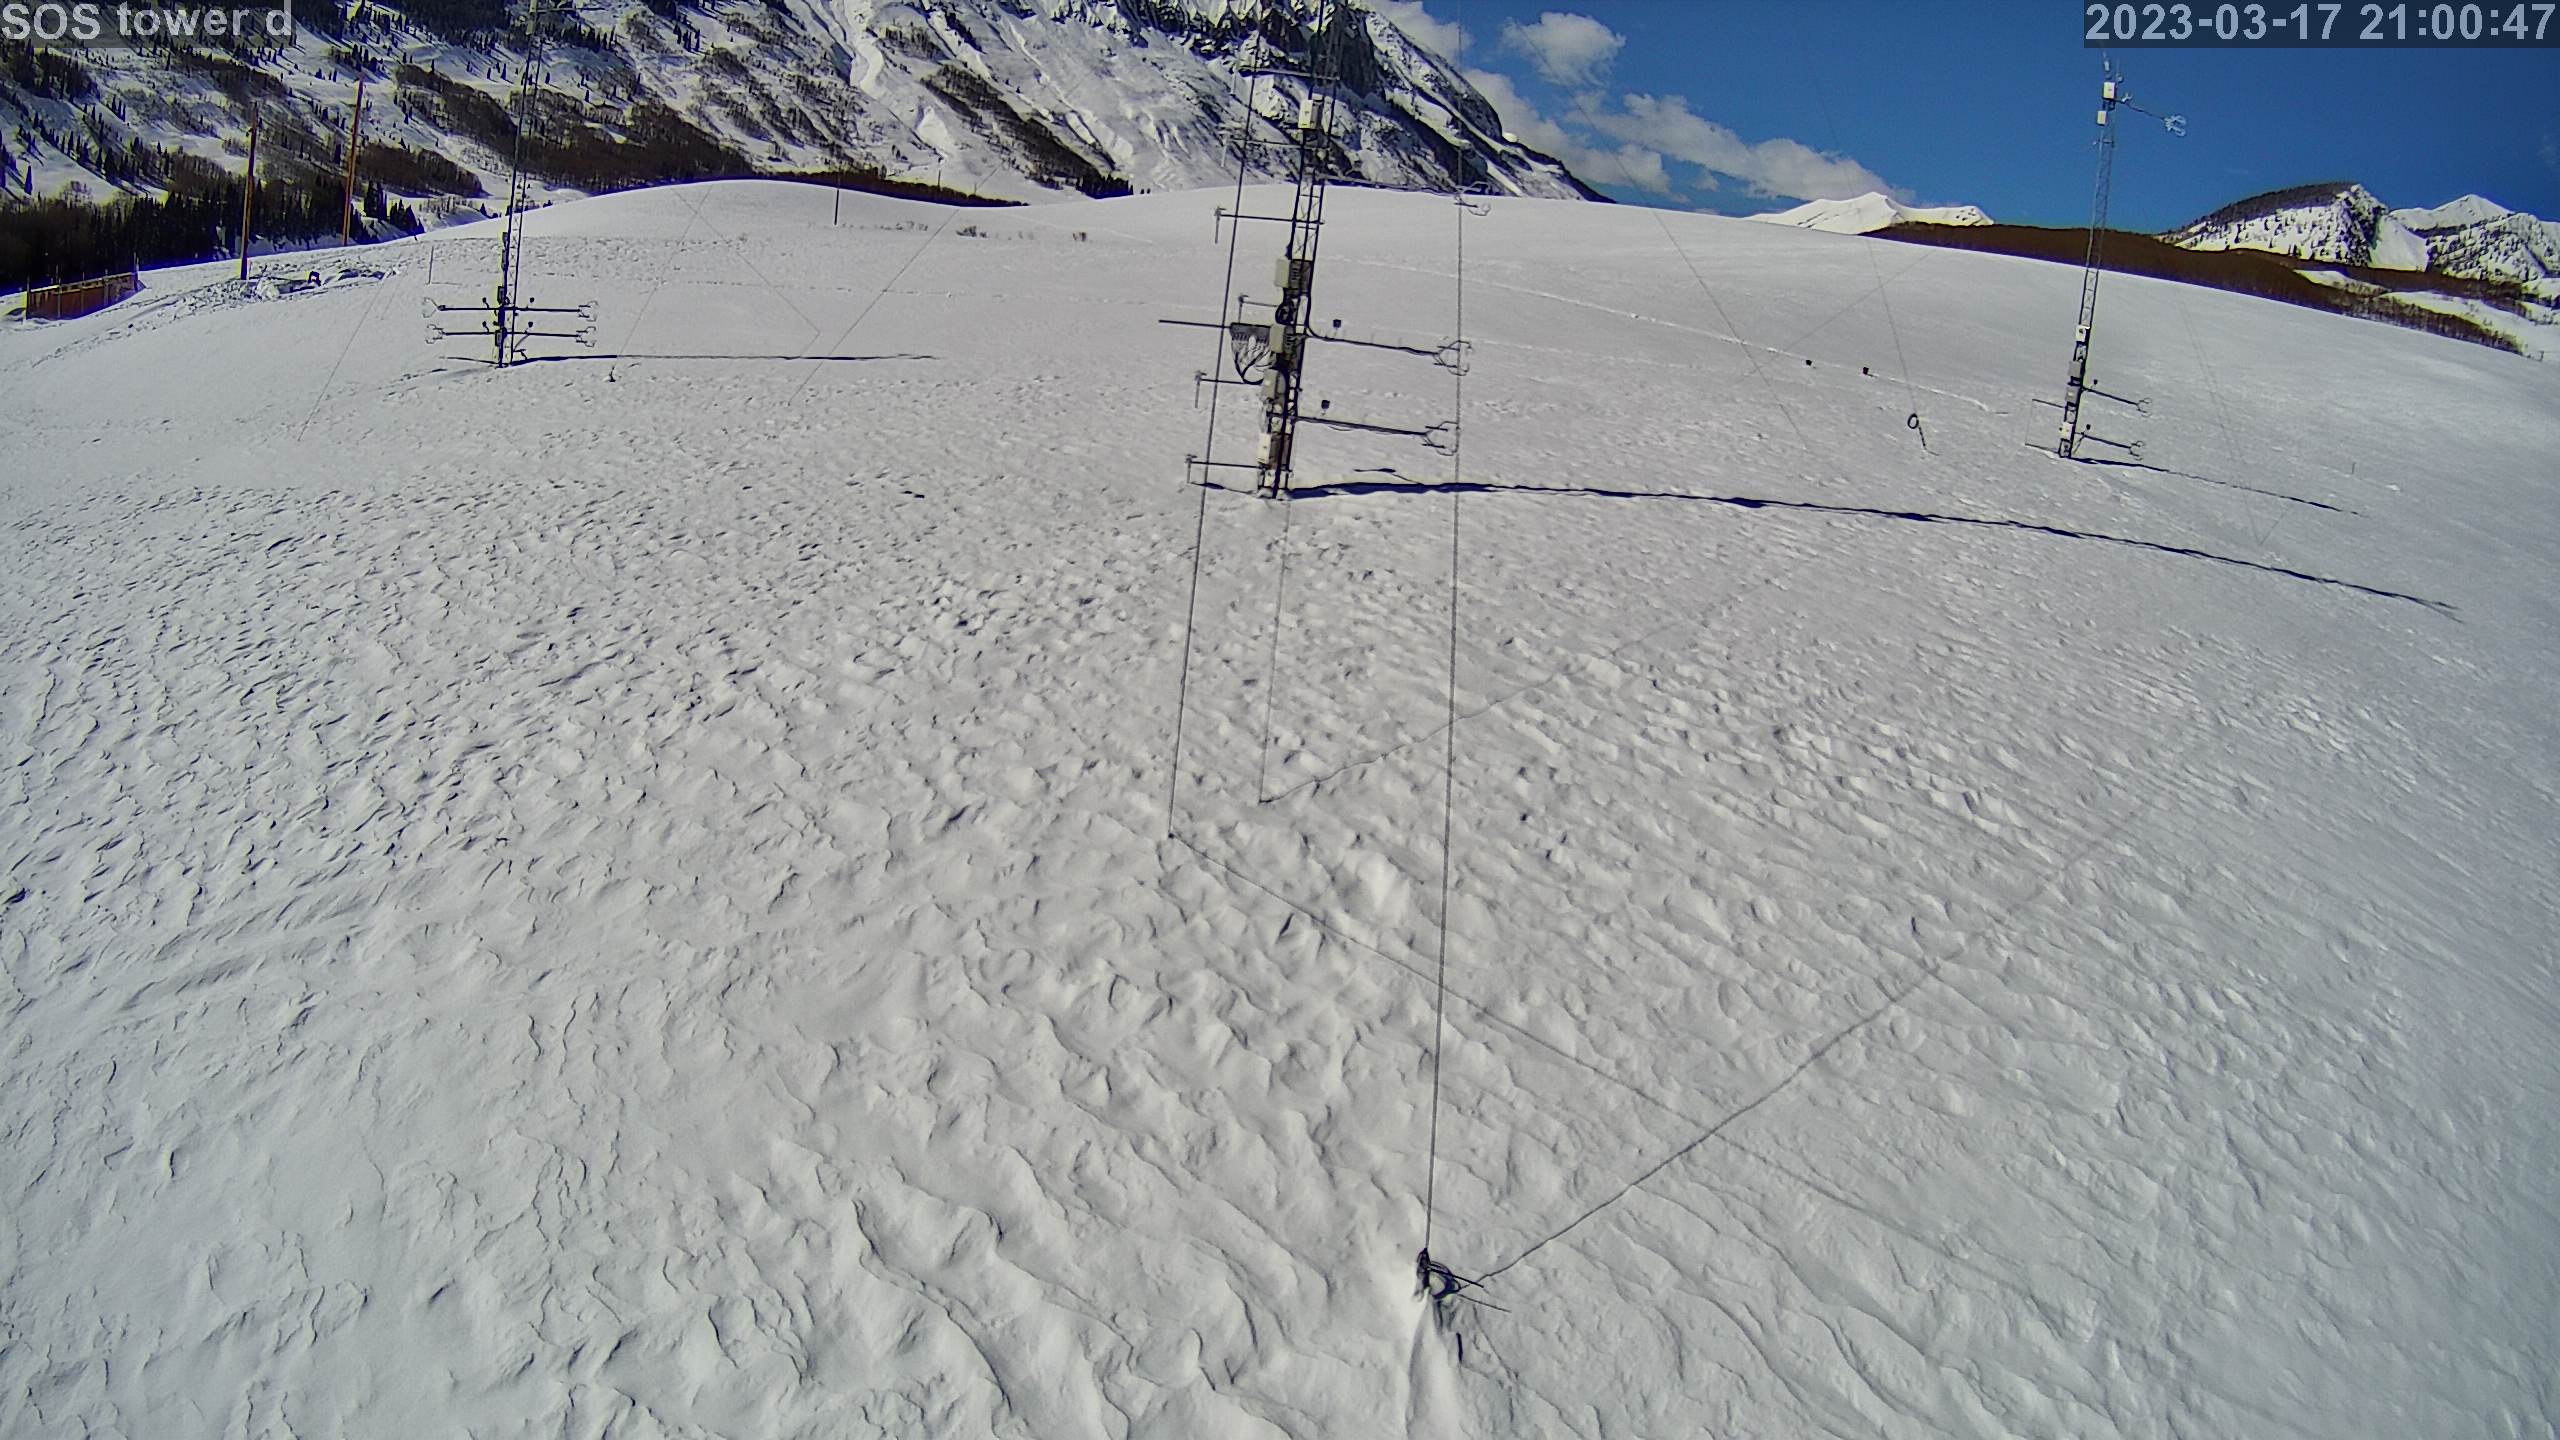
|
photo 2023031722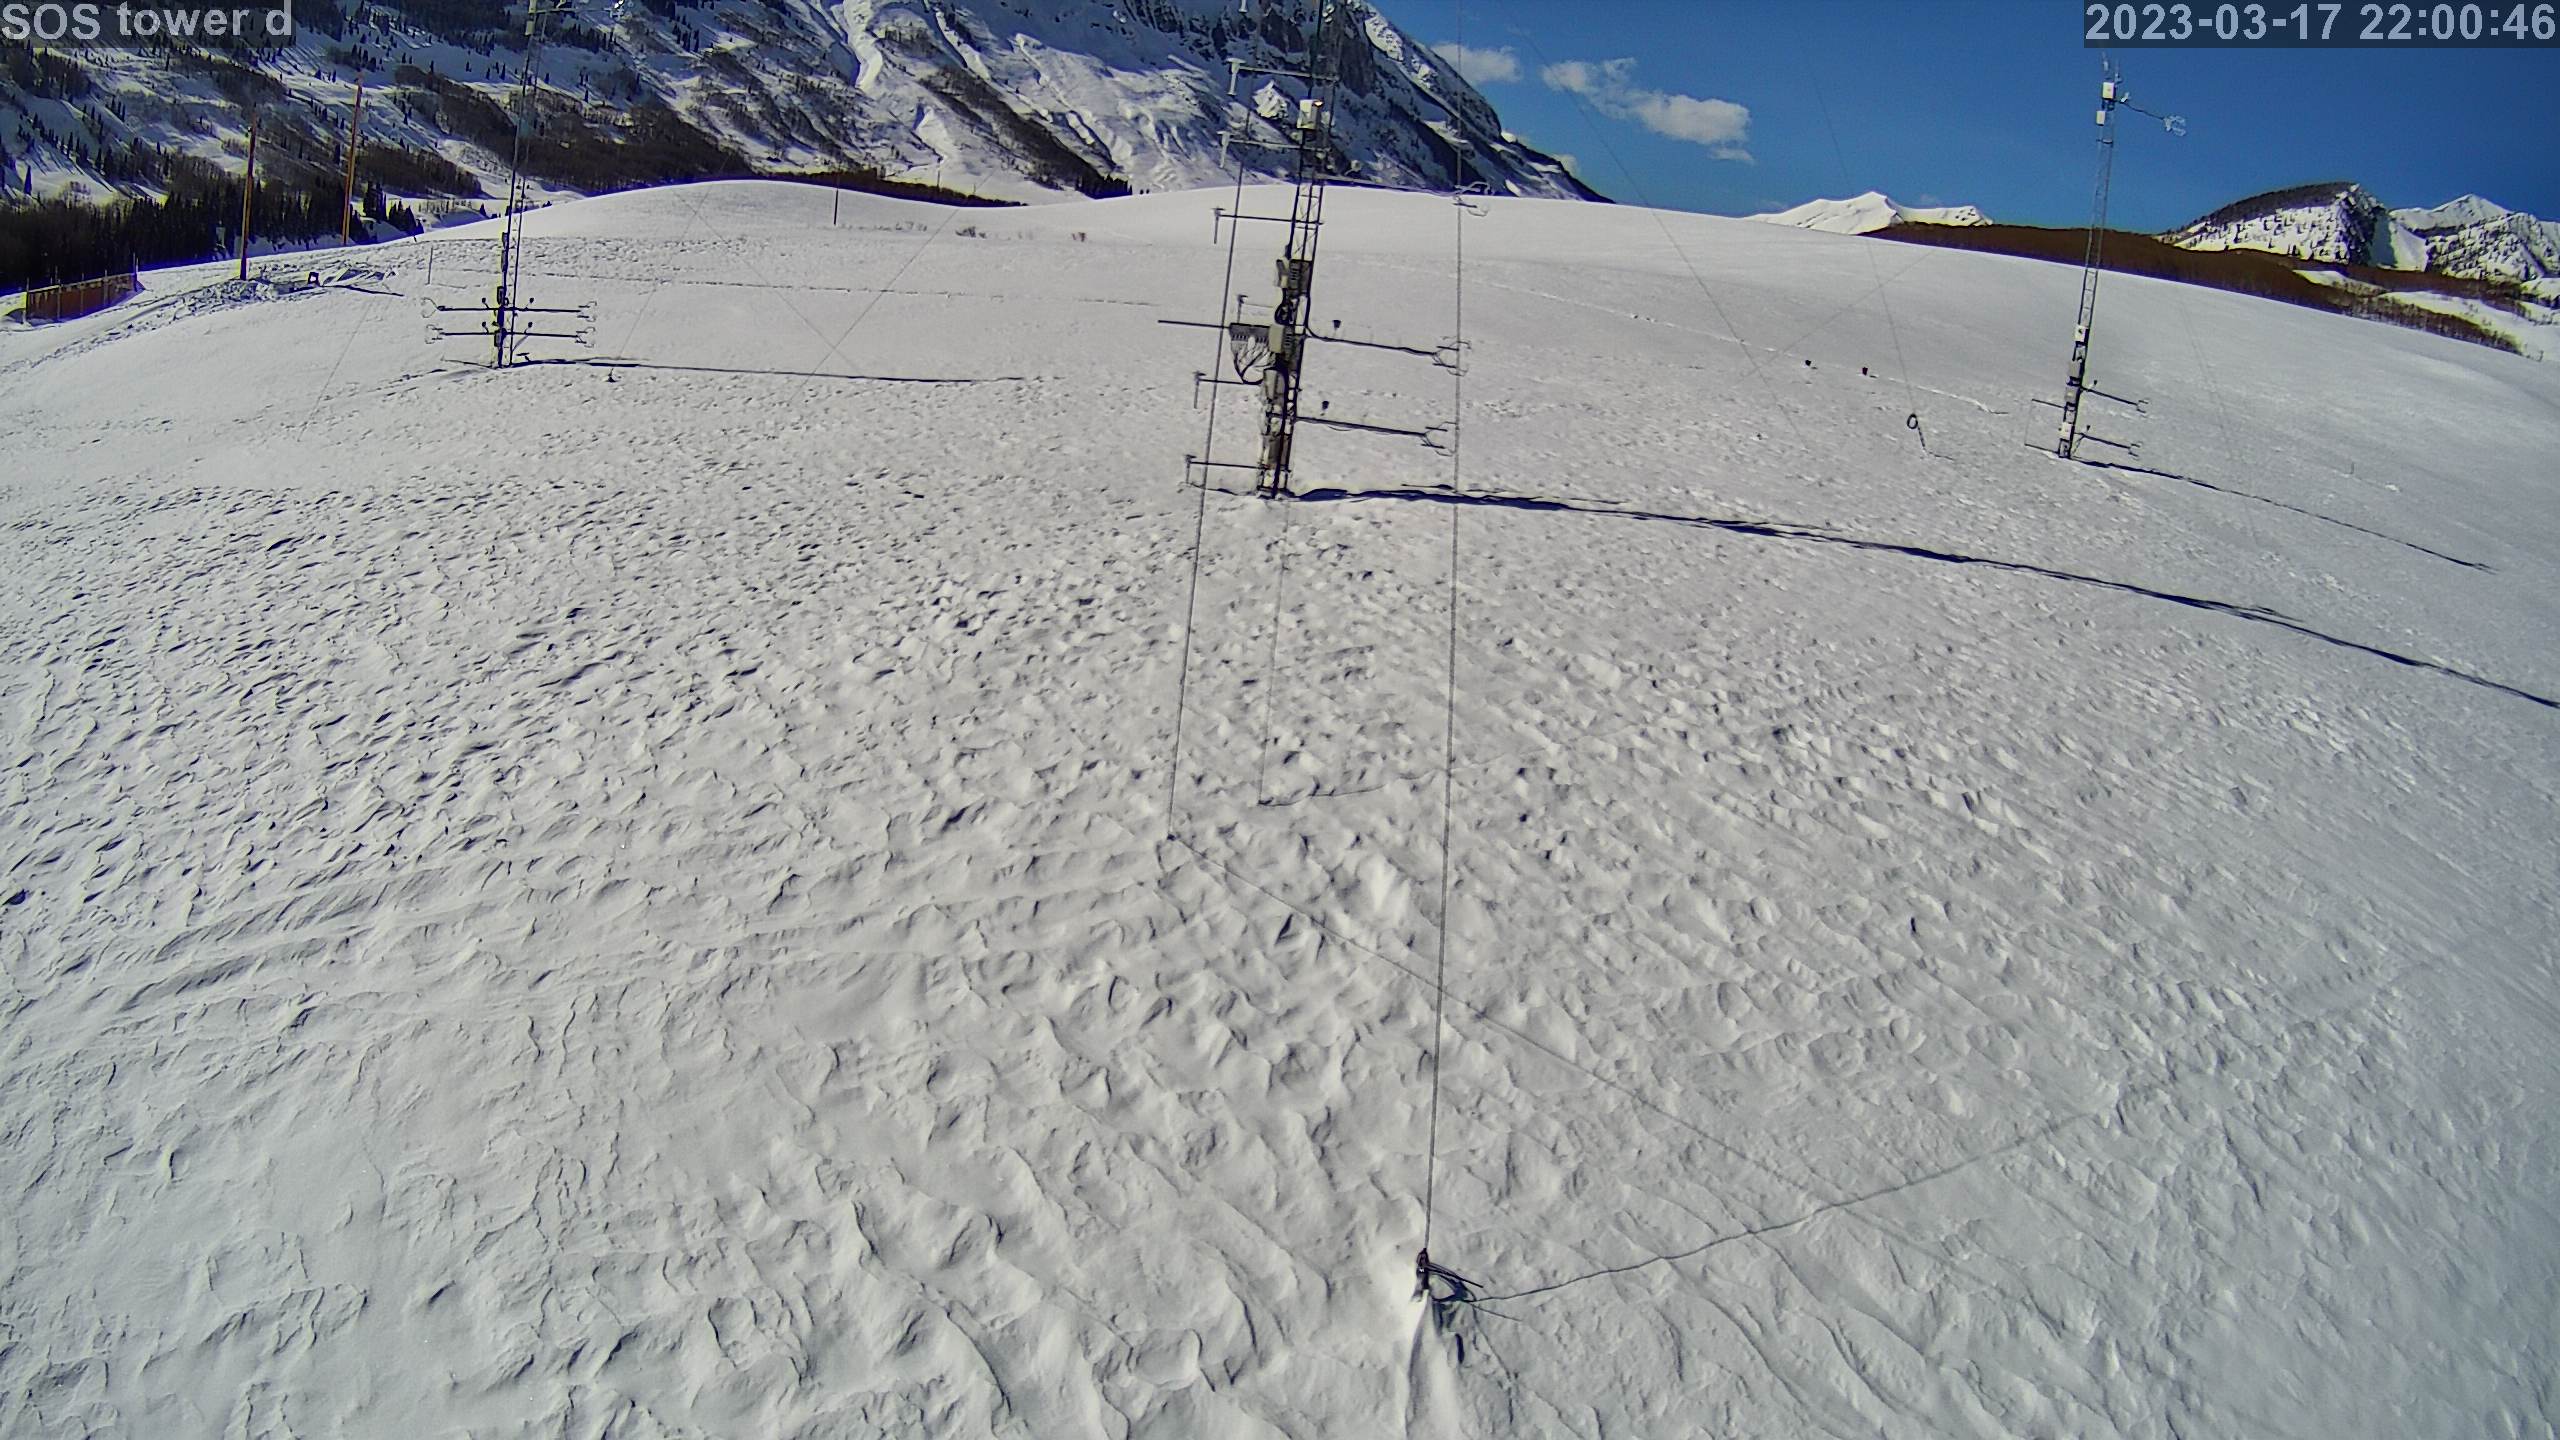
|
photo 2023031723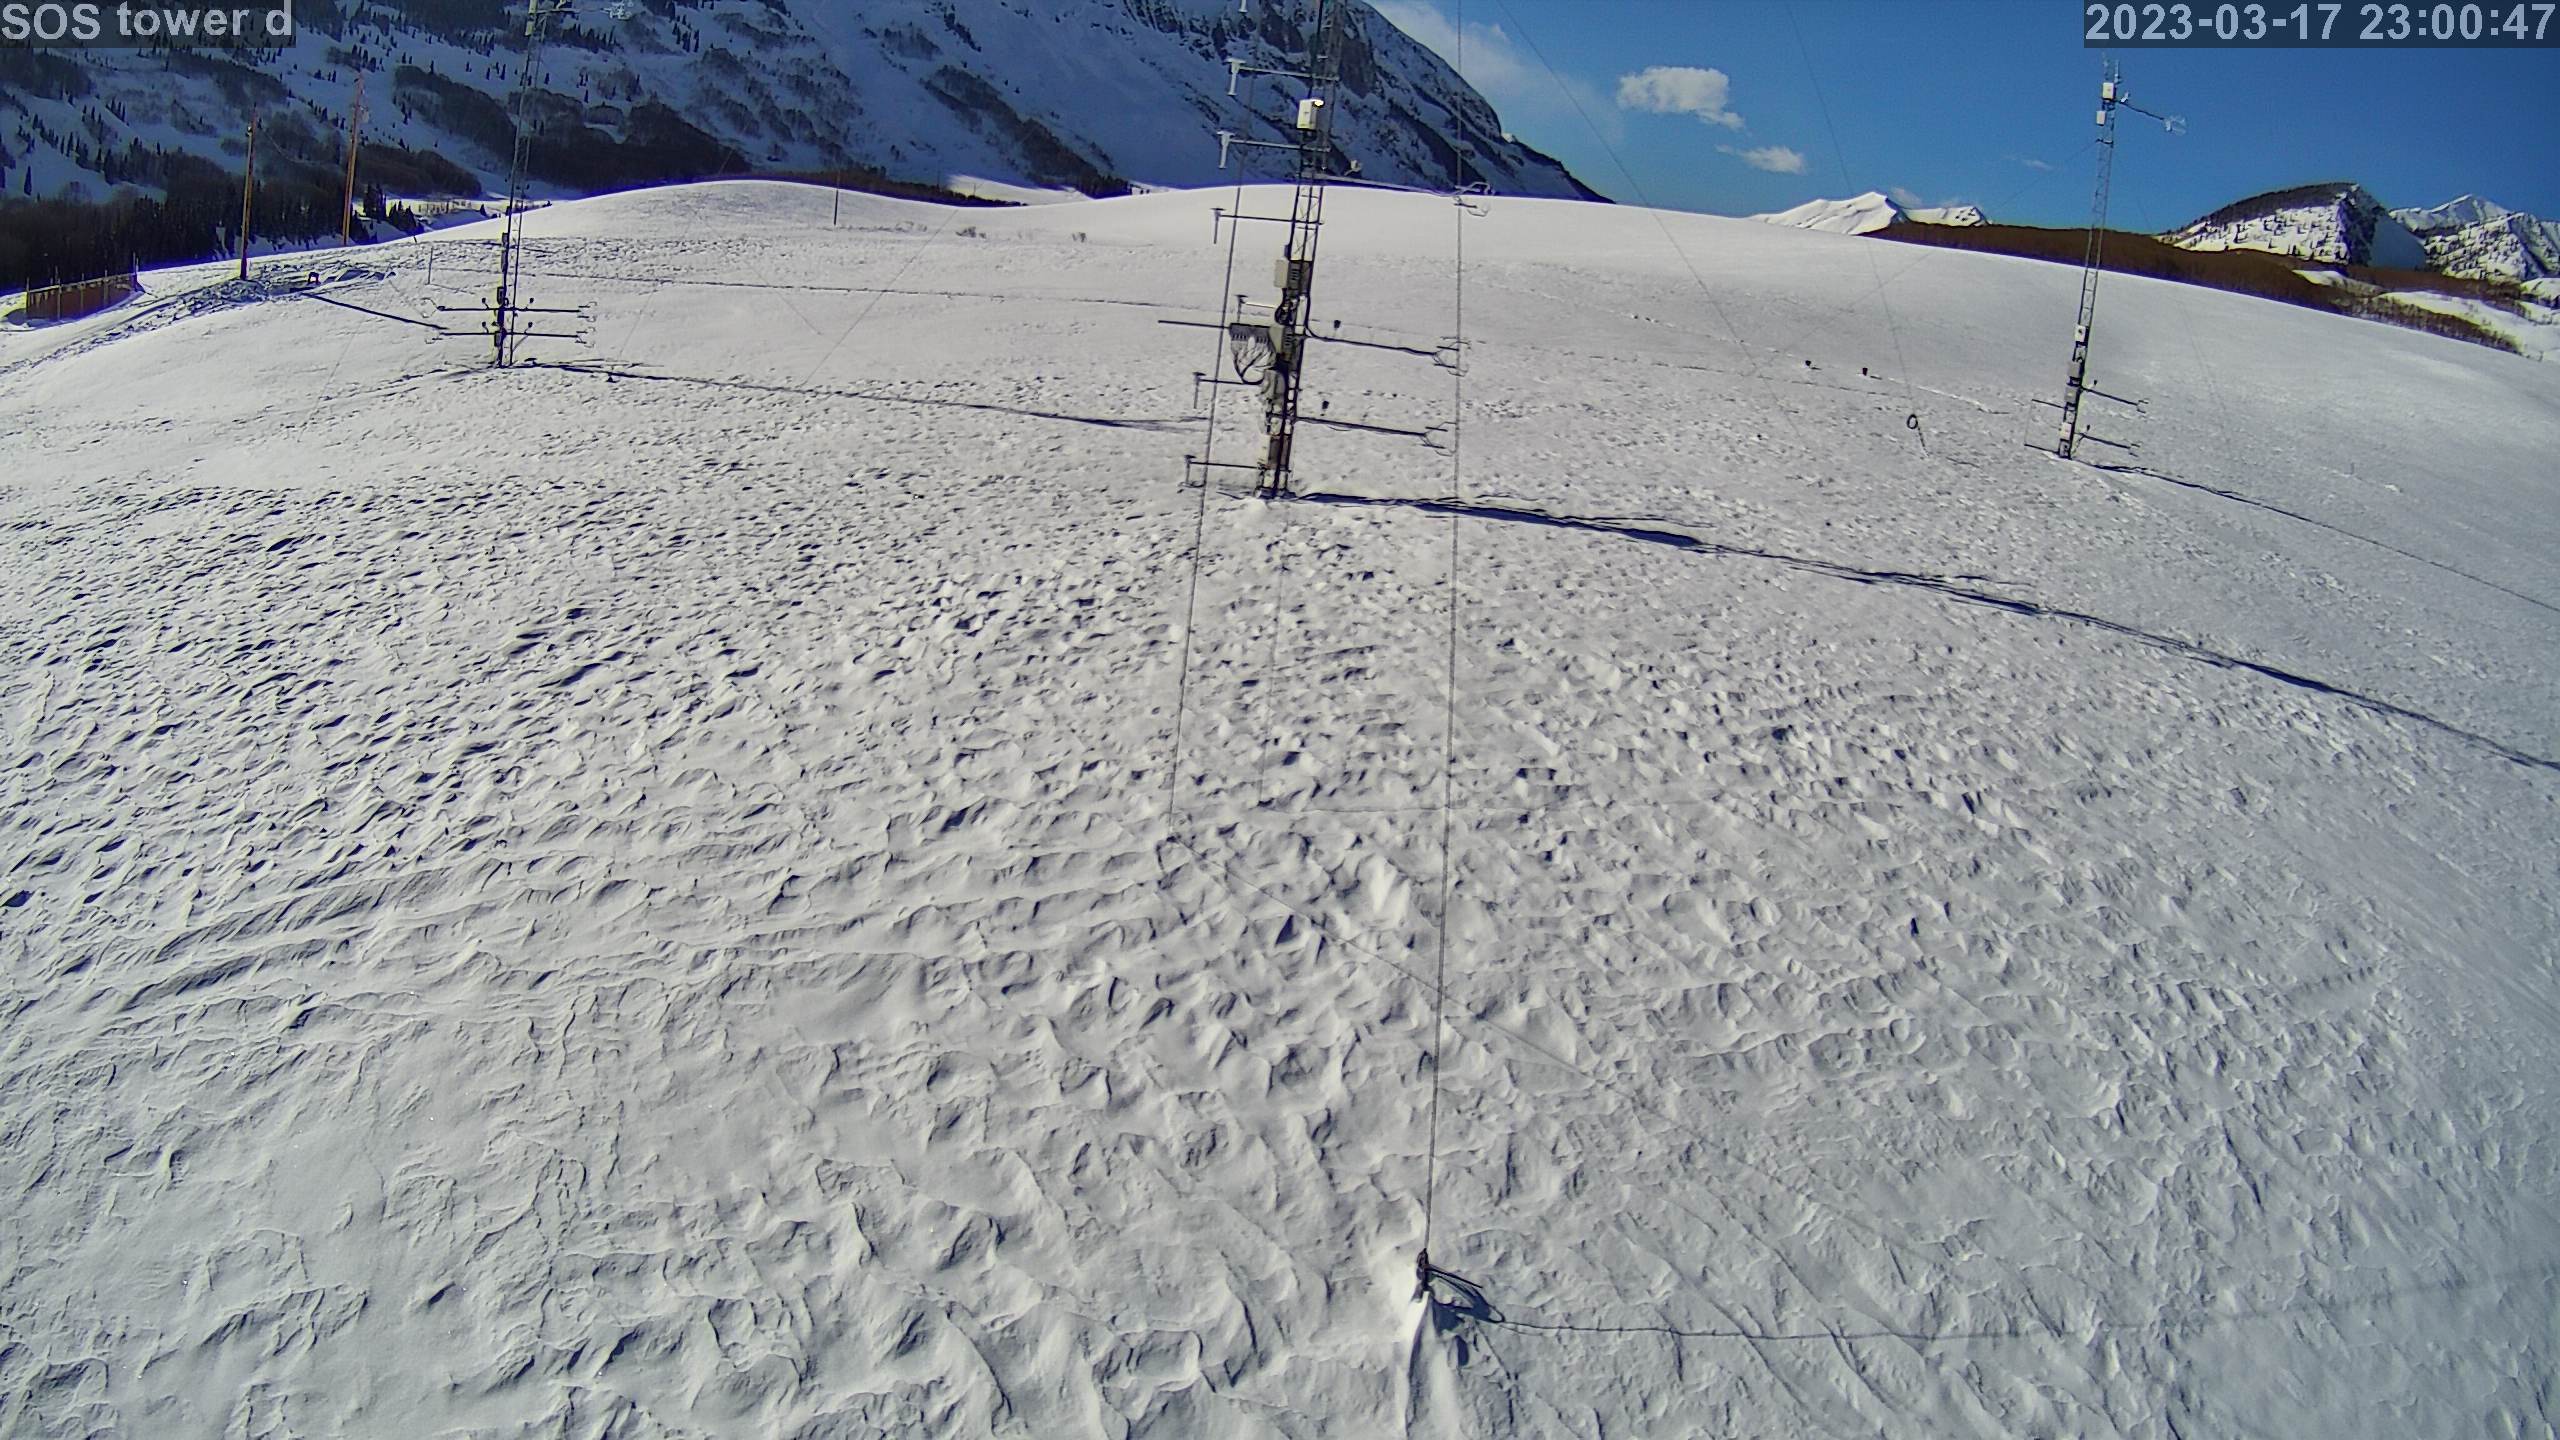
|