| Previous day | Select day | Next day |
The most recent plots are generally updated every 15 minutes. Use the browser reload button to make sure you are seeing the latest version of a plot.
In order to distinquish the traces on the vertical profile plots, a slight offset in X is added to some traces. This is indicated by a "(n)" in the legend for the trace.
If you right-click on an image, most browsers will provide a menu to download or display the plot in another window.
photo 20230206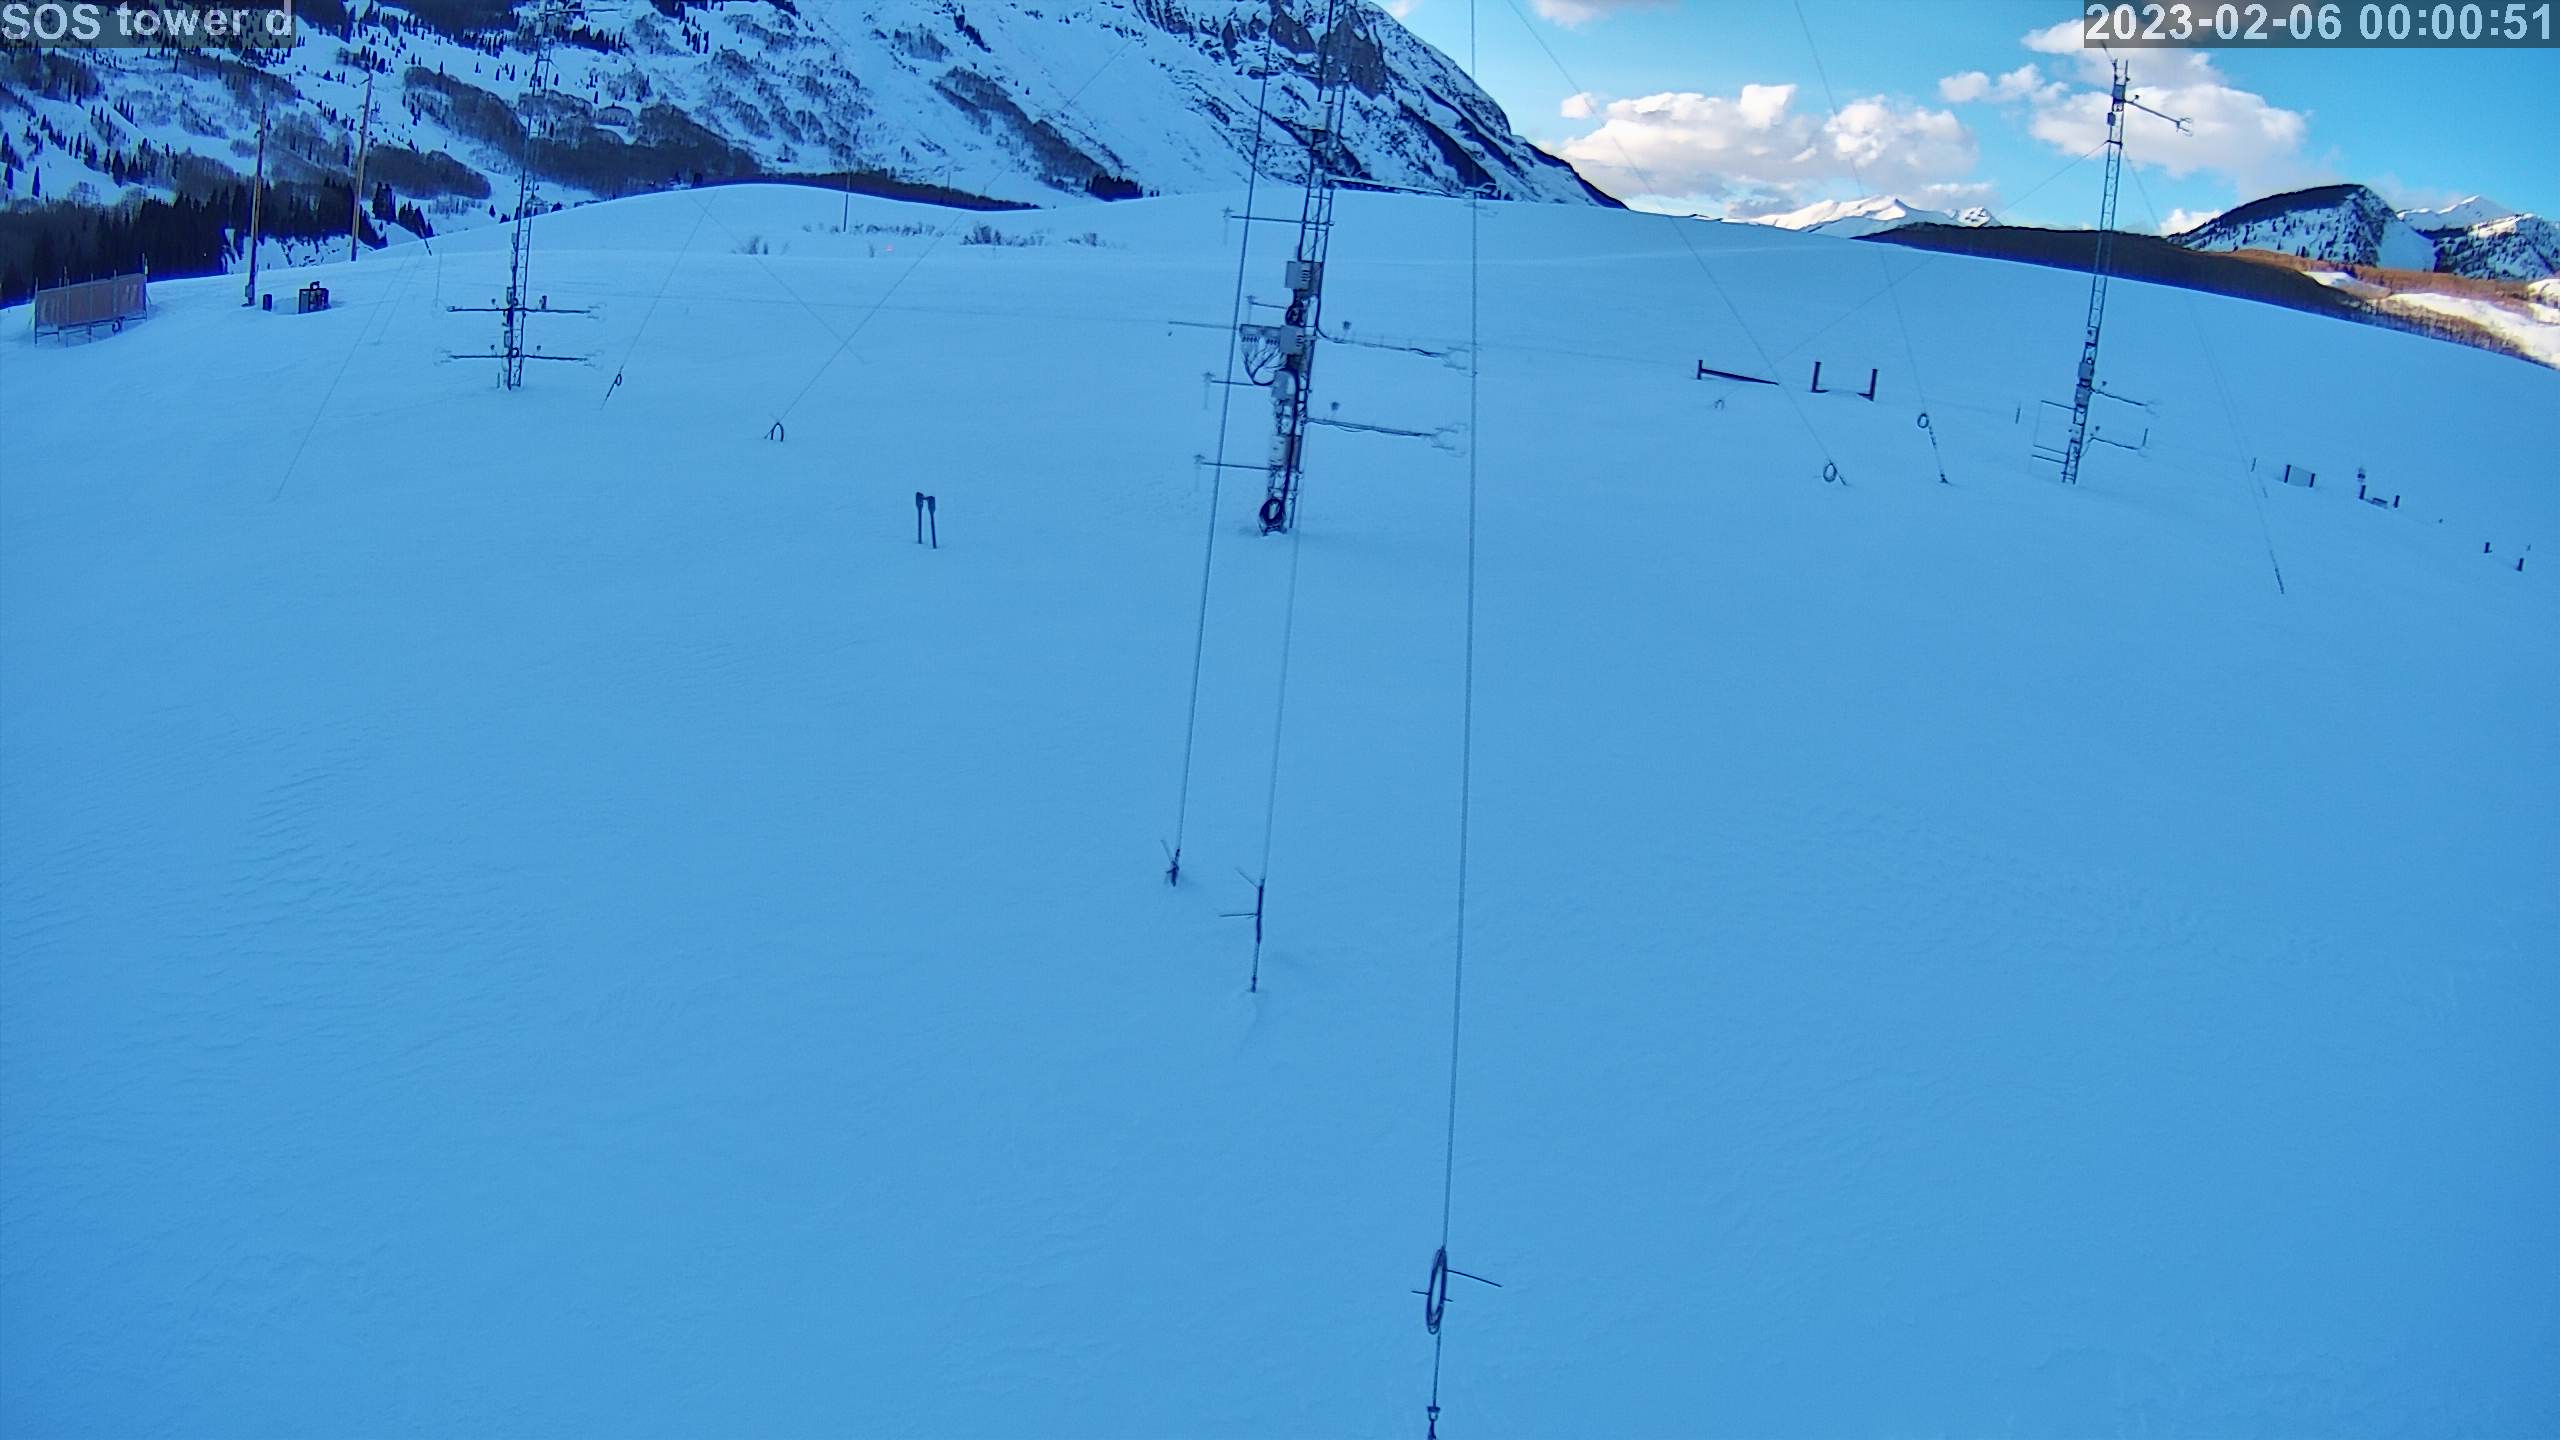
|
photo 2023020601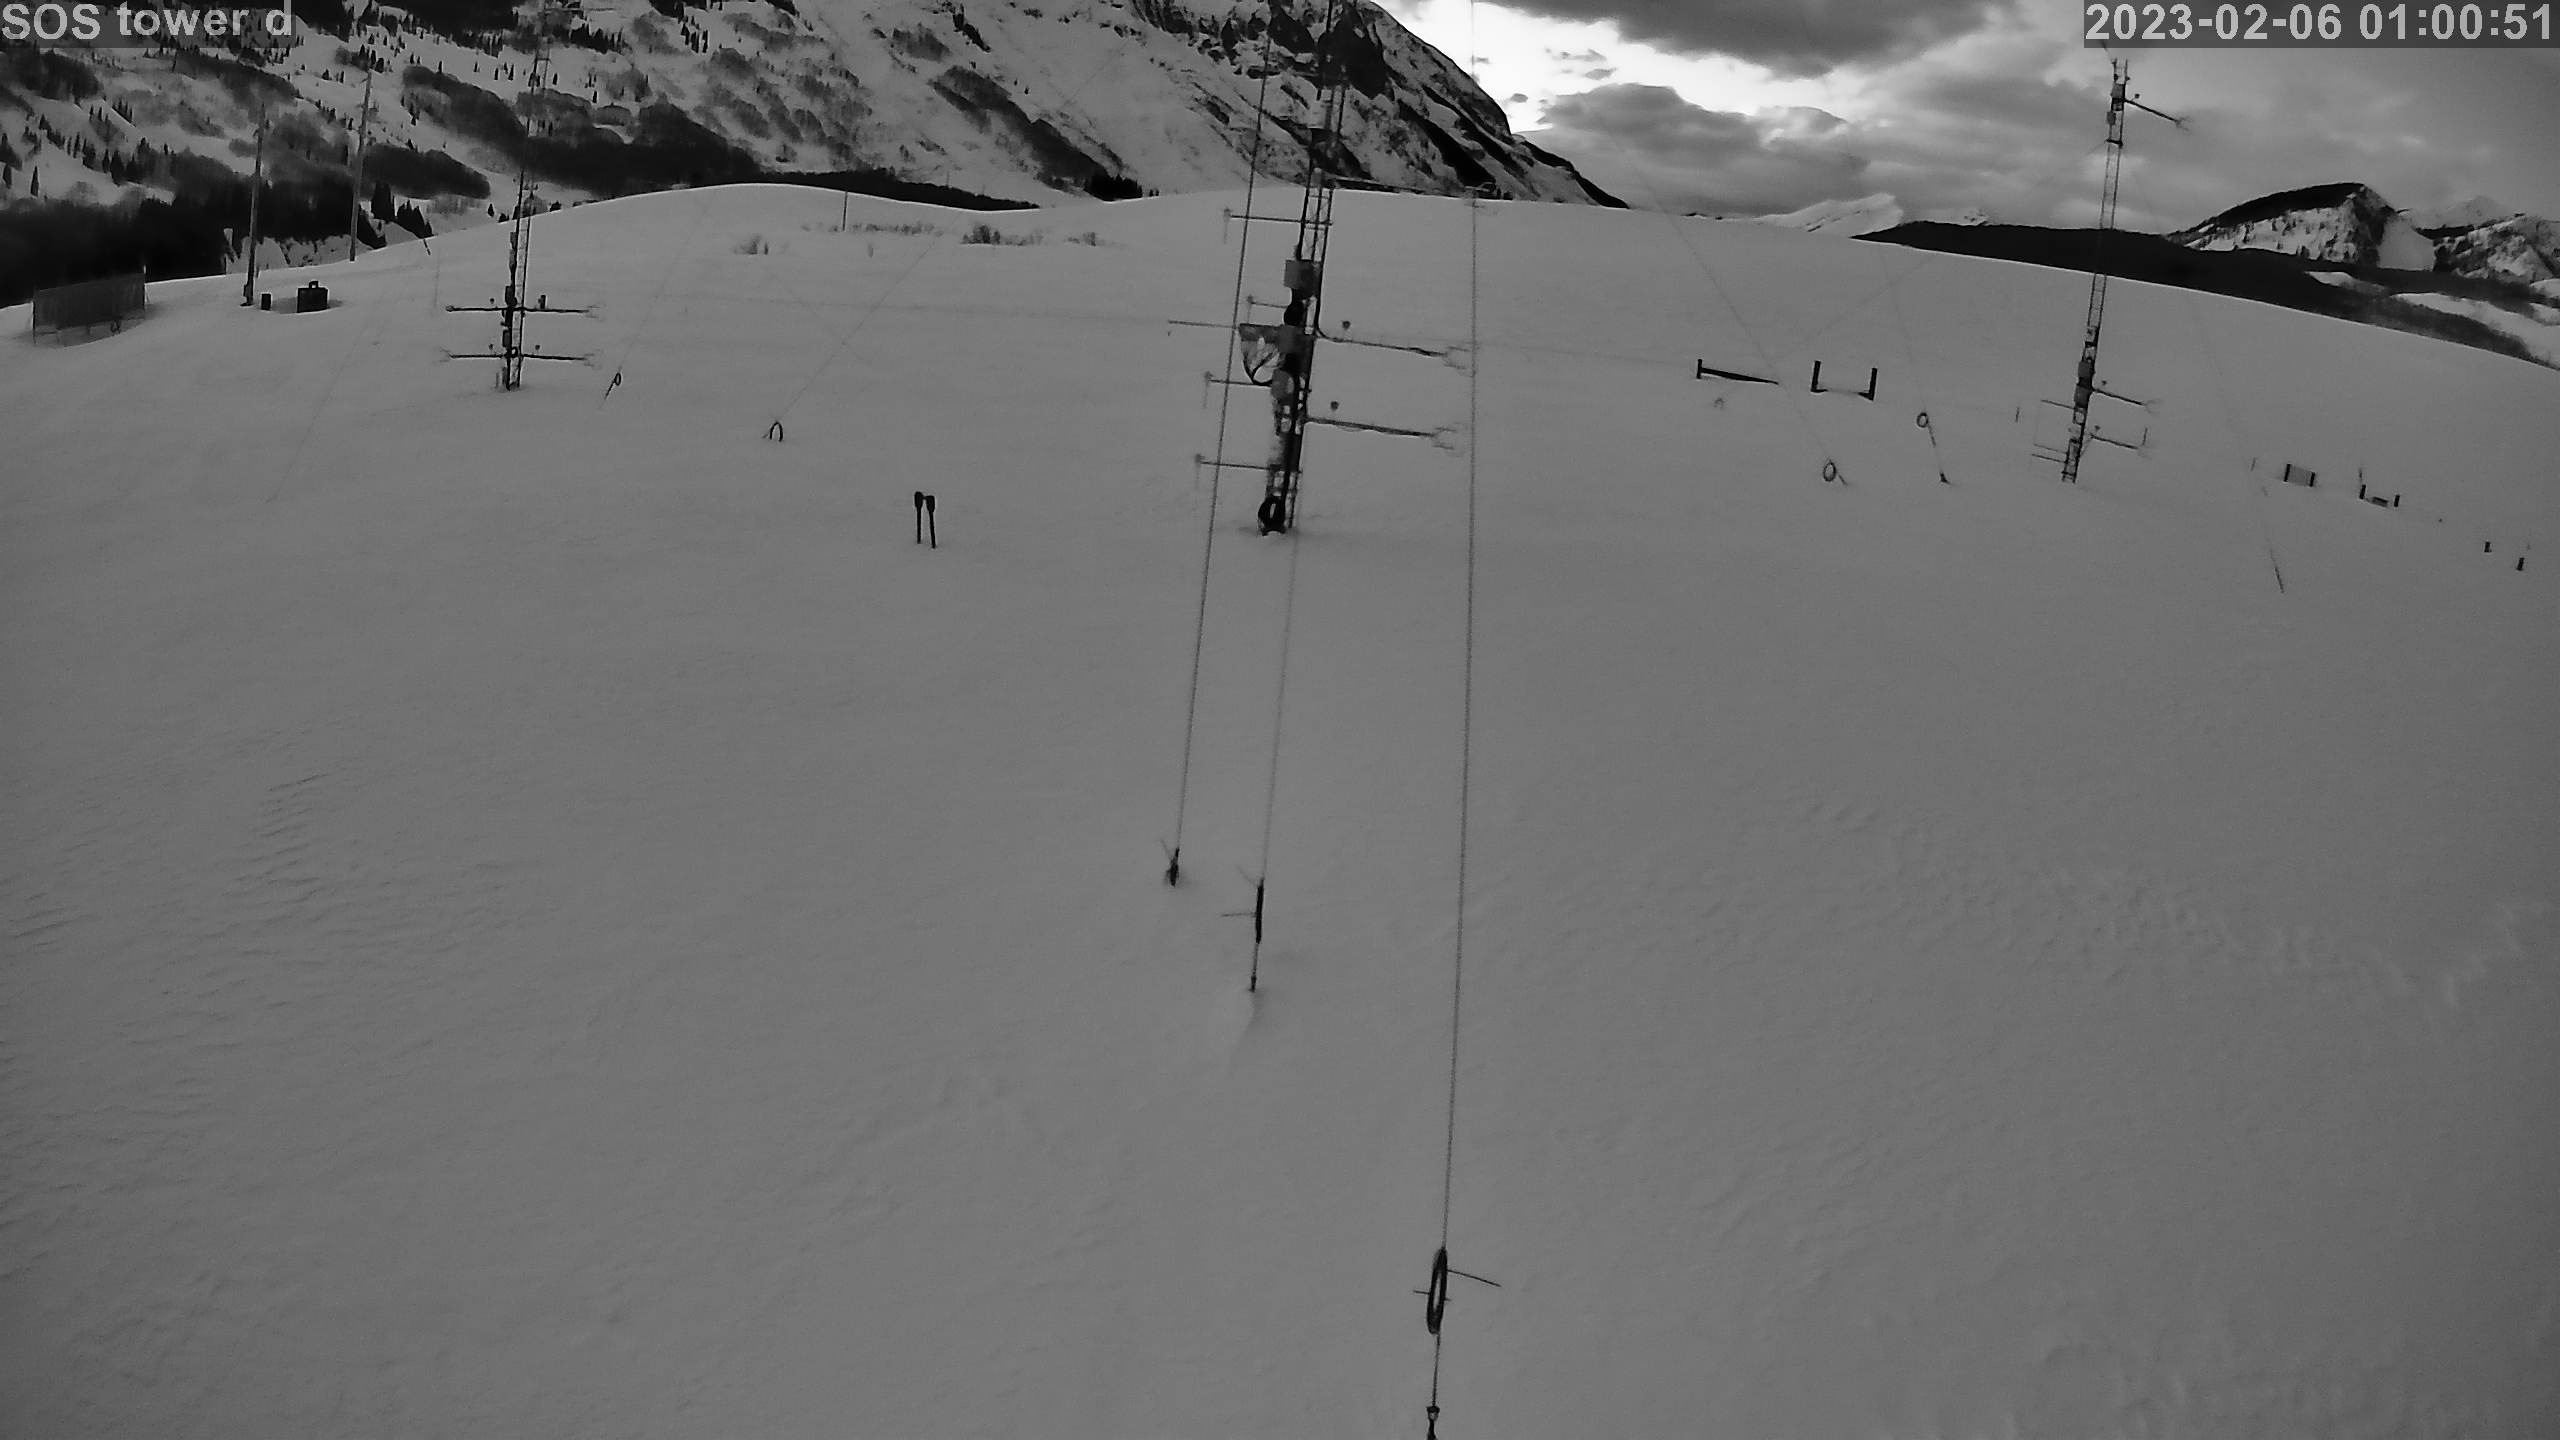
|
photo 2023020602
|
photo 2023020603
|
photo 2023020604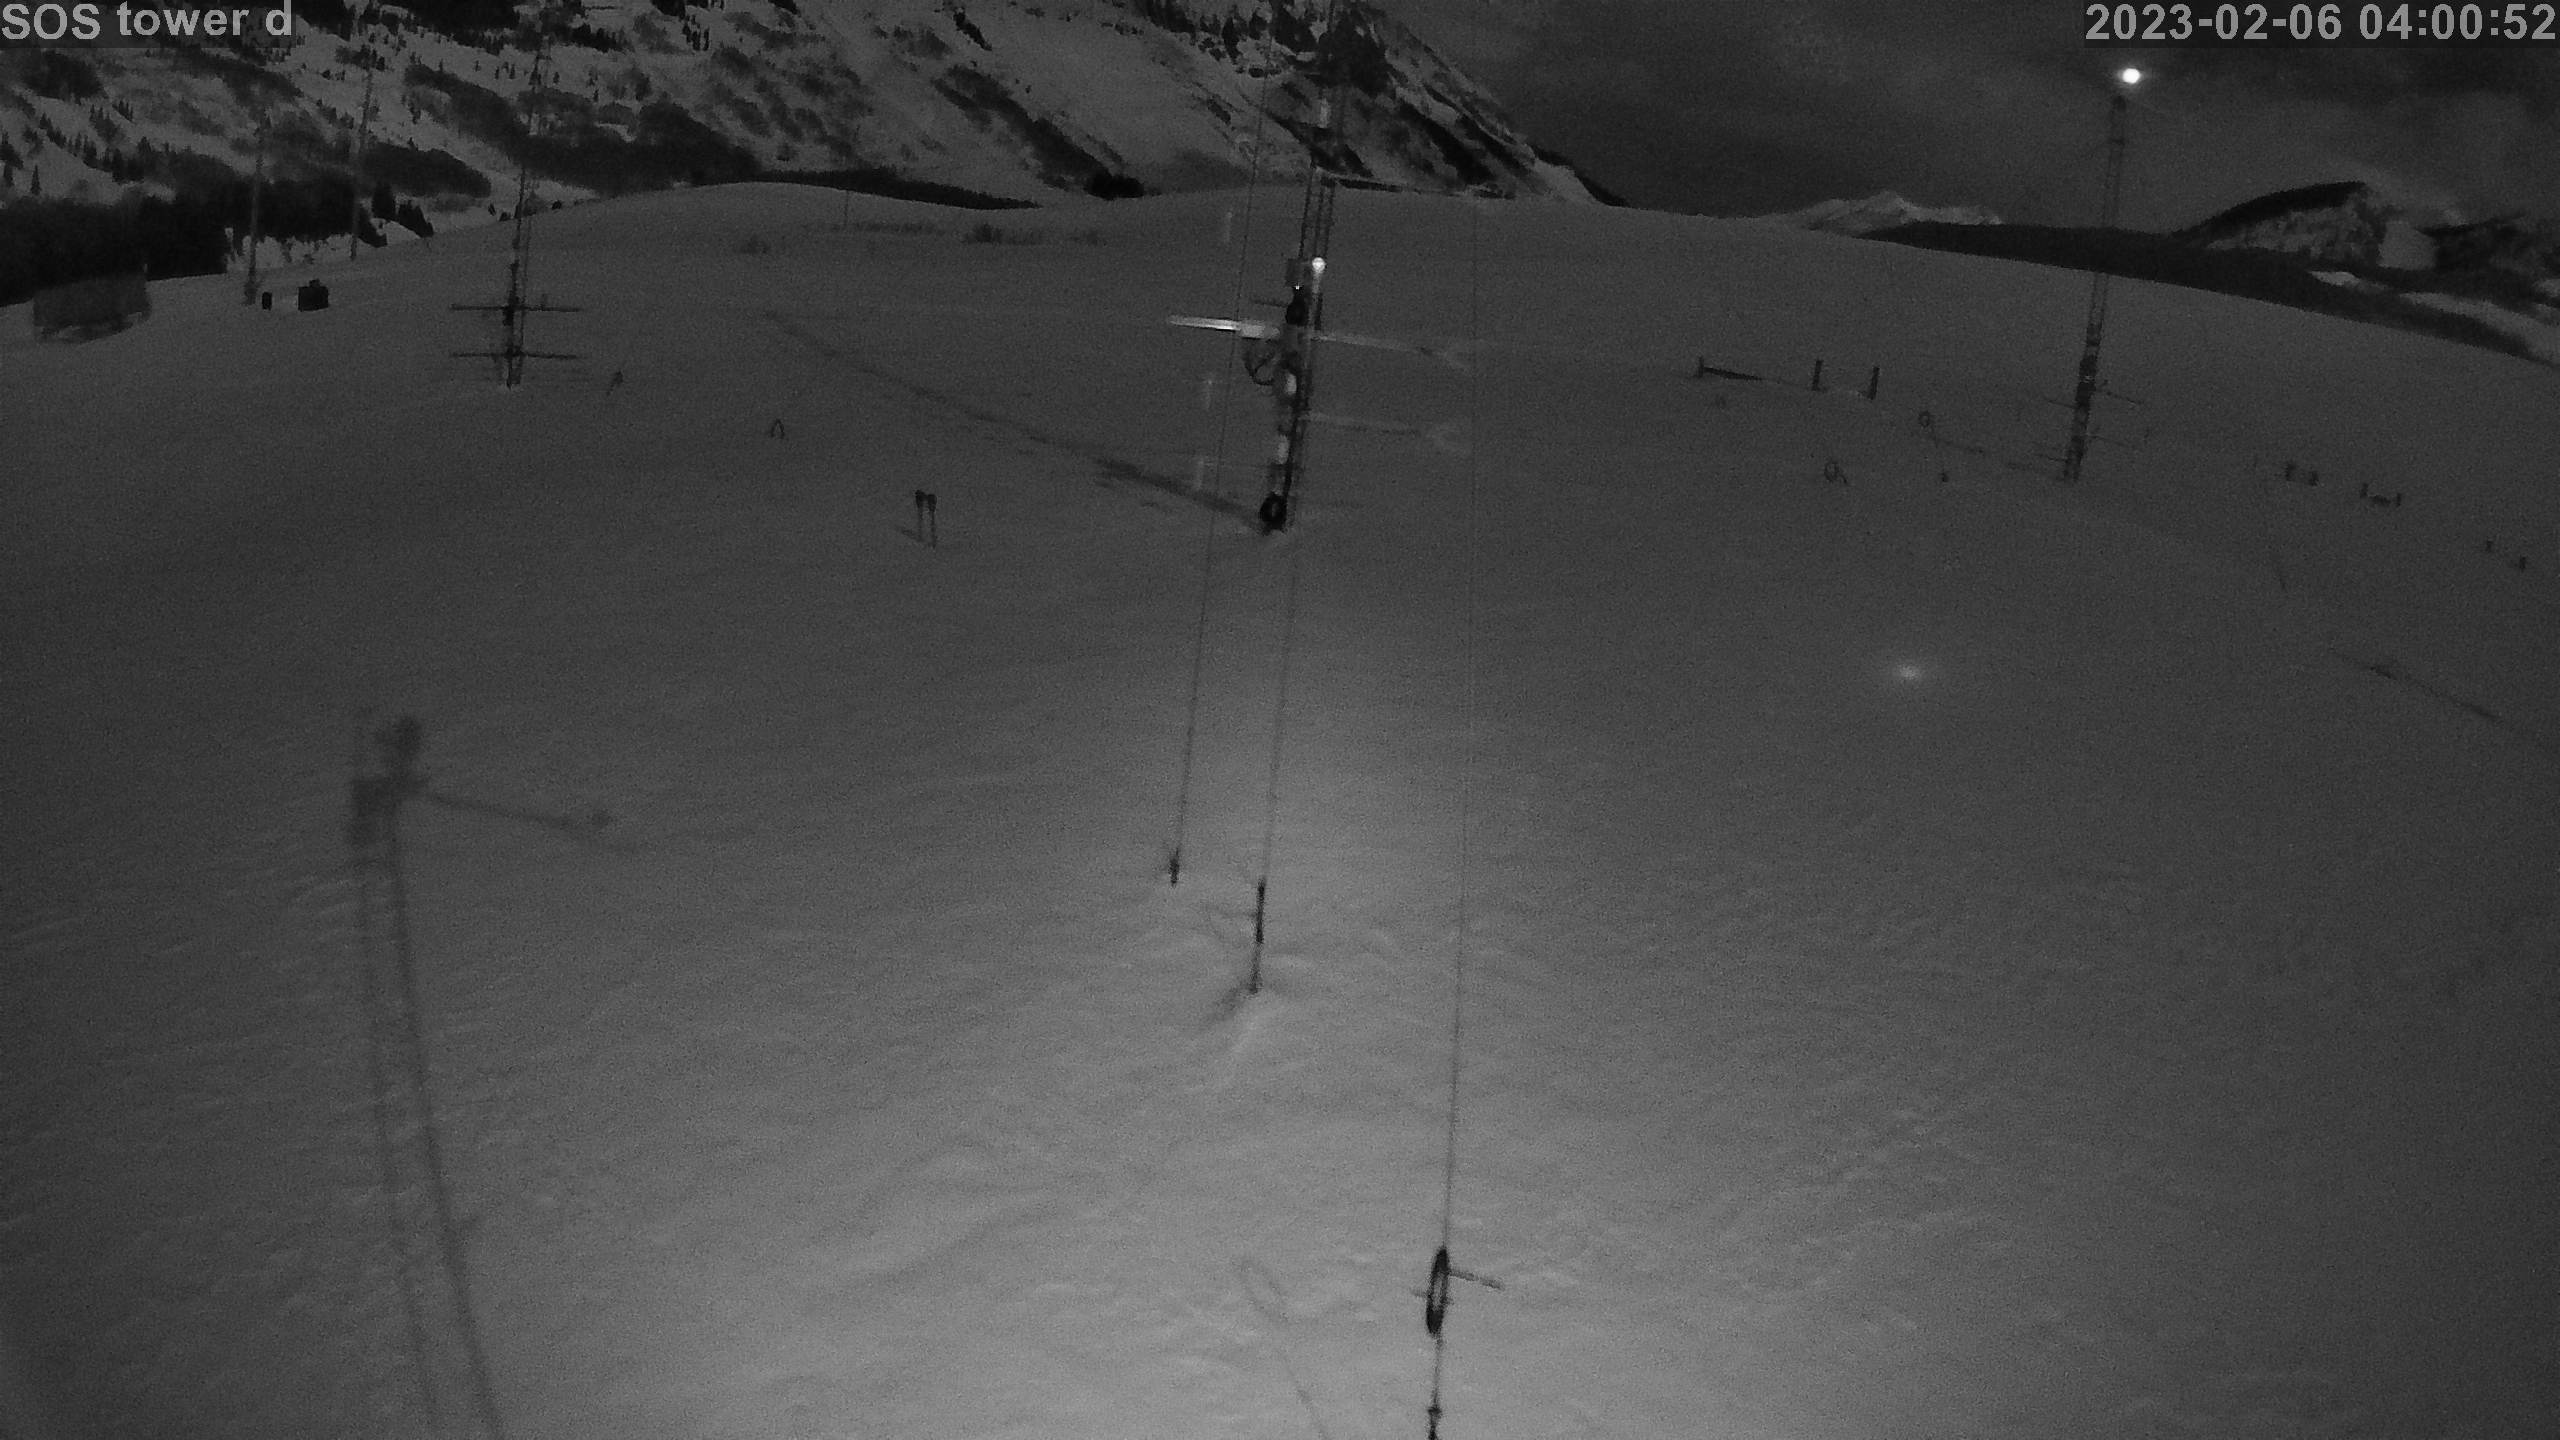
|
photo 2023020605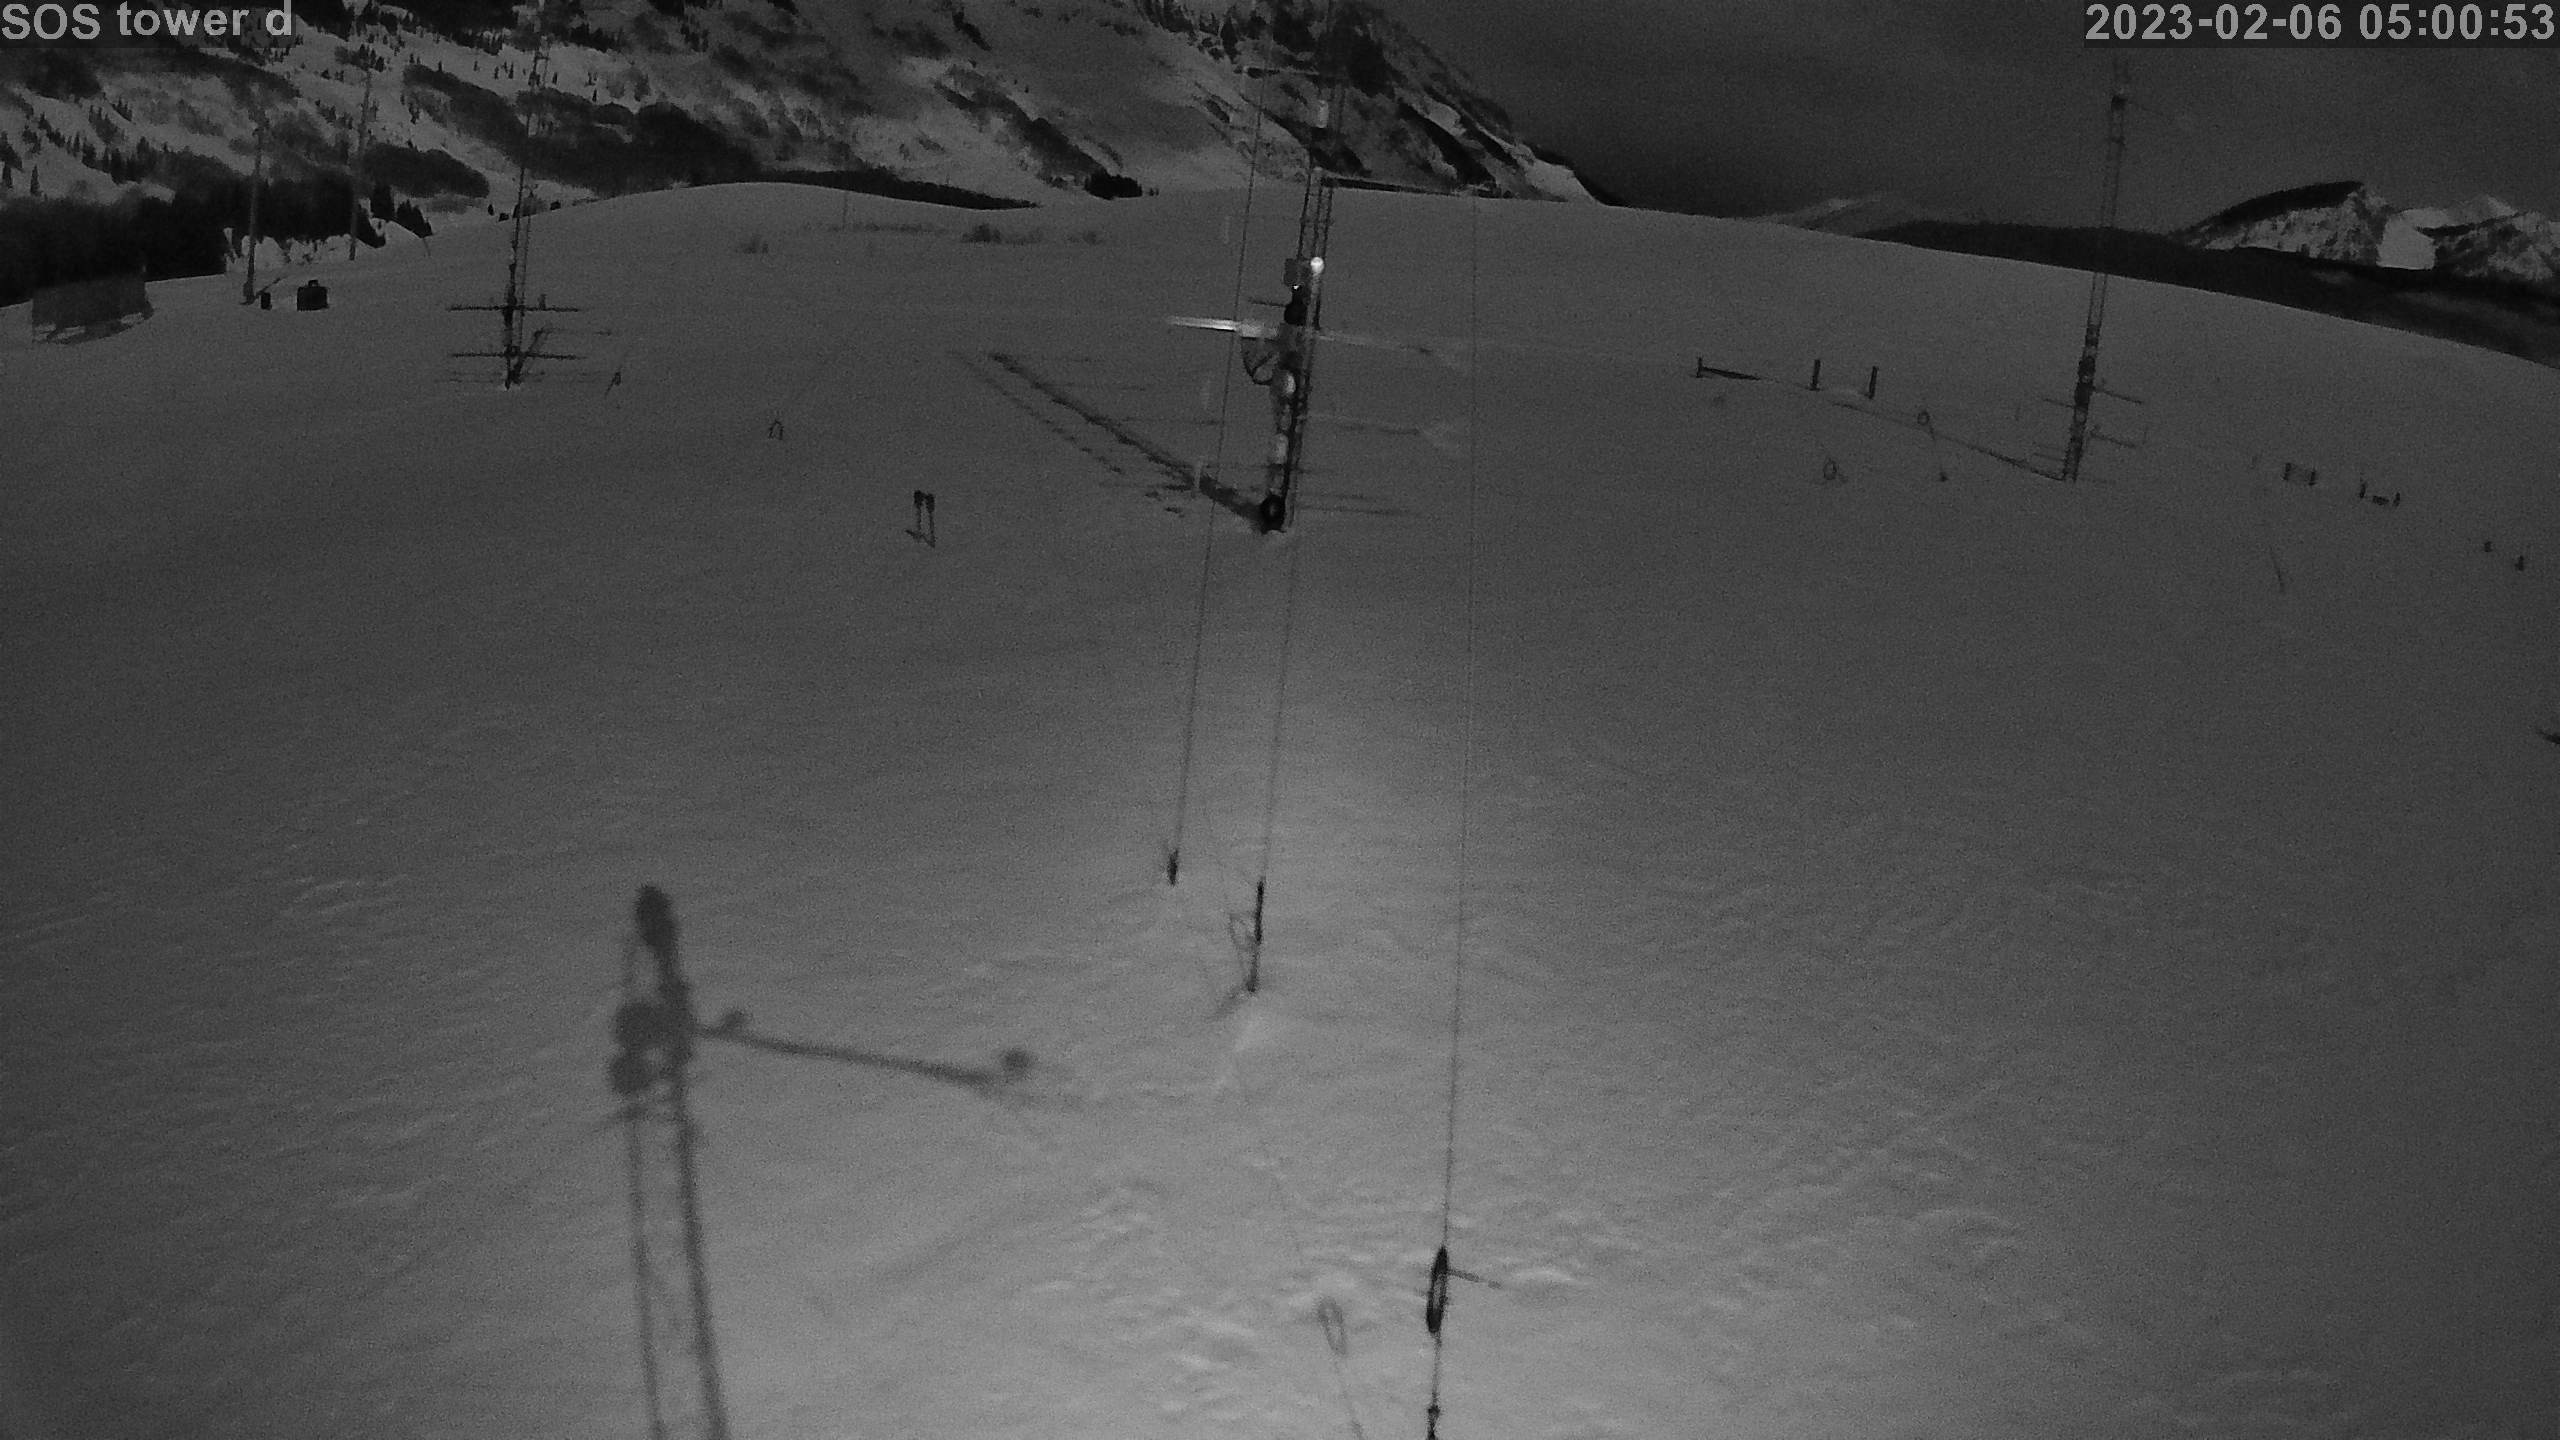
|
photo 2023020606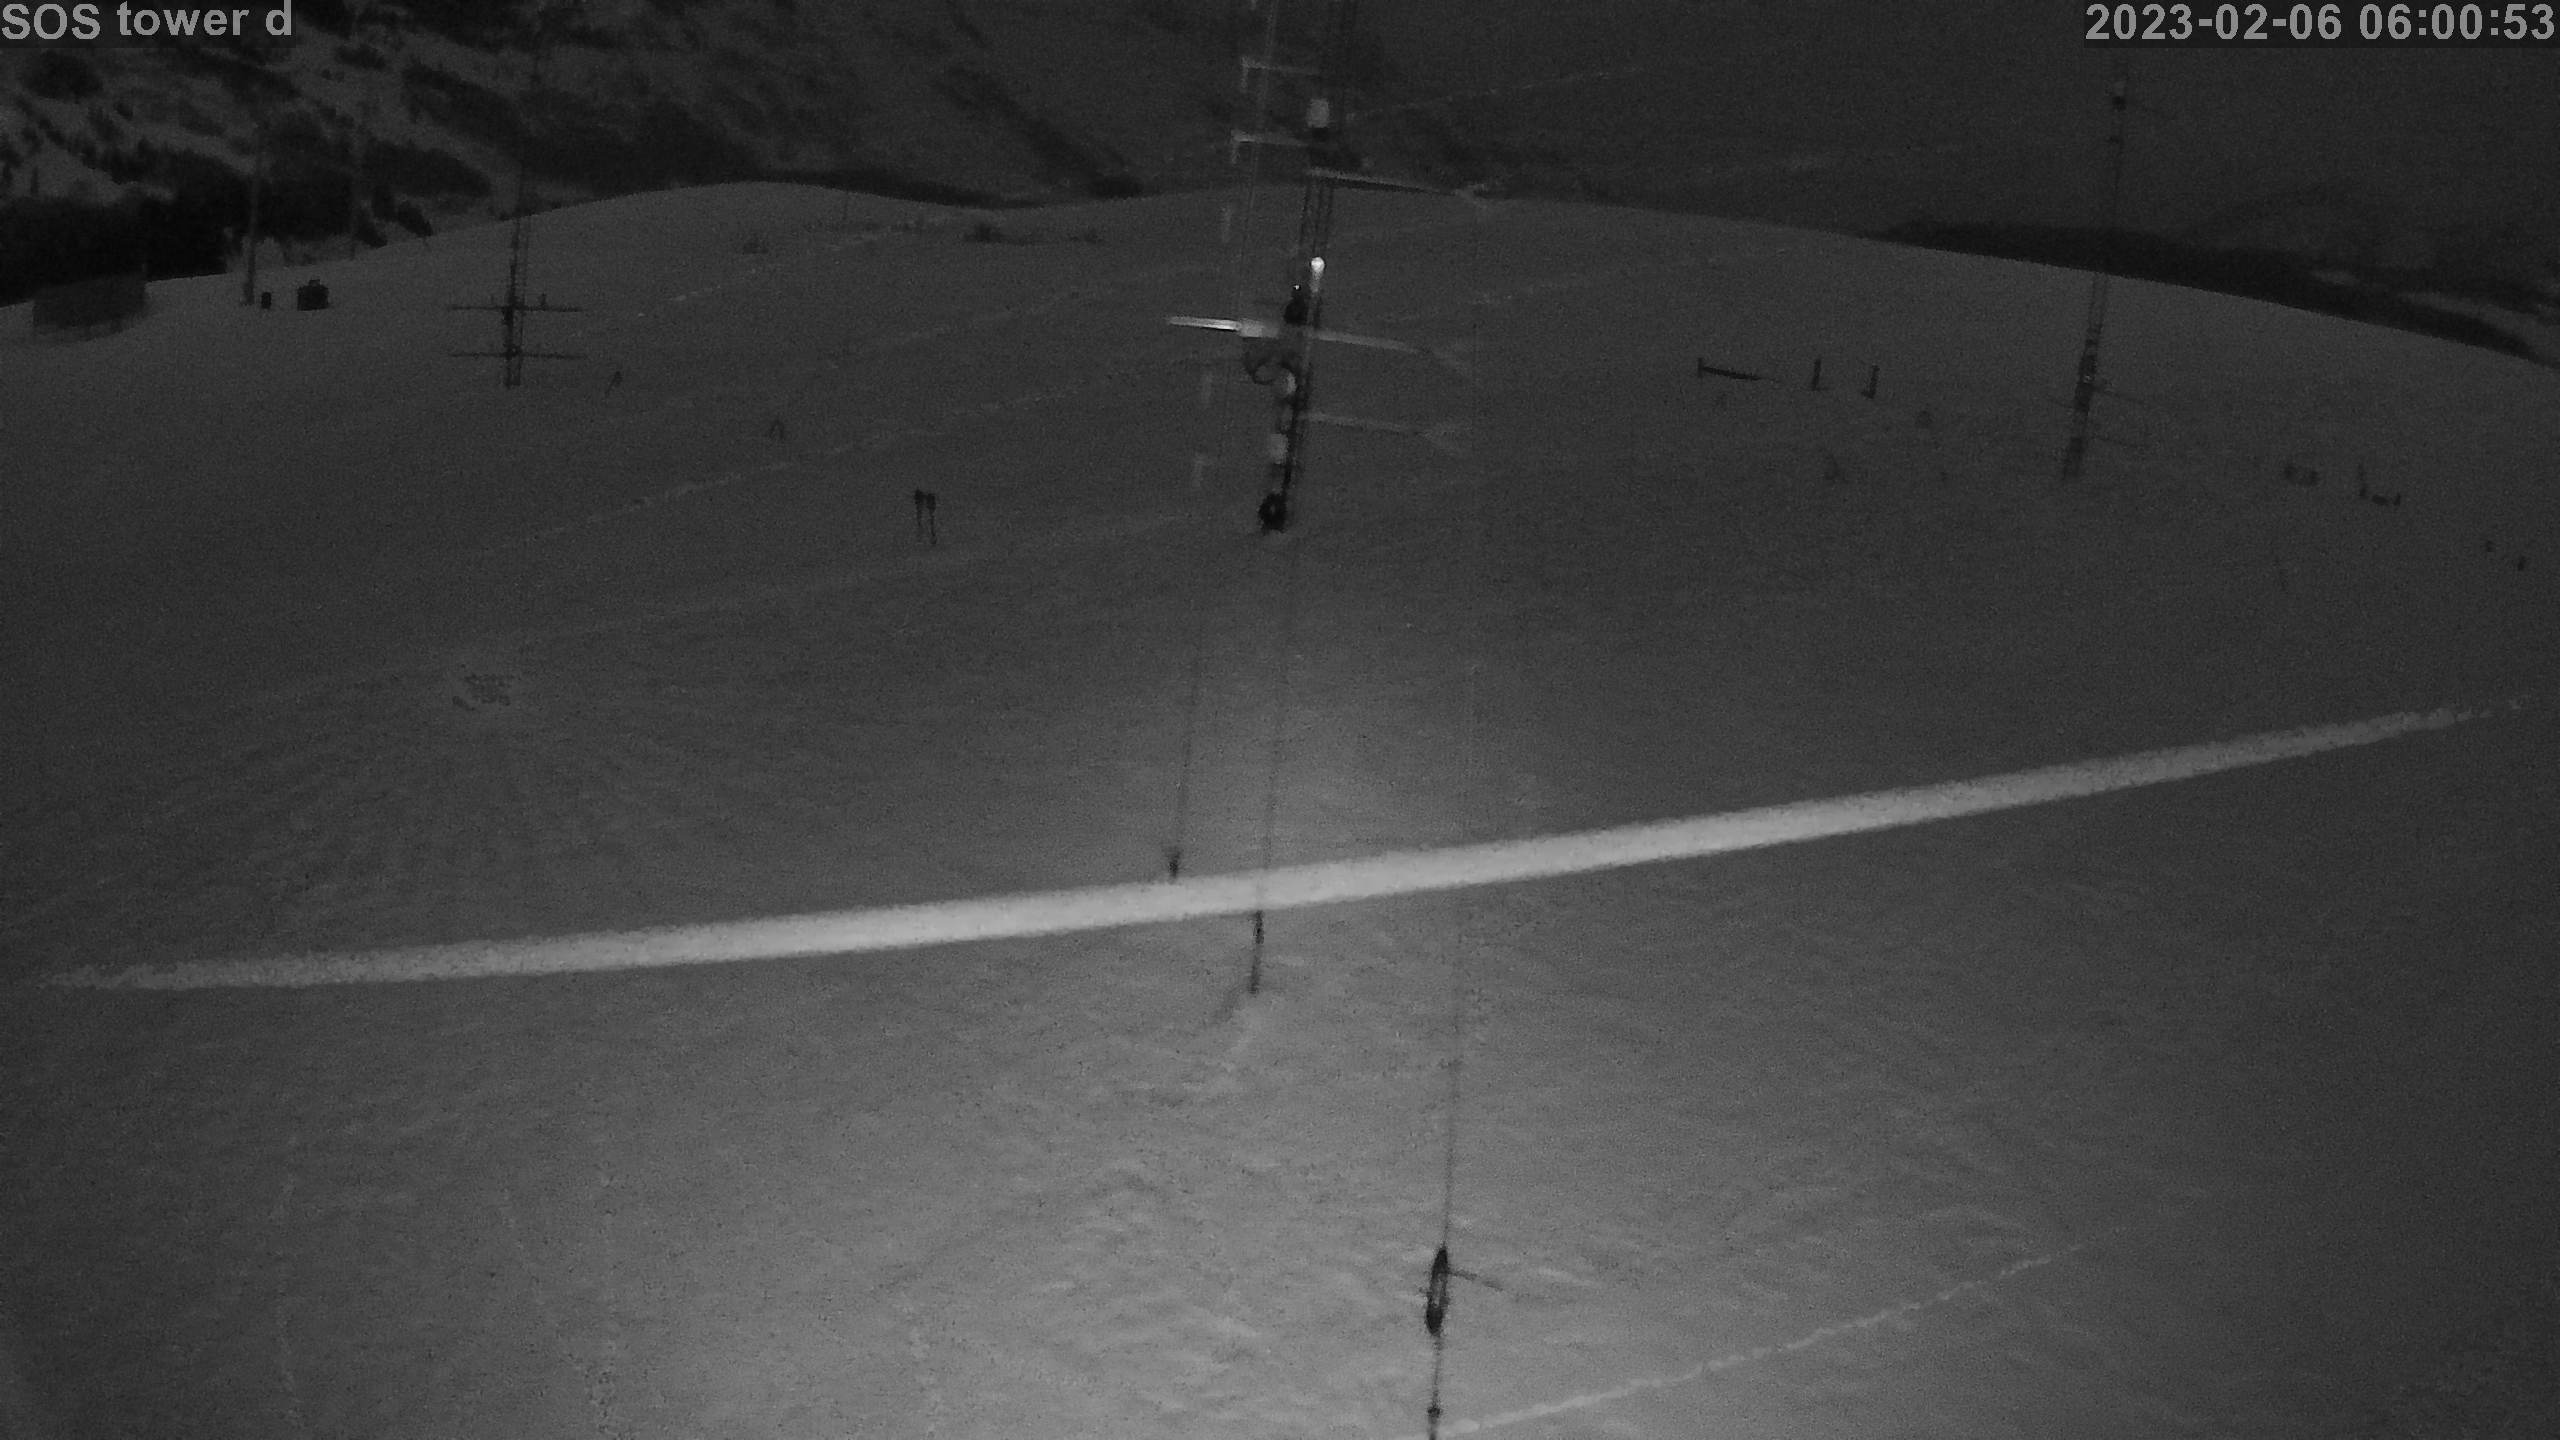
|
photo 2023020607
|
photo 2023020608
|
photo 2023020609
|
photo 2023020610
|
photo 2023020611
|
photo 2023020612
|
photo 2023020613
|
photo 2023020614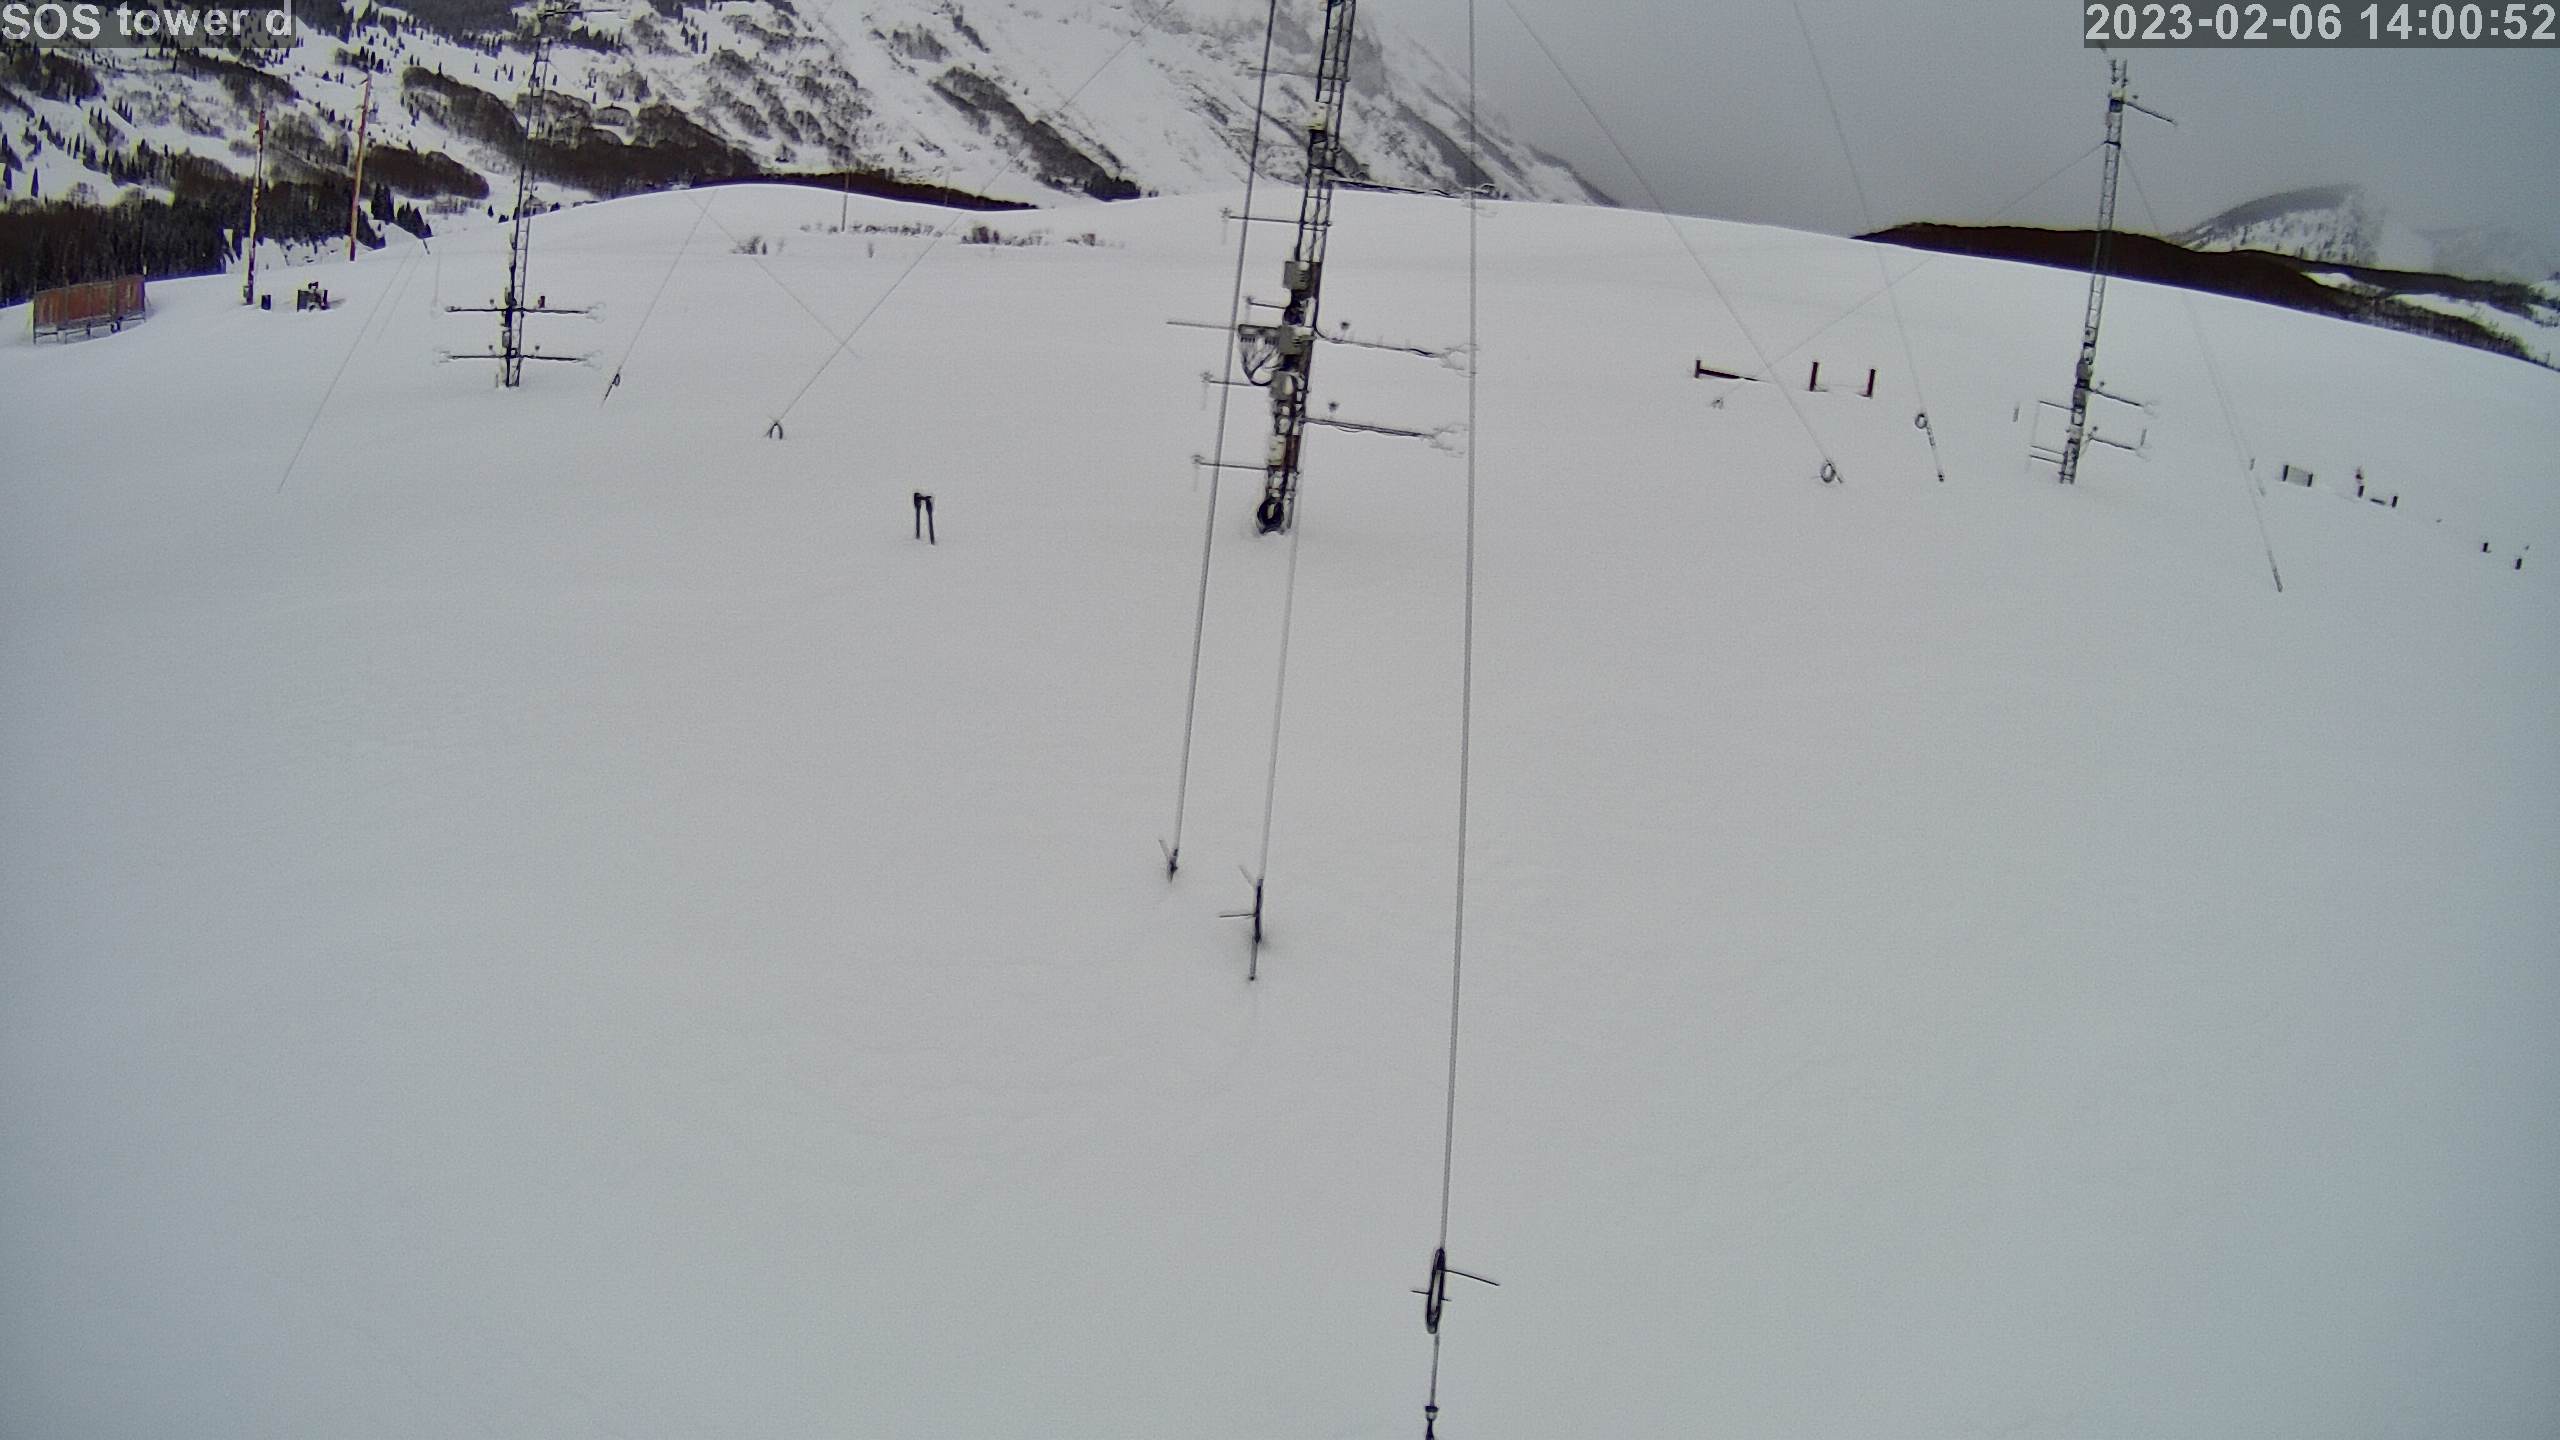
|
photo 2023020615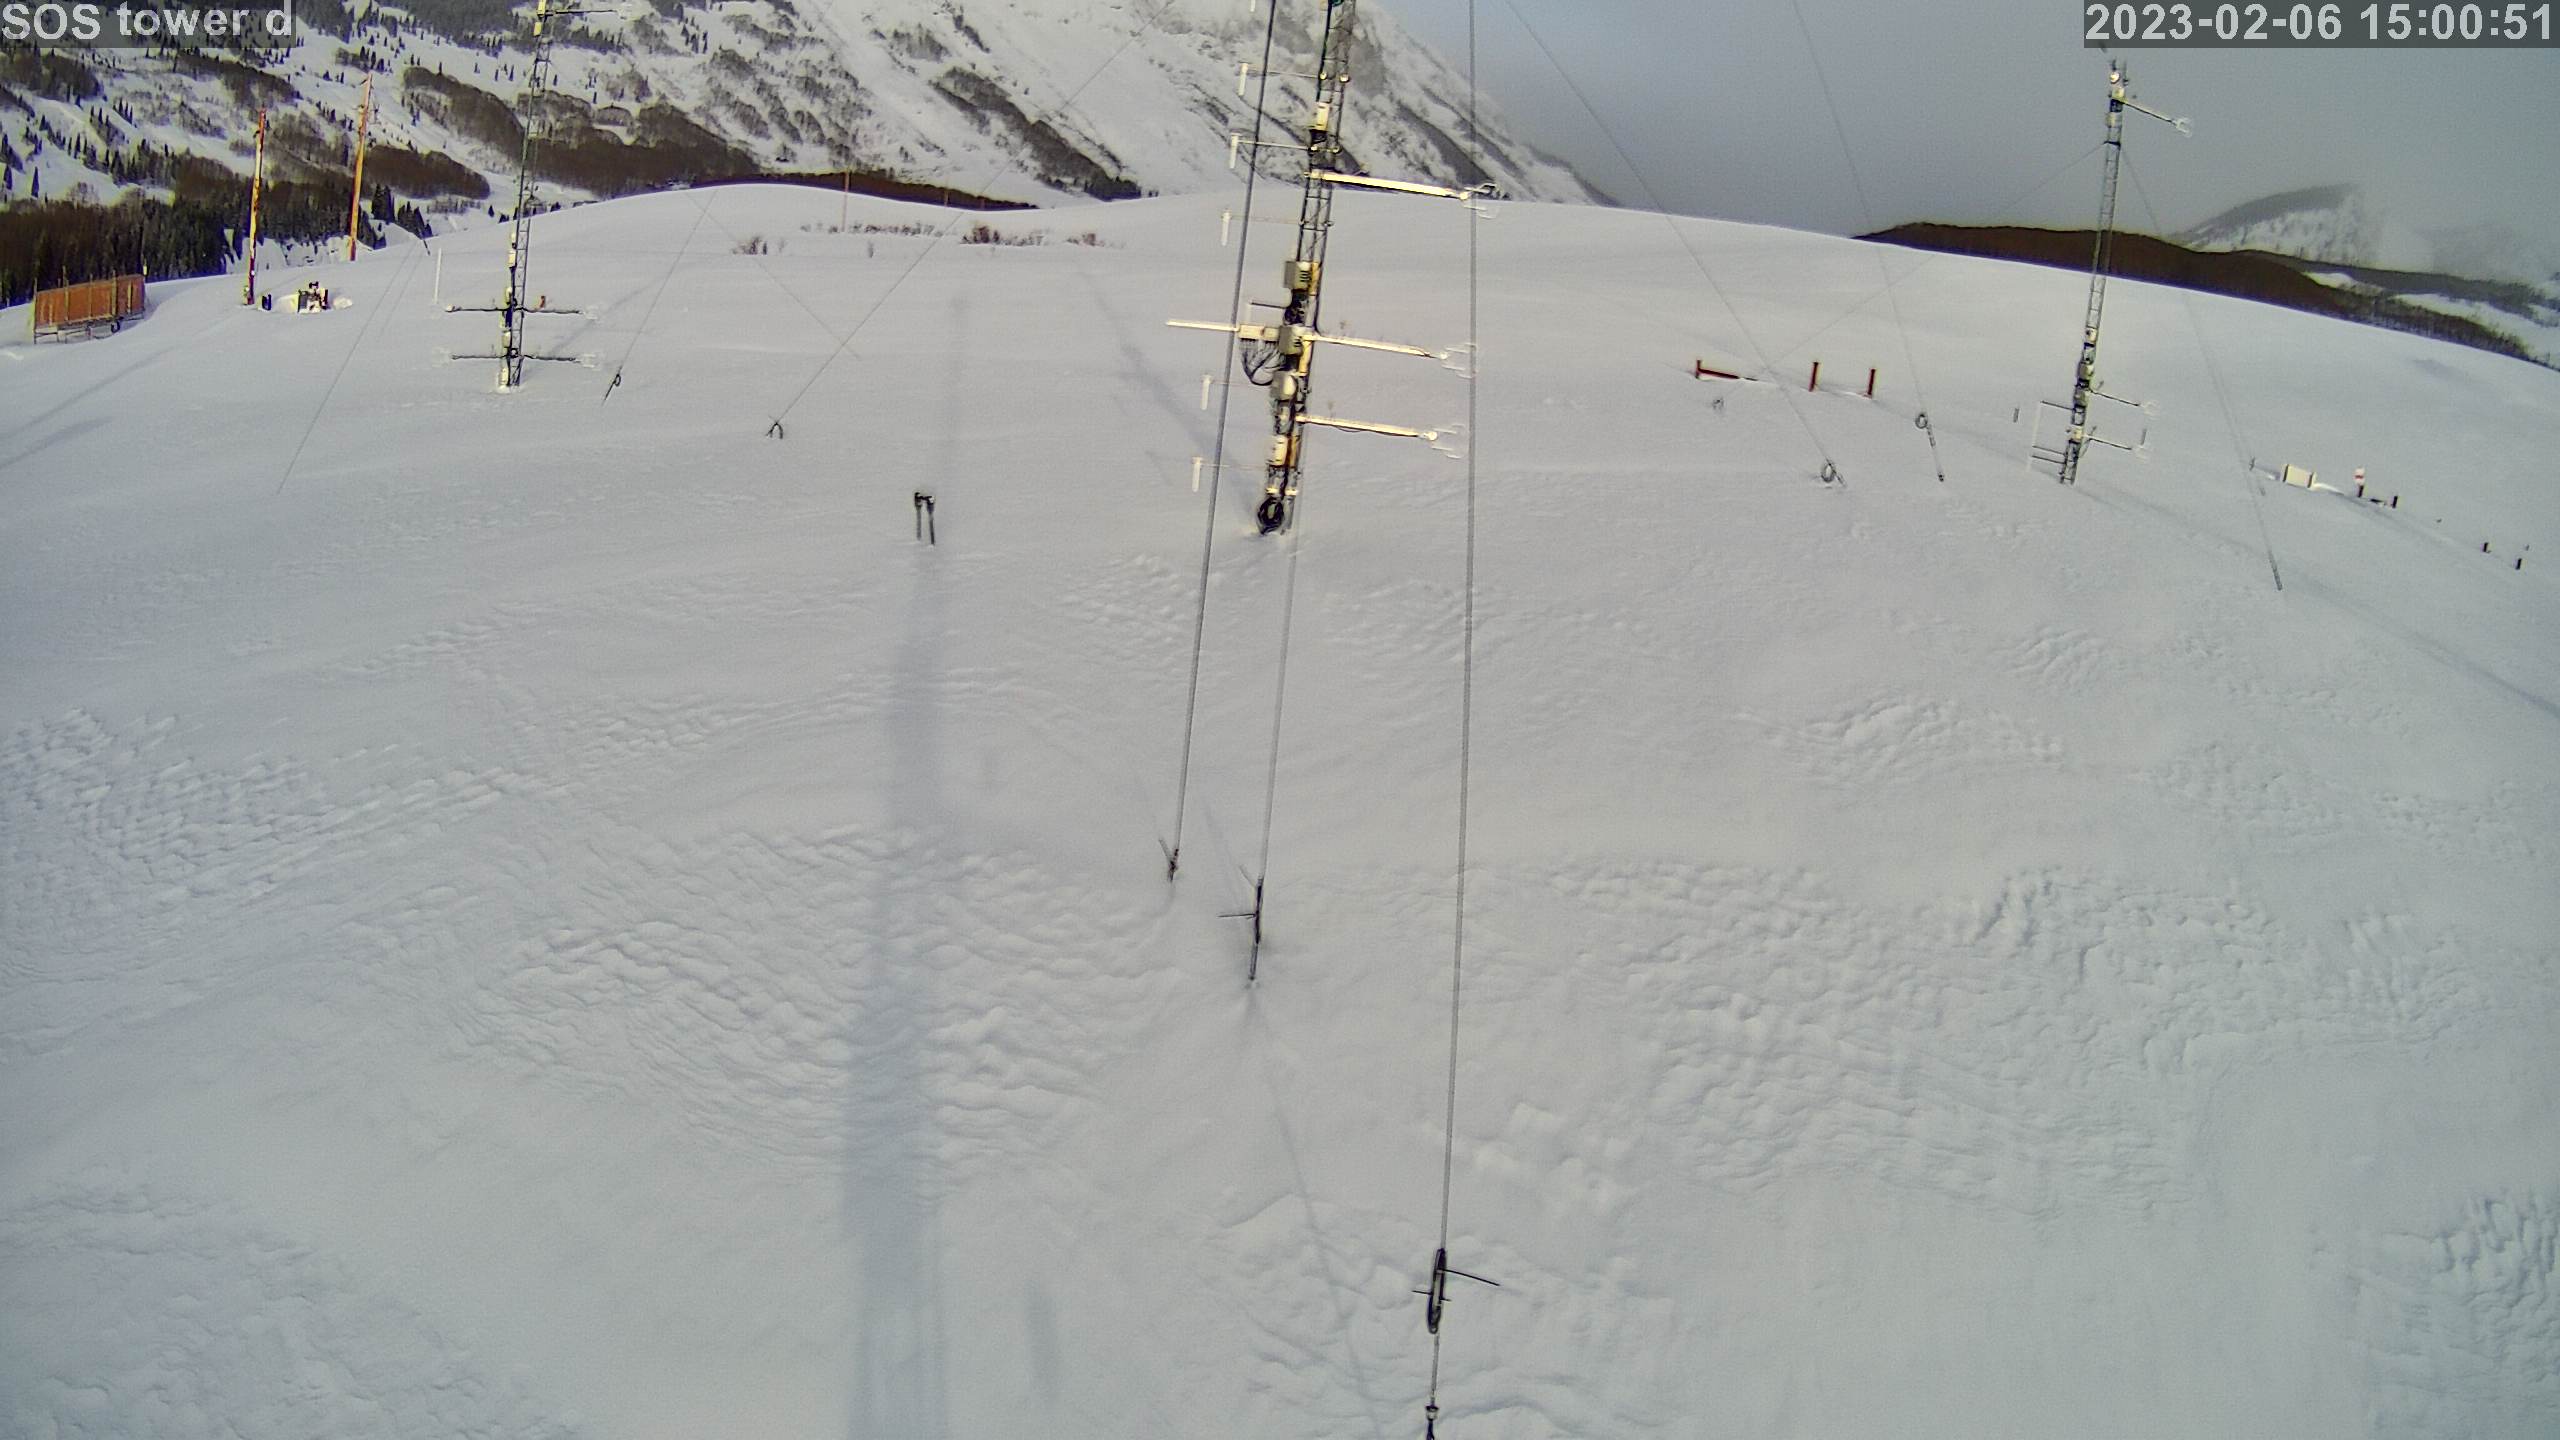
|
photo 2023020616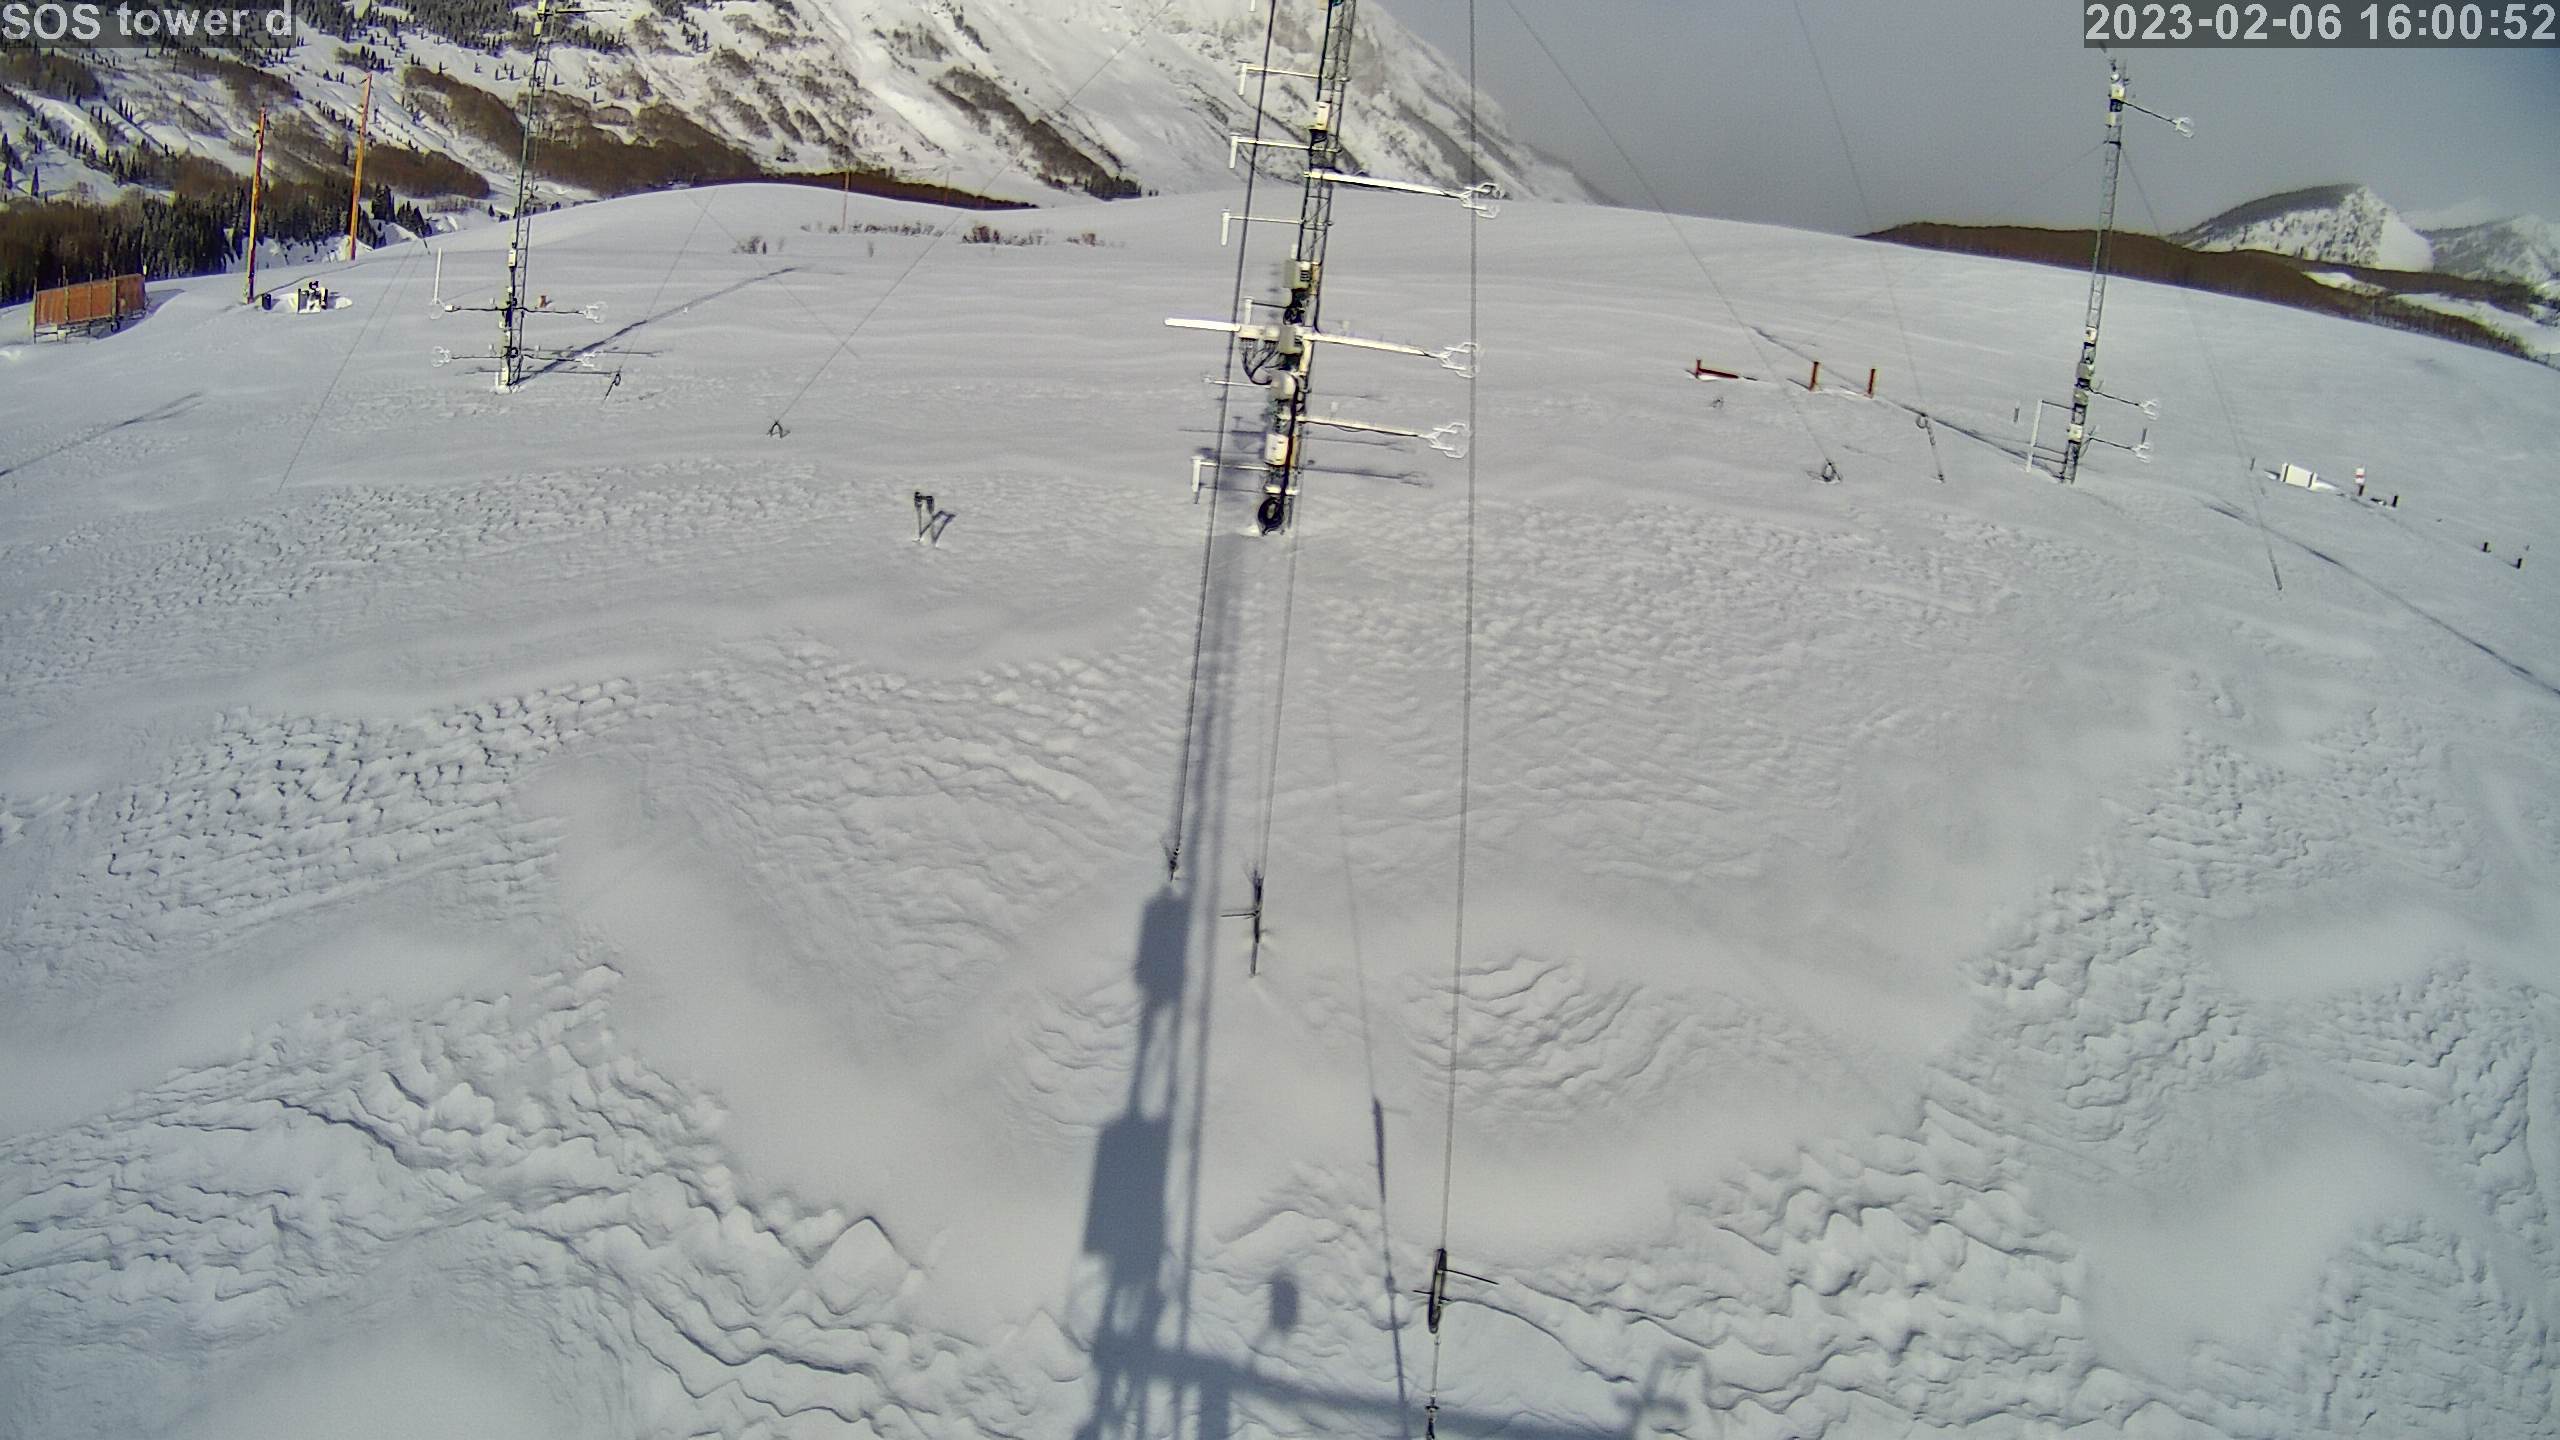
|
photo 2023020617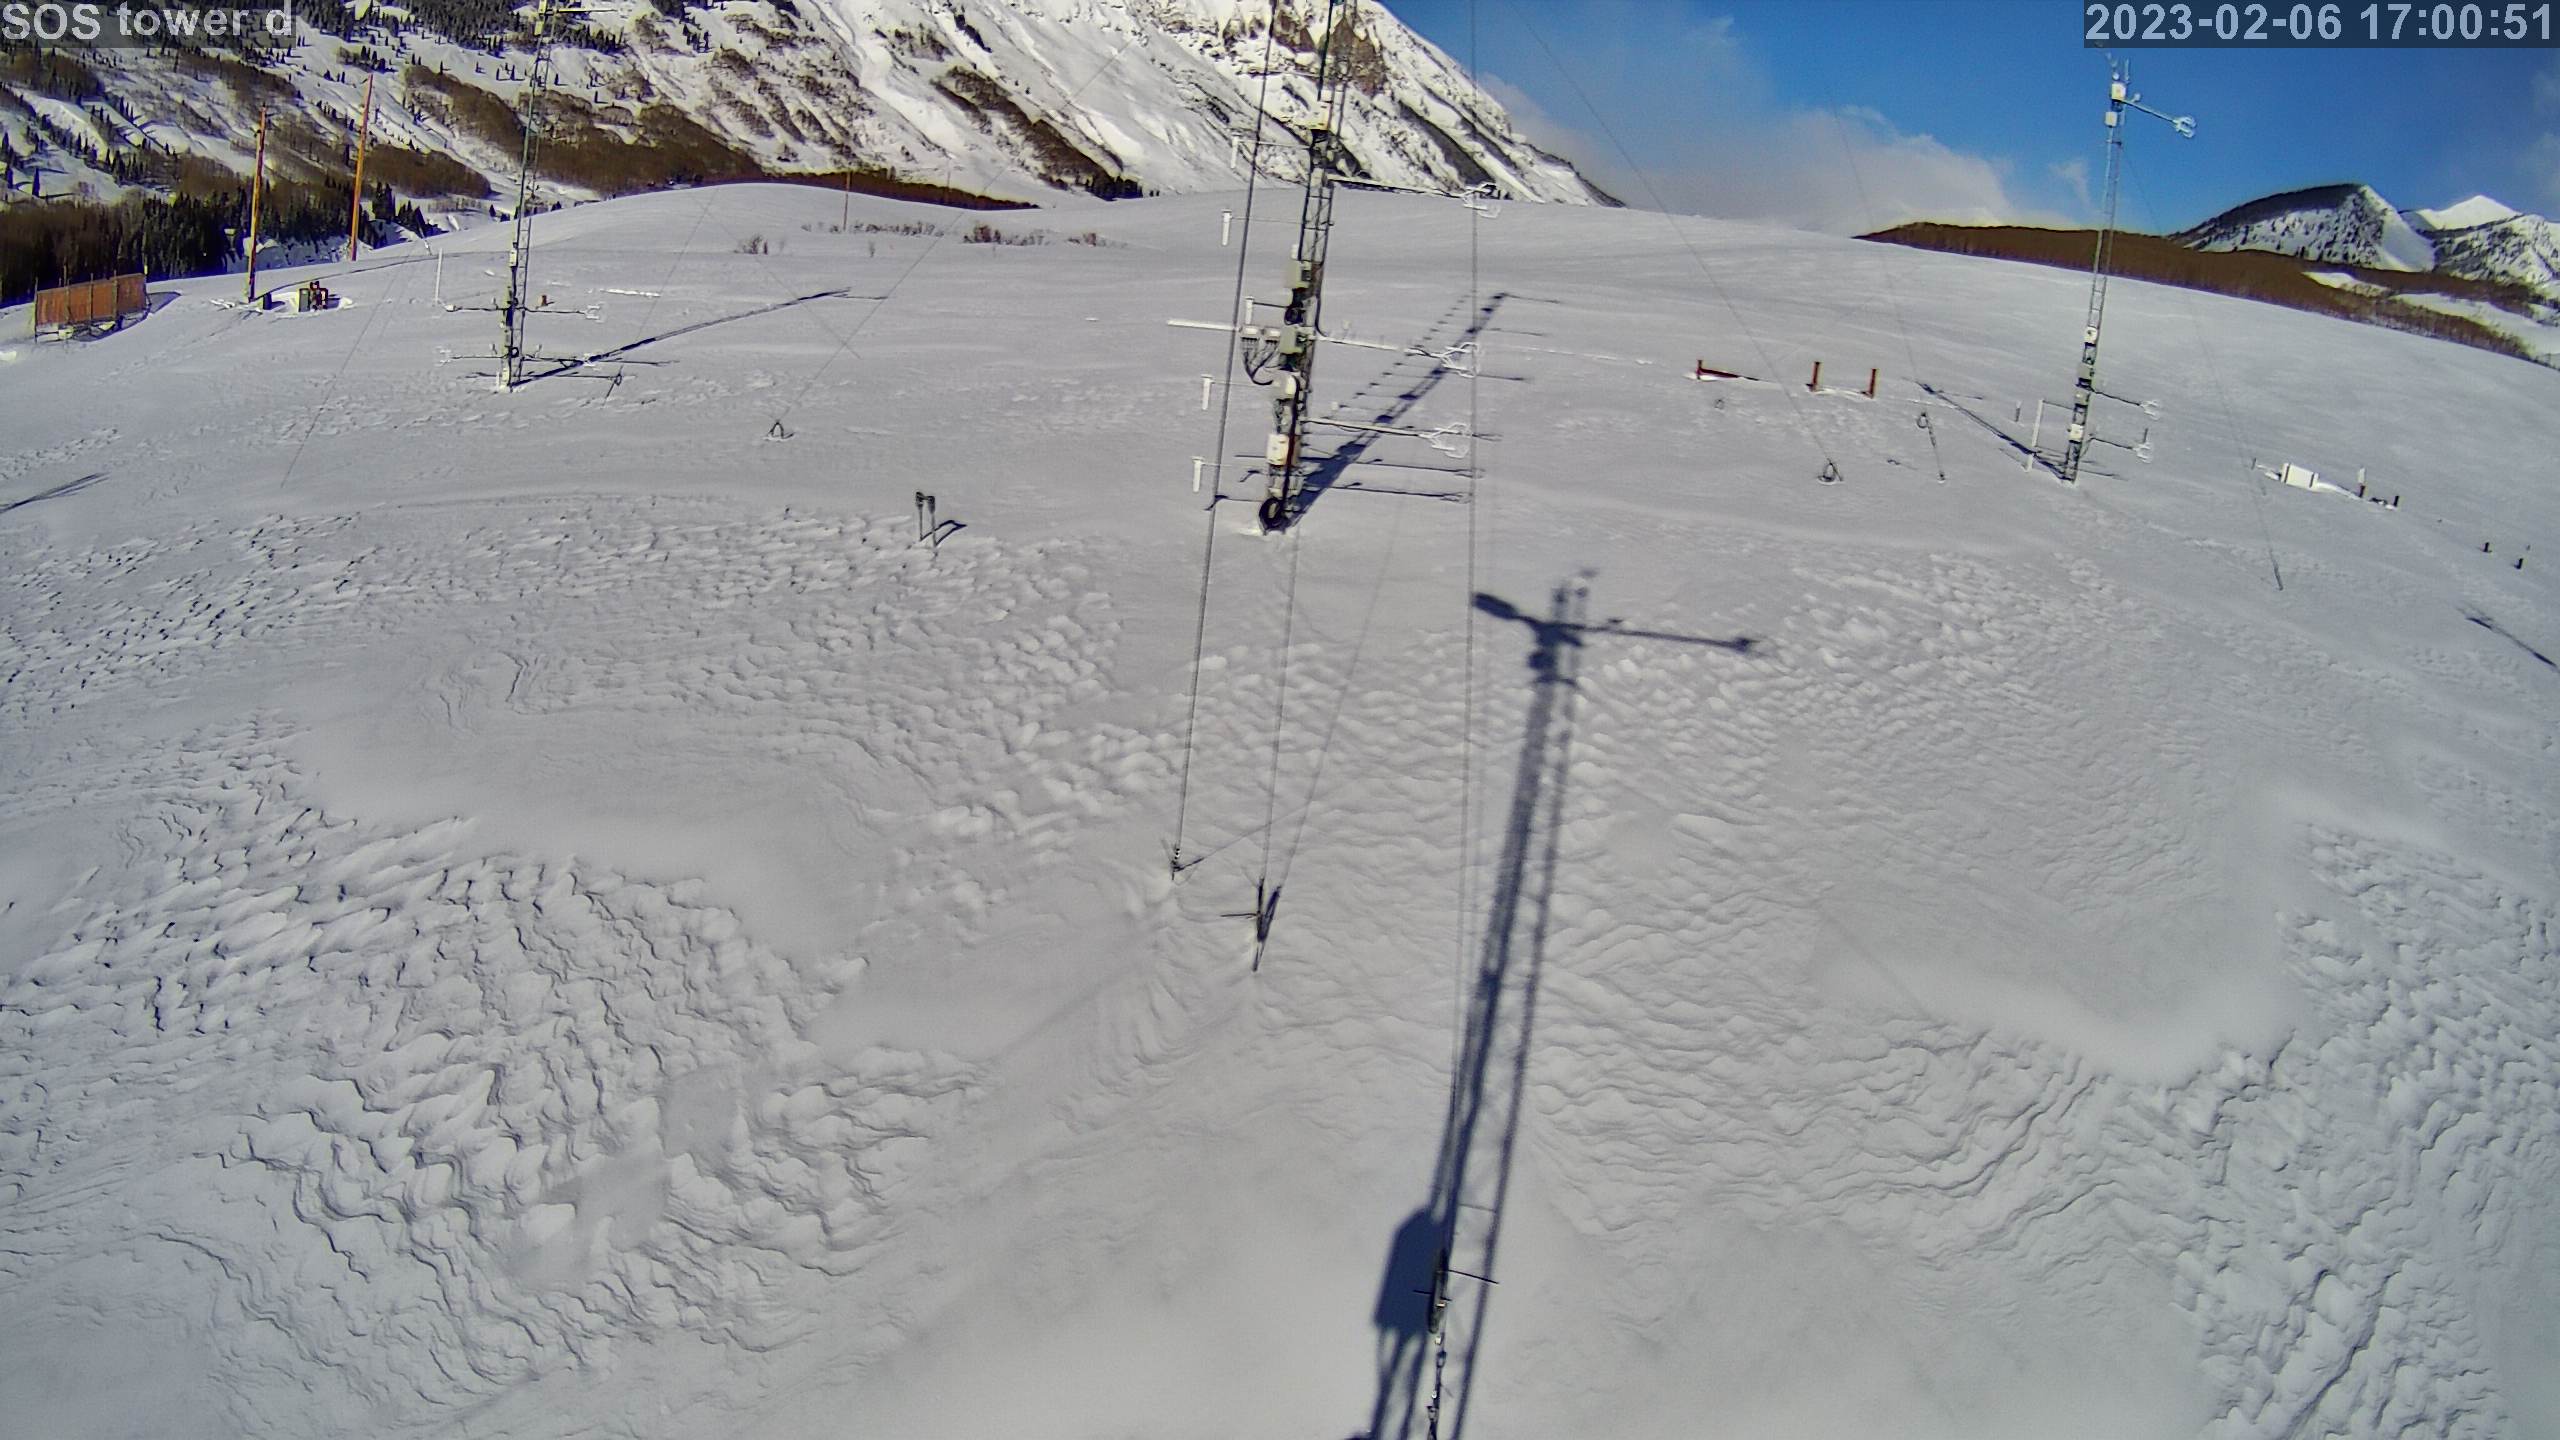
|
photo 2023020618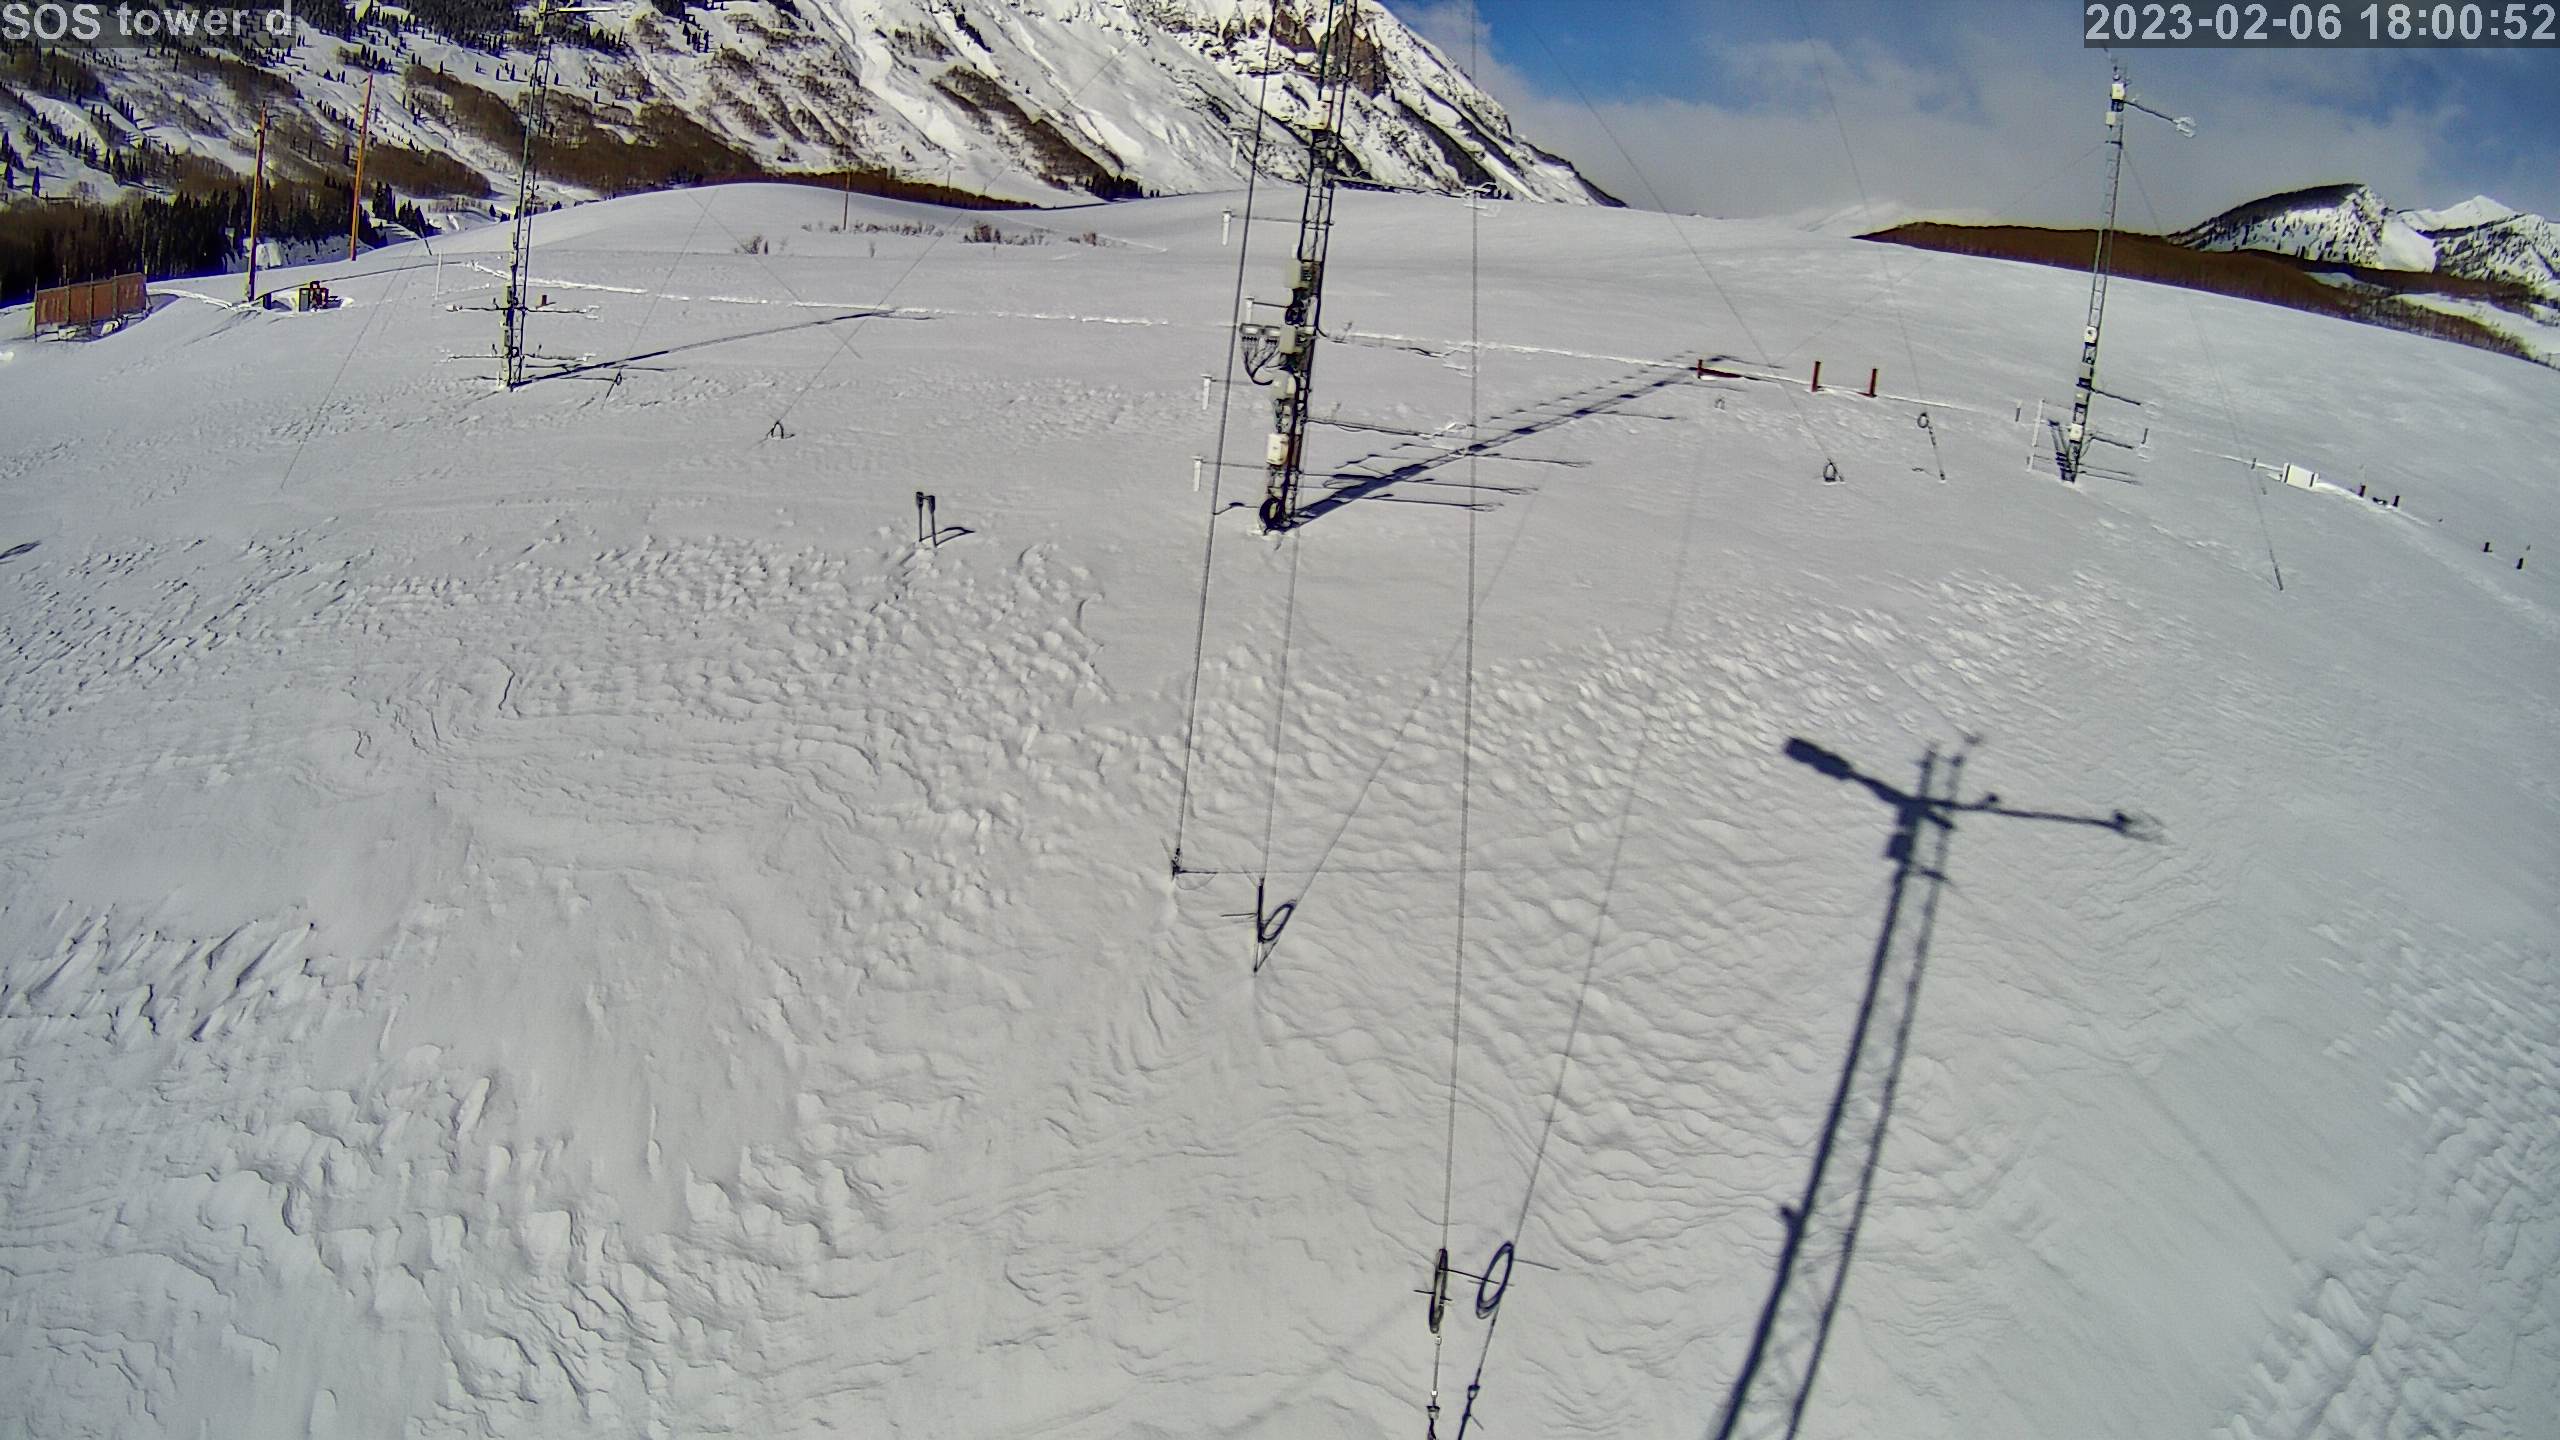
|
photo 2023020619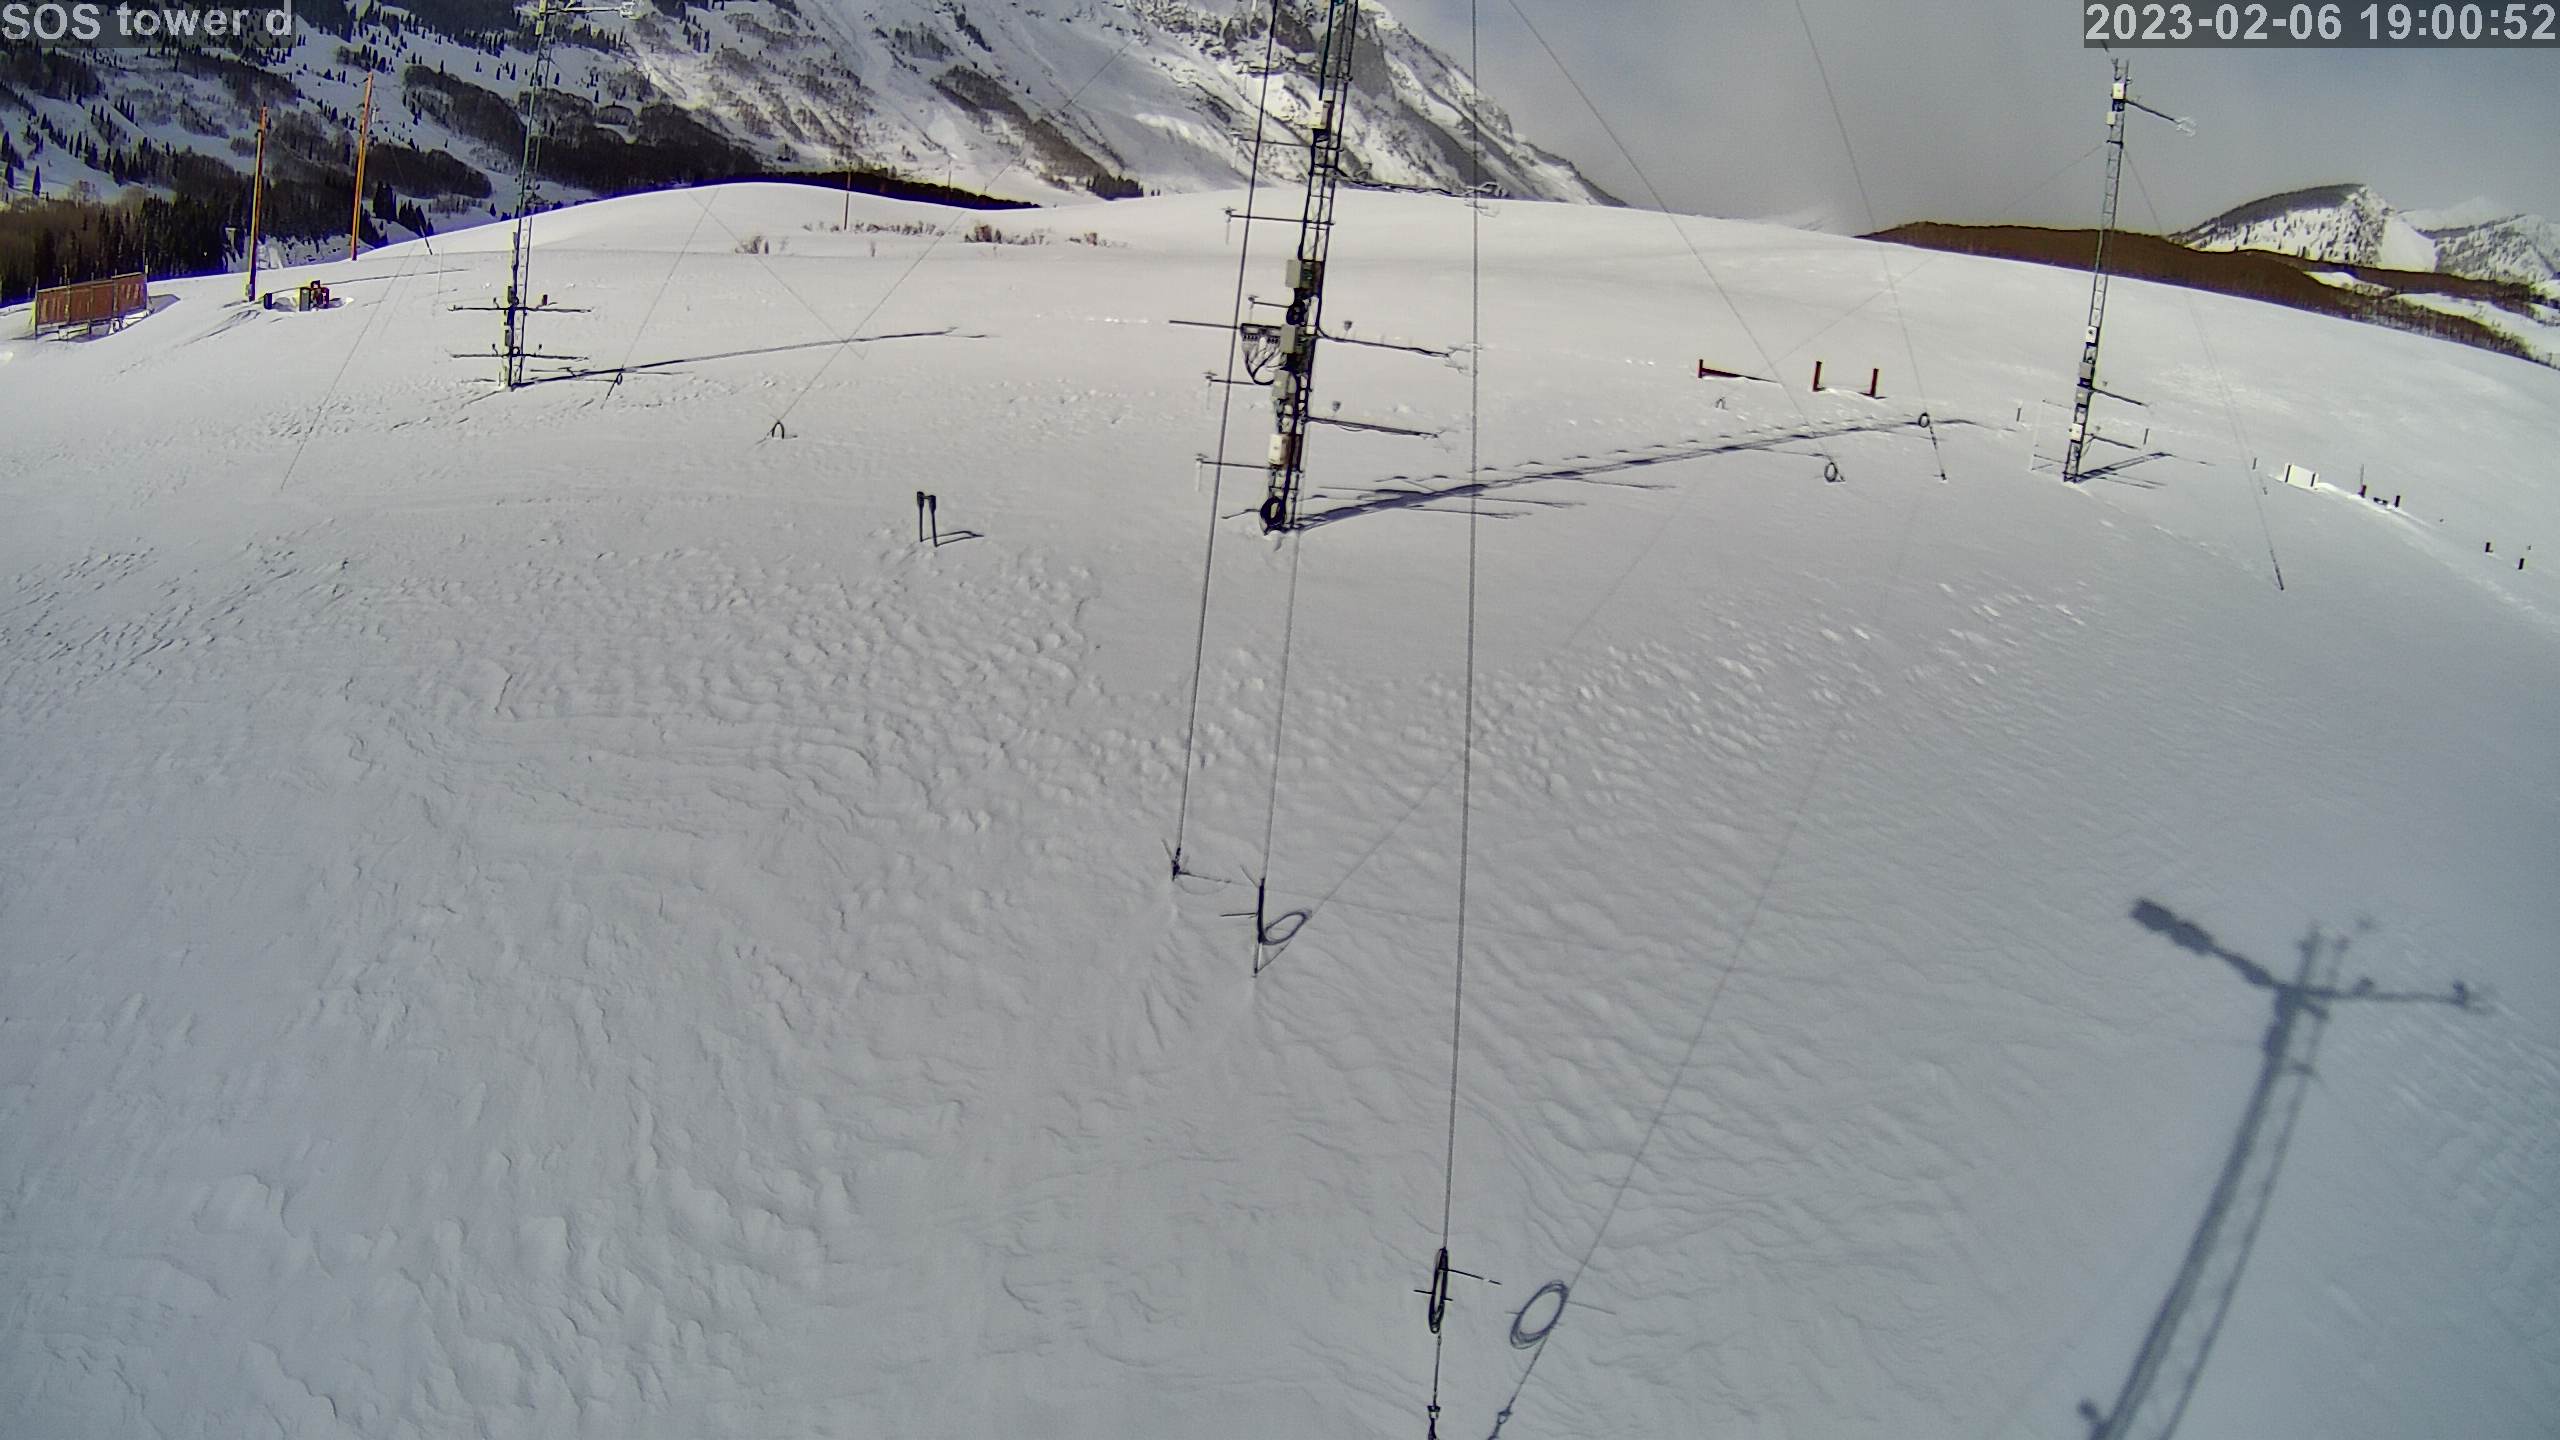
|
photo 2023020620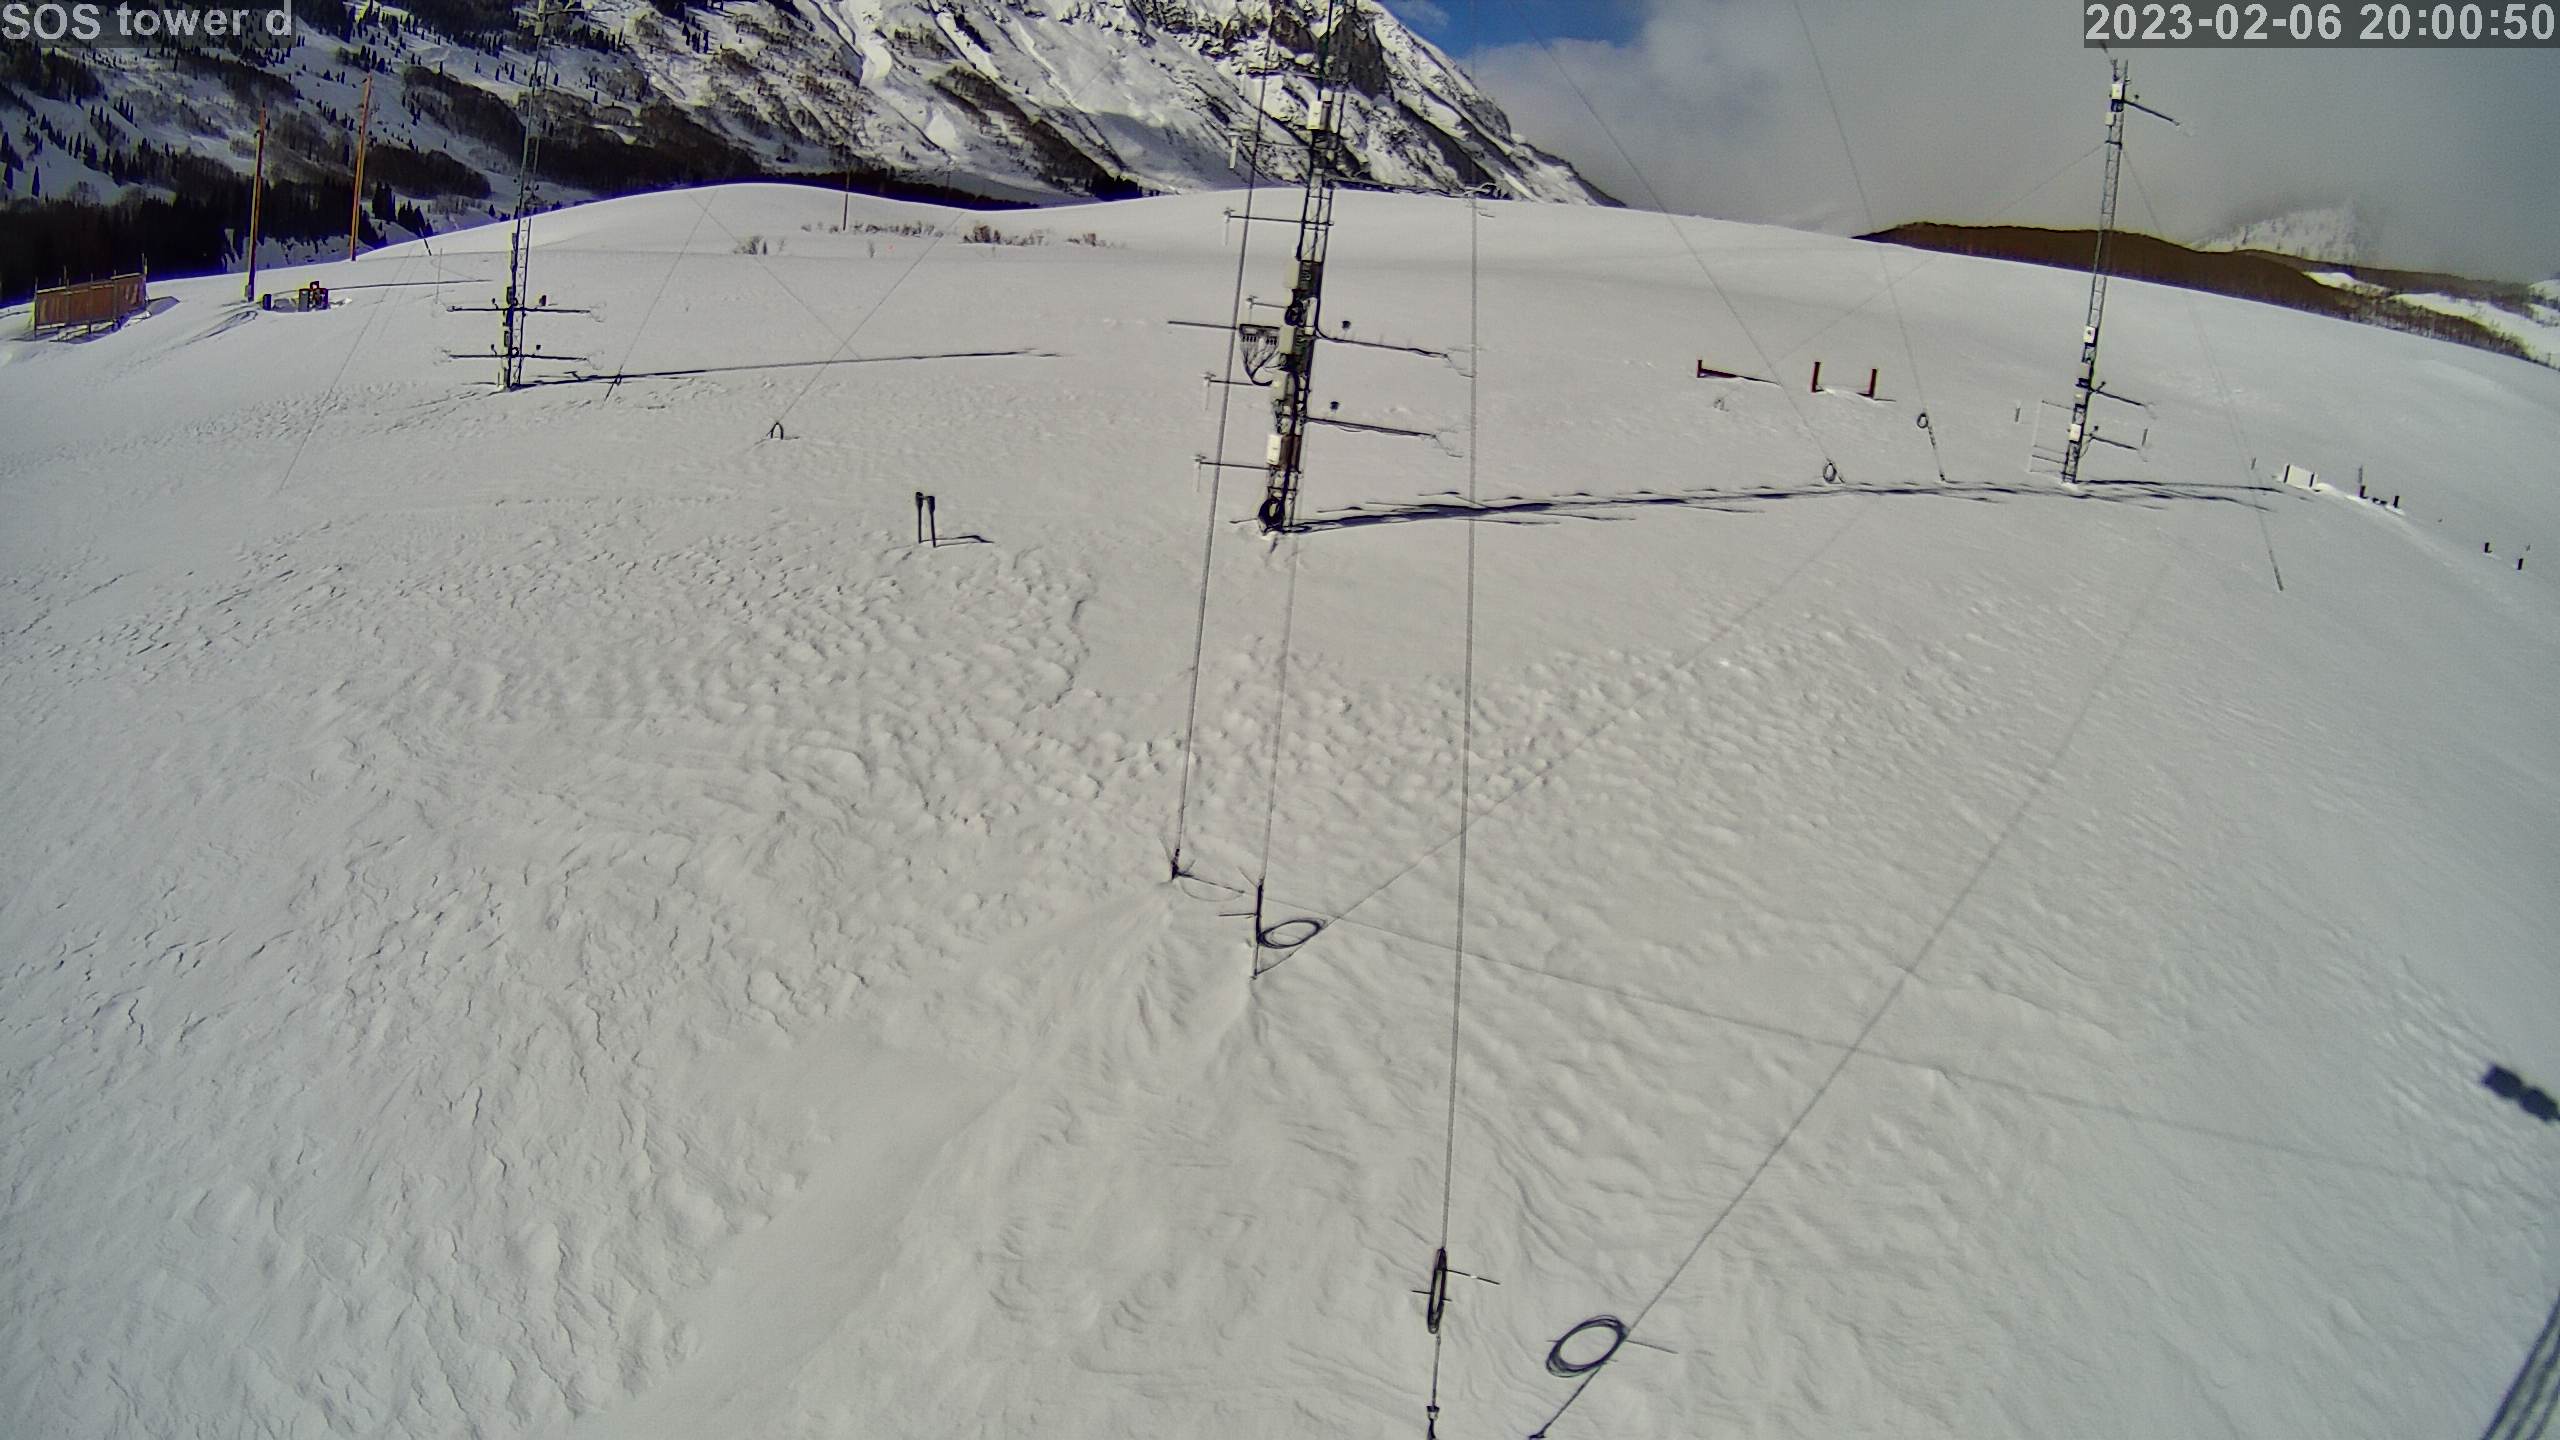
|
photo 2023020621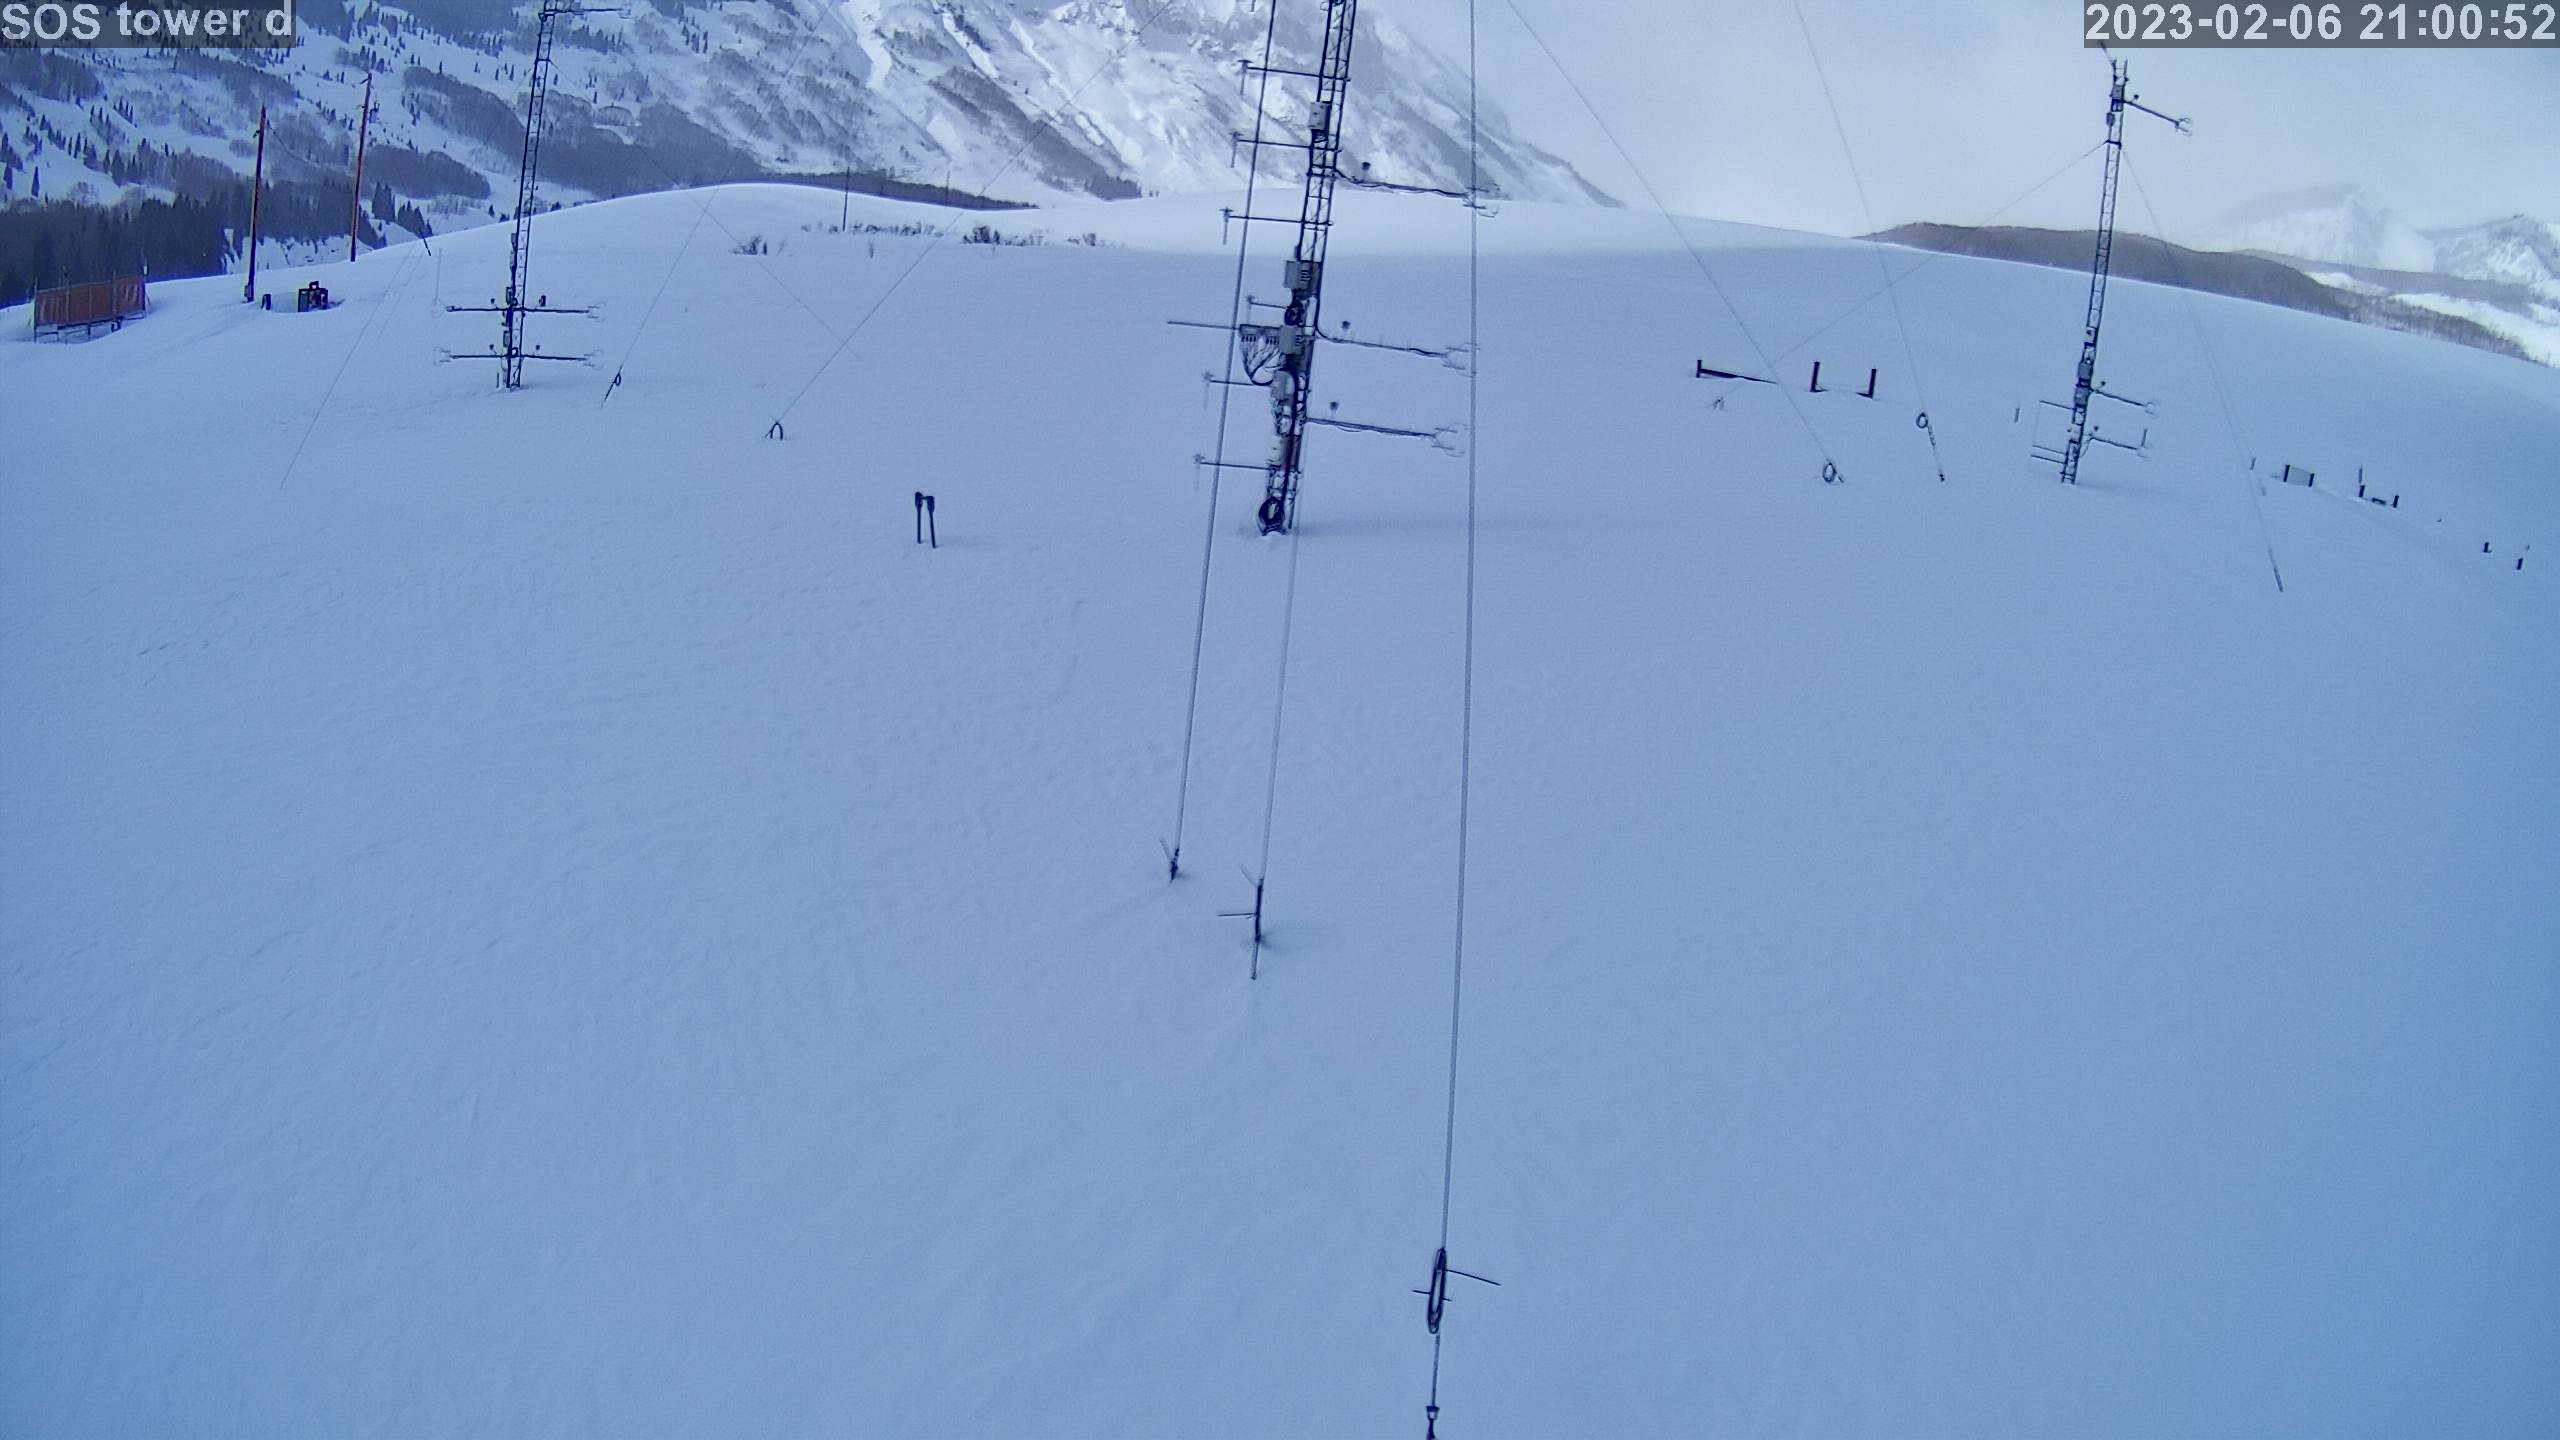
|
photo 2023020622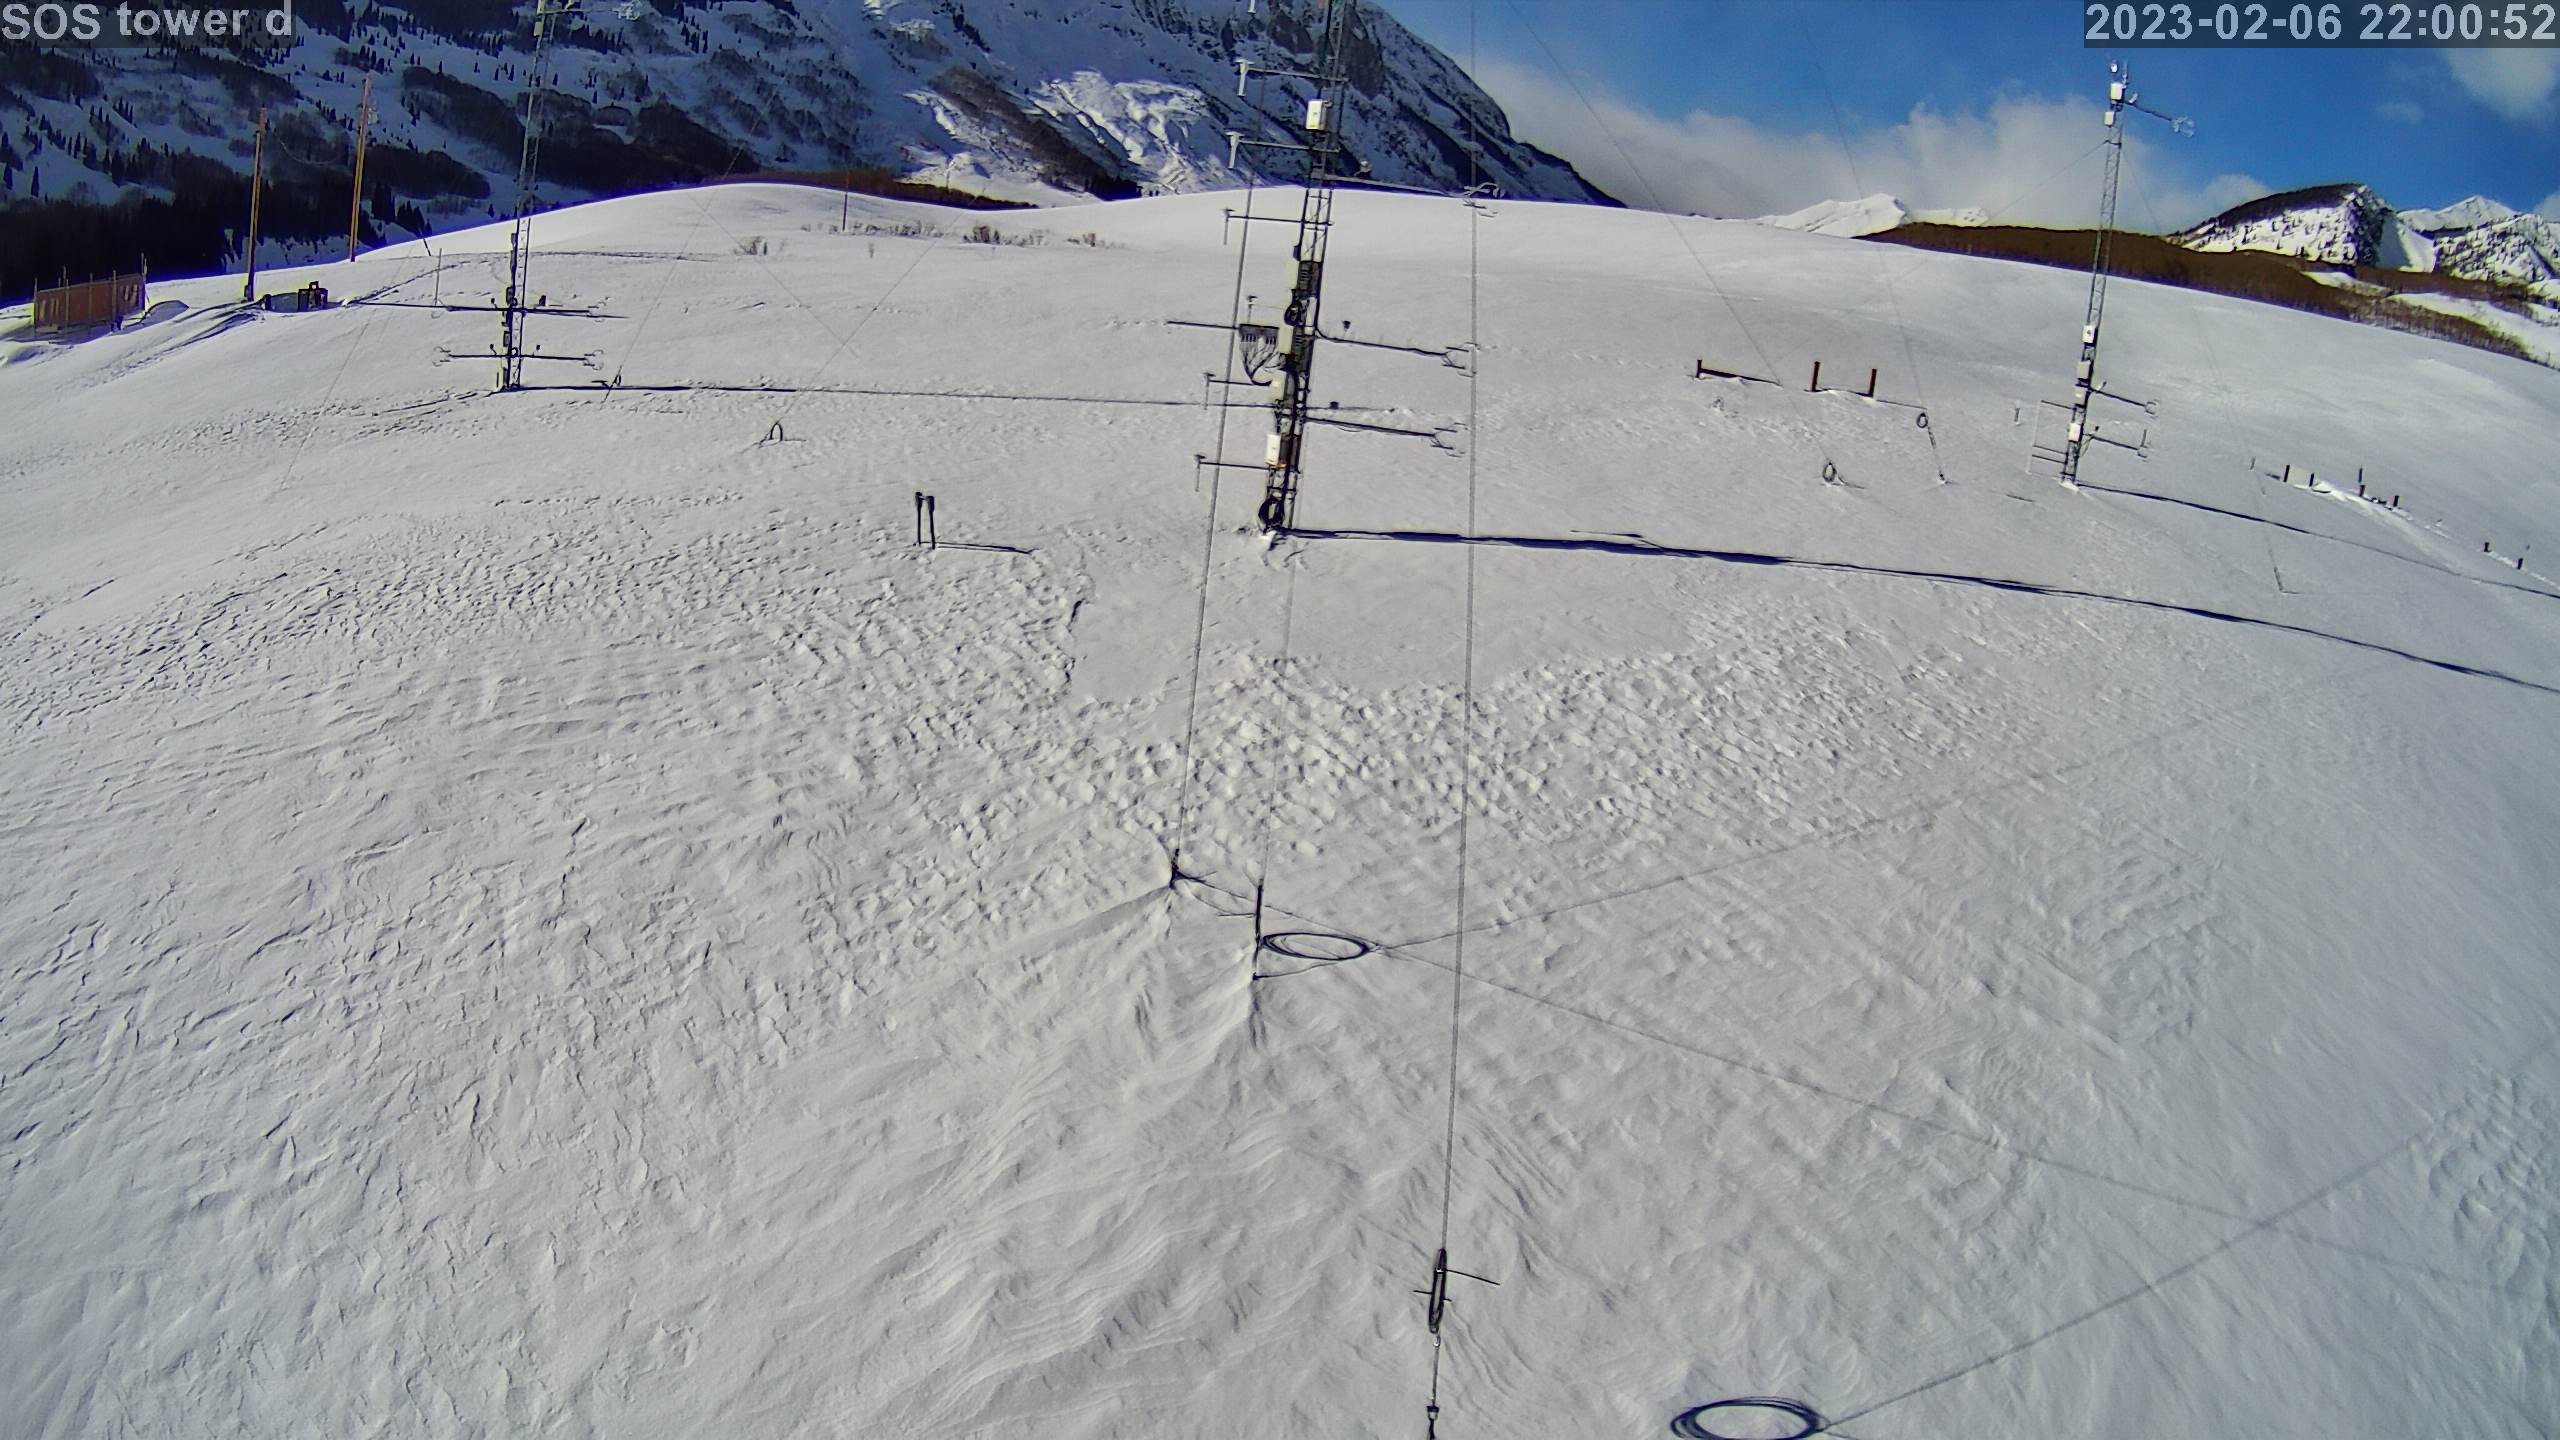
|
photo 2023020623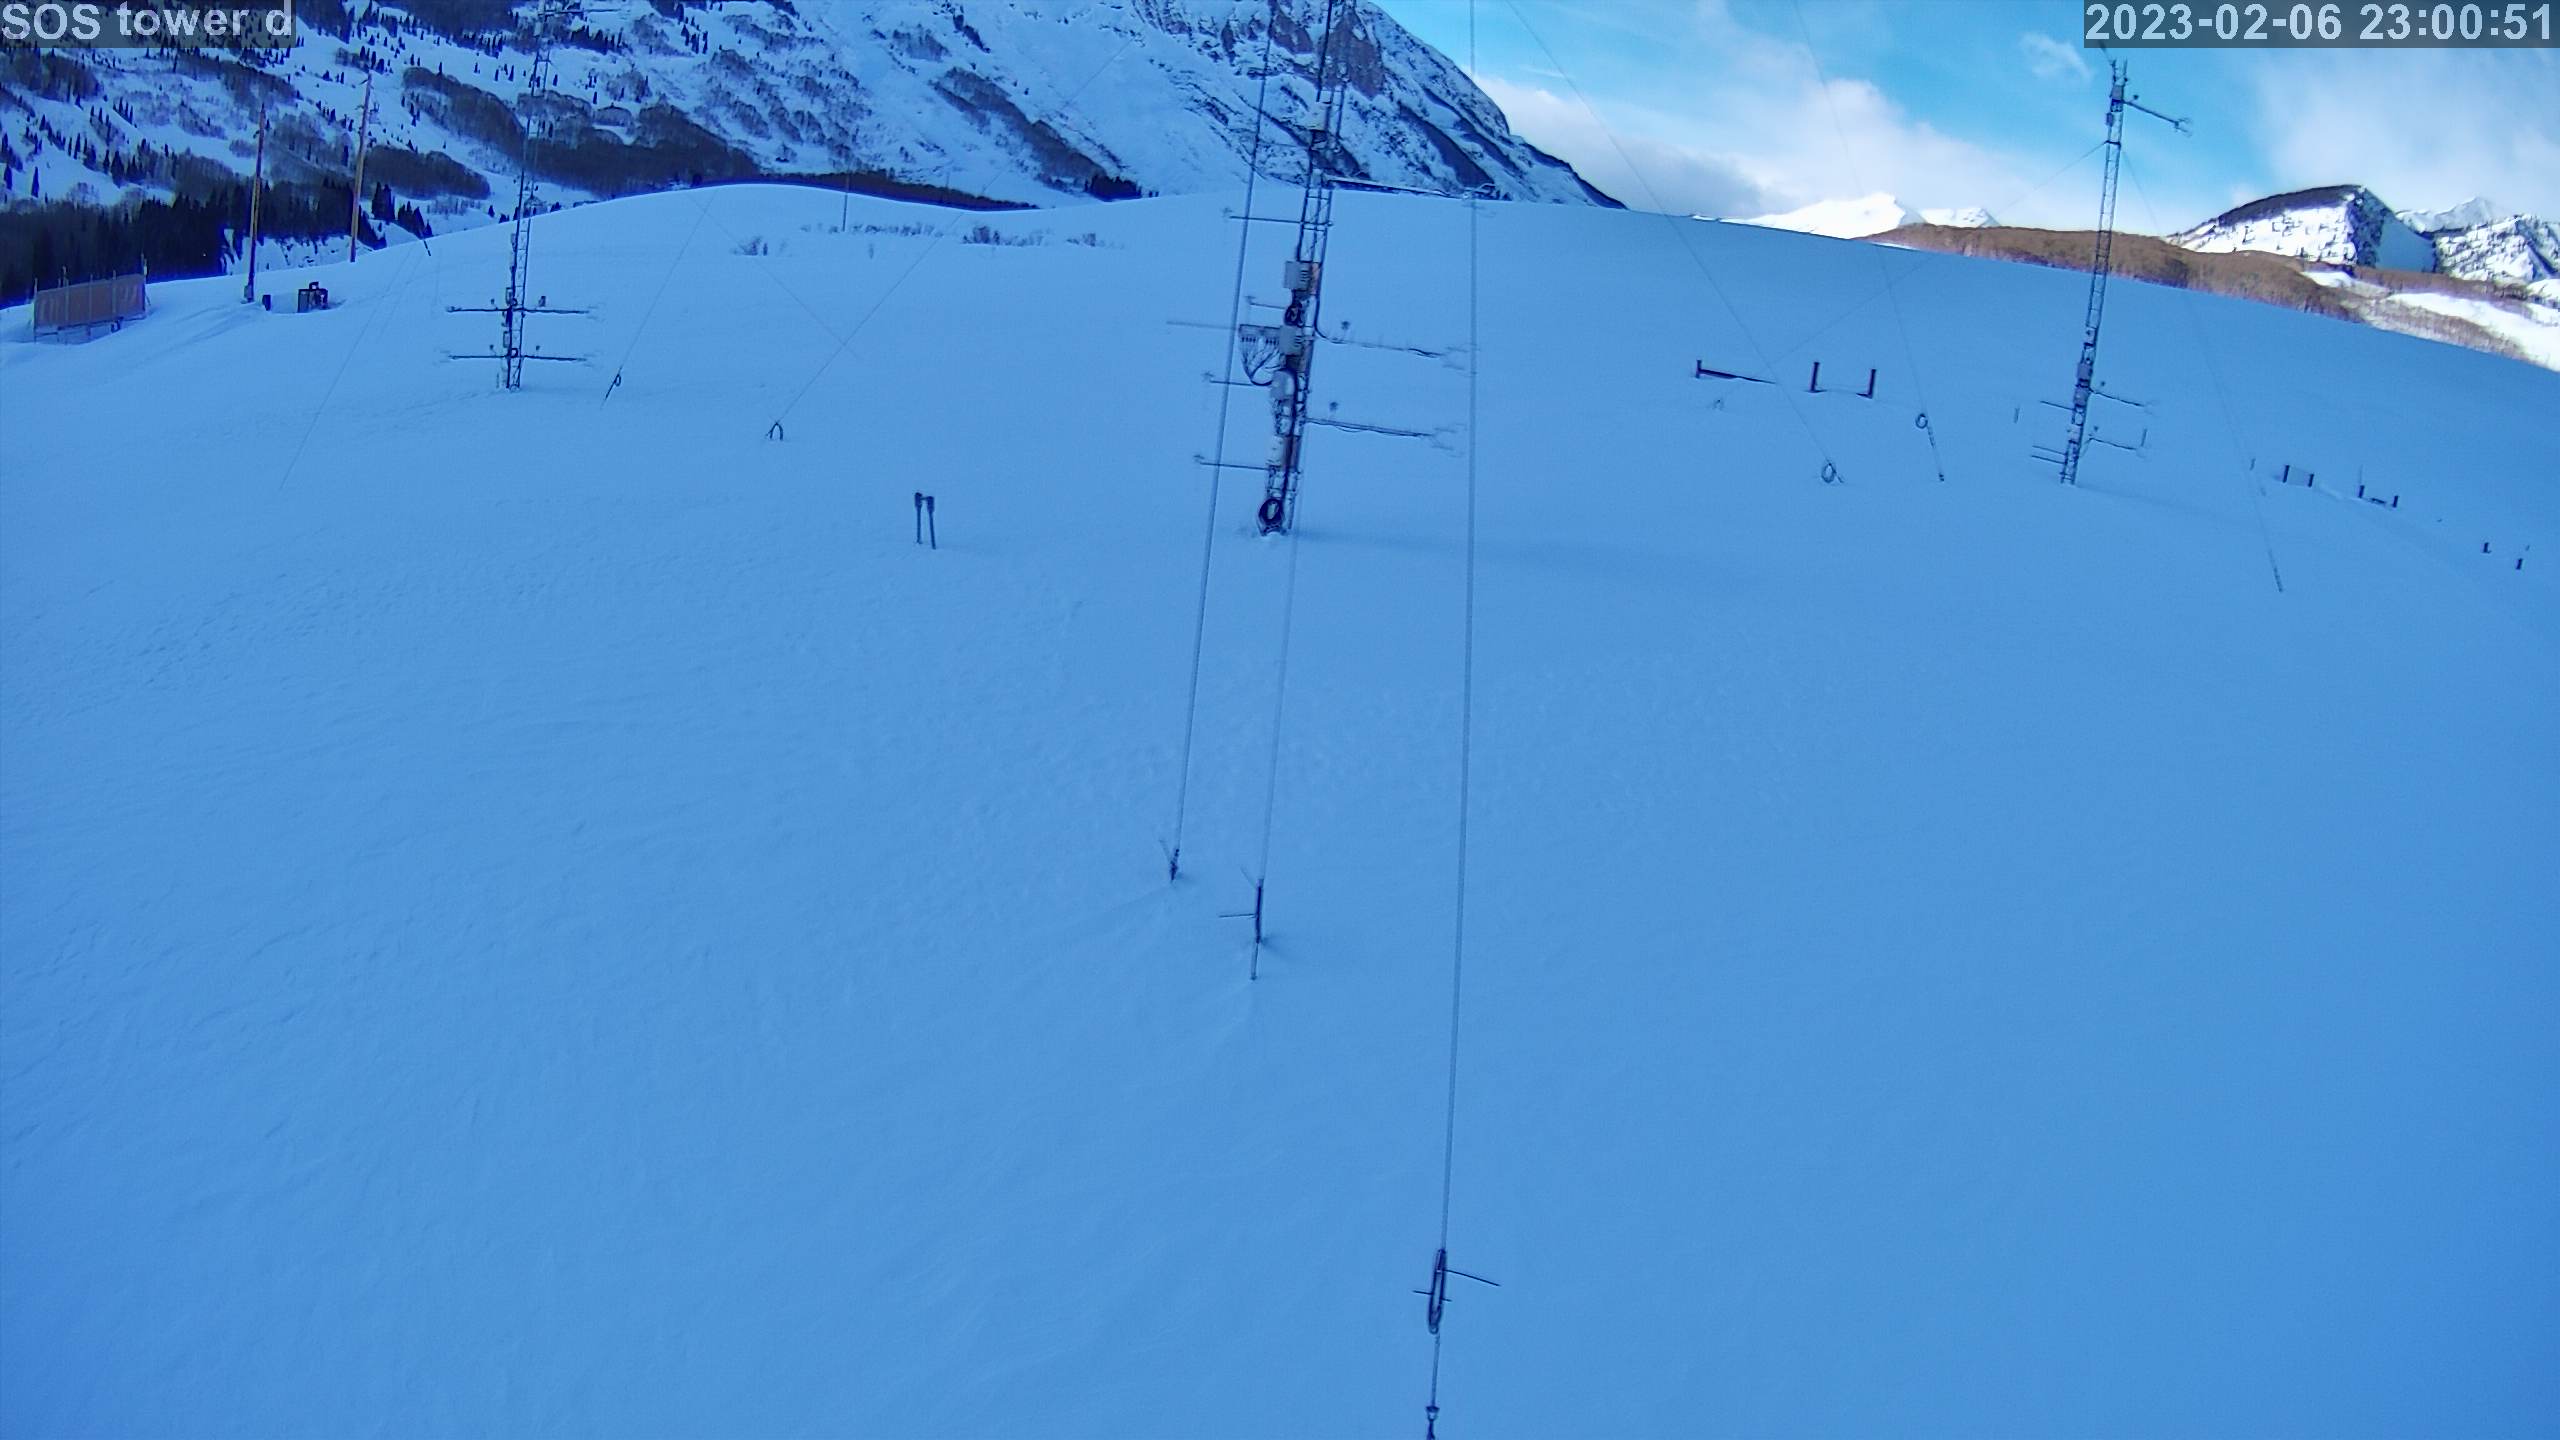
|