| Previous day | Select day | Next day |
The most recent plots are generally updated every 15 minutes. Use the browser reload button to make sure you are seeing the latest version of a plot.
In order to distinquish the traces on the vertical profile plots, a slight offset in X is added to some traces. This is indicated by a "(n)" in the legend for the trace.
If you right-click on an image, most browsers will provide a menu to download or display the plot in another window.
photo 20230204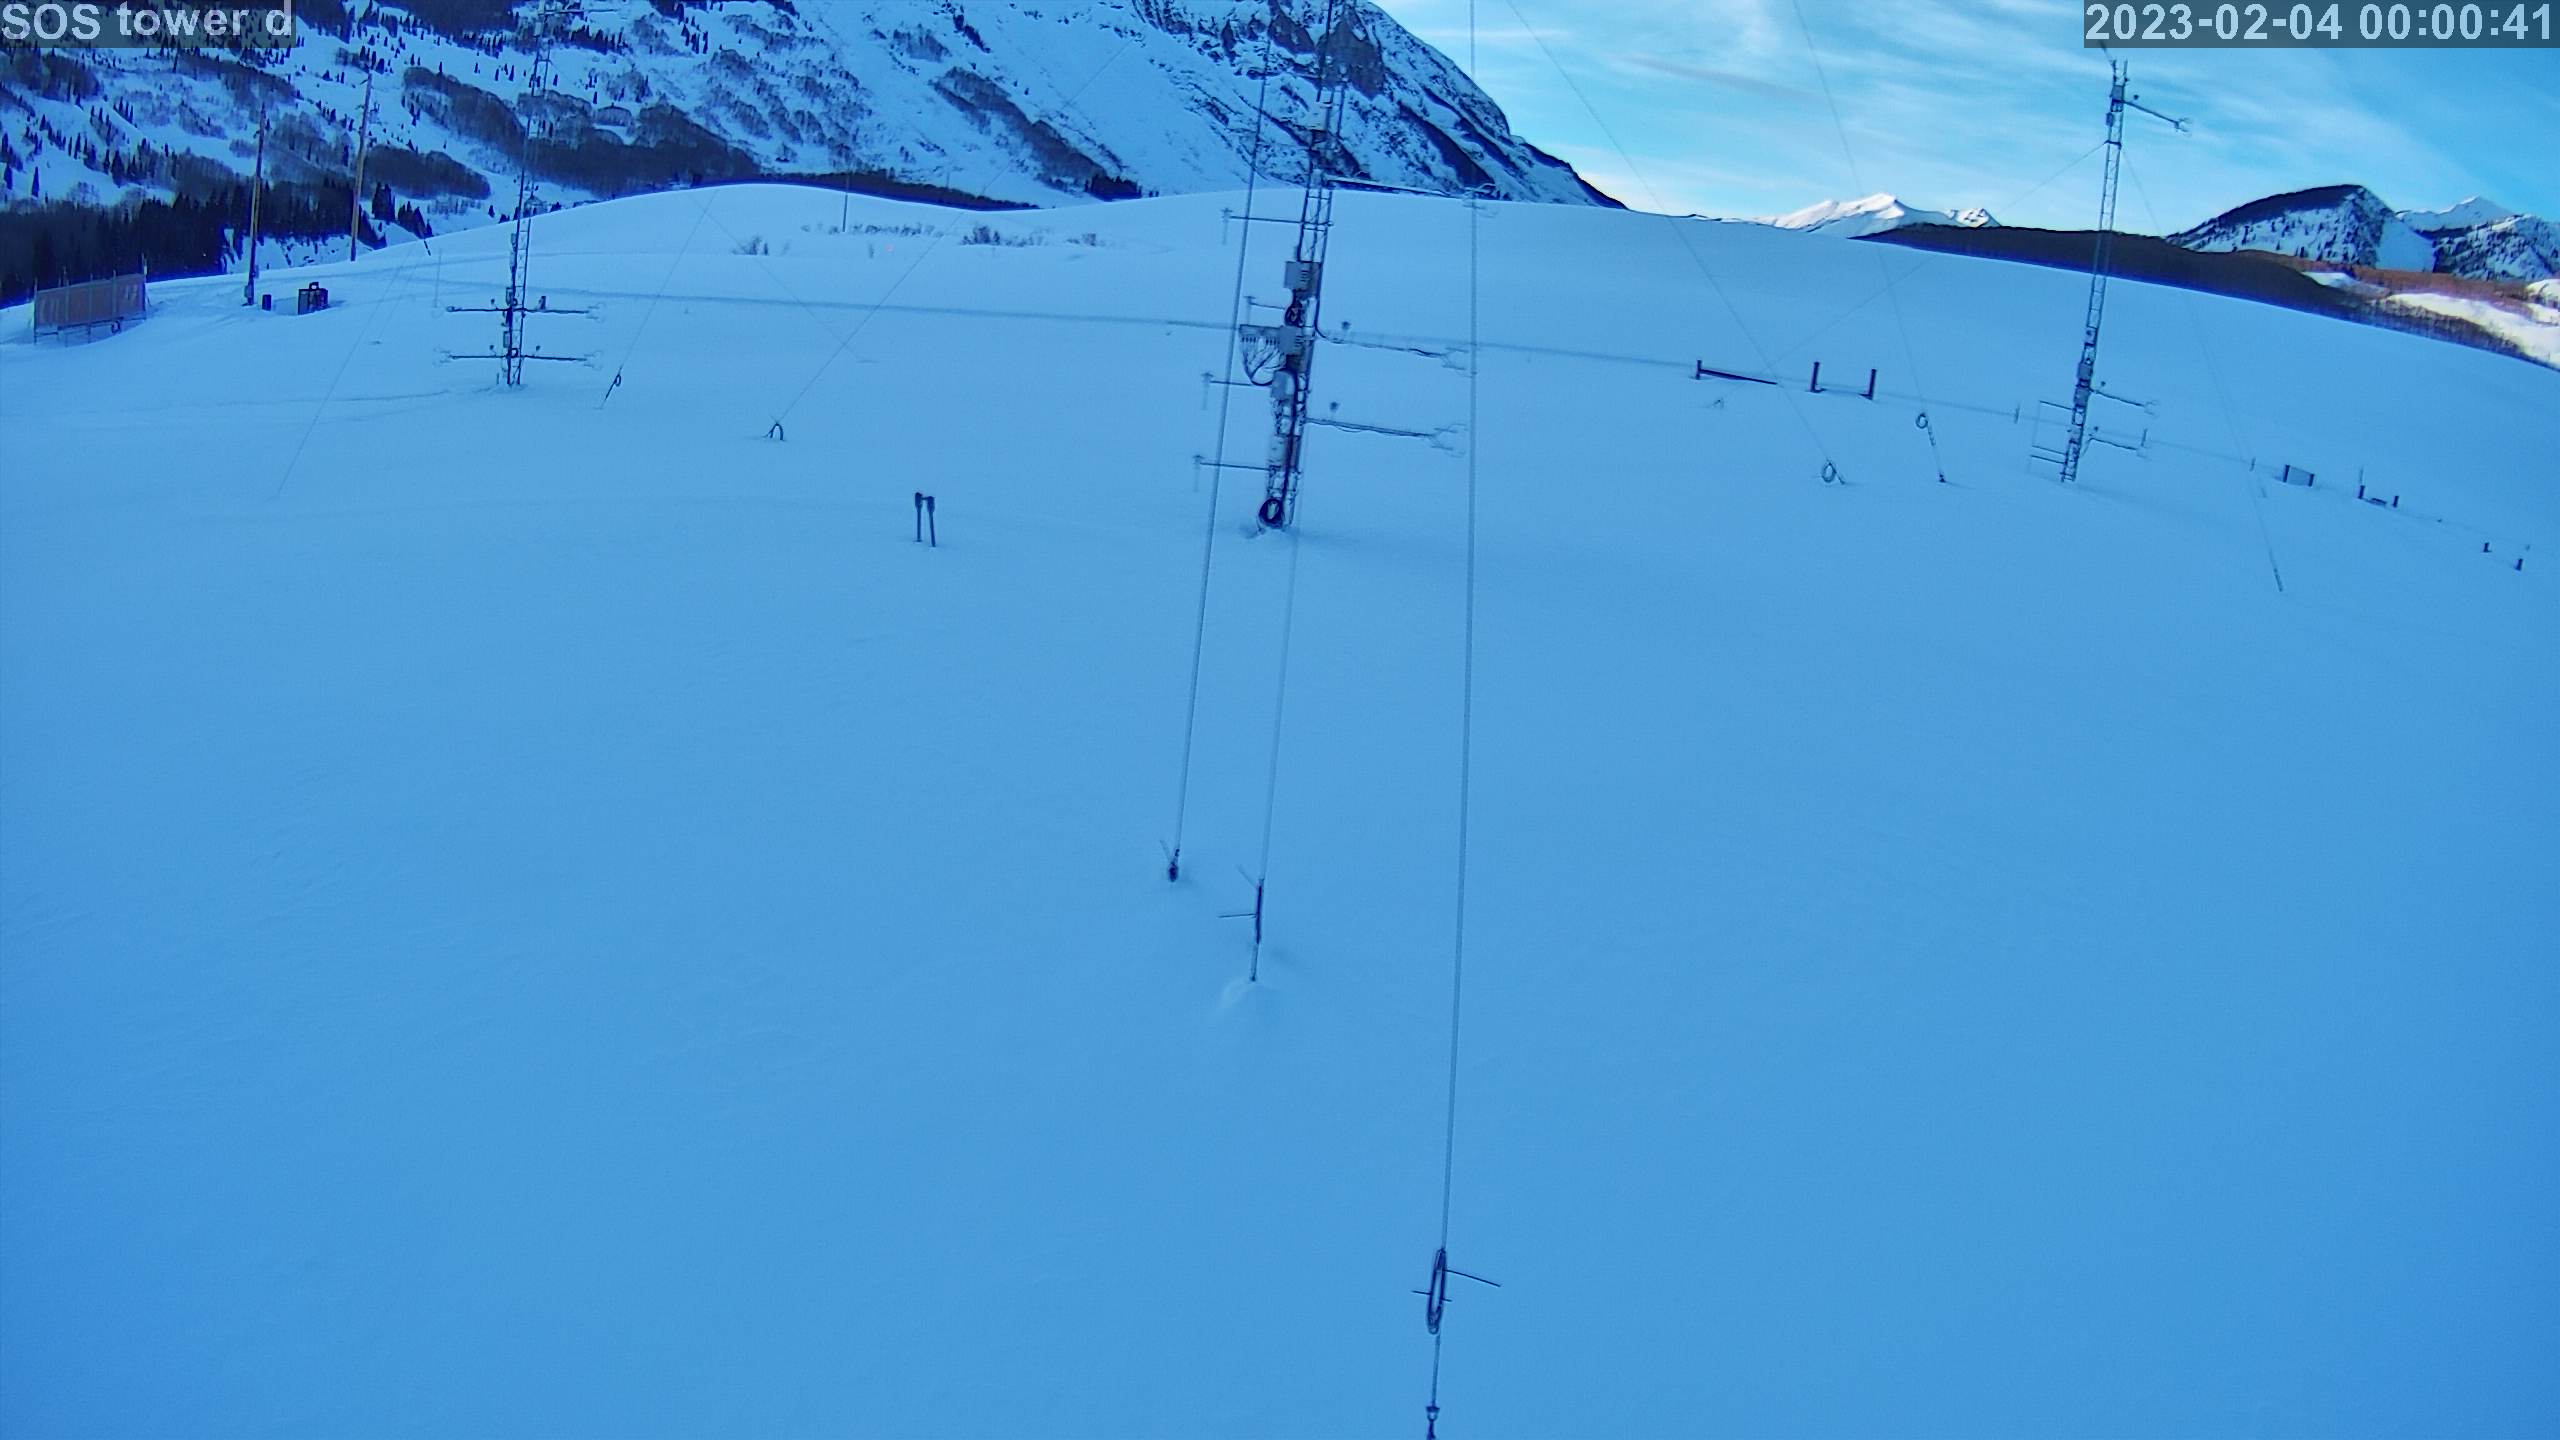
|
photo 2023020401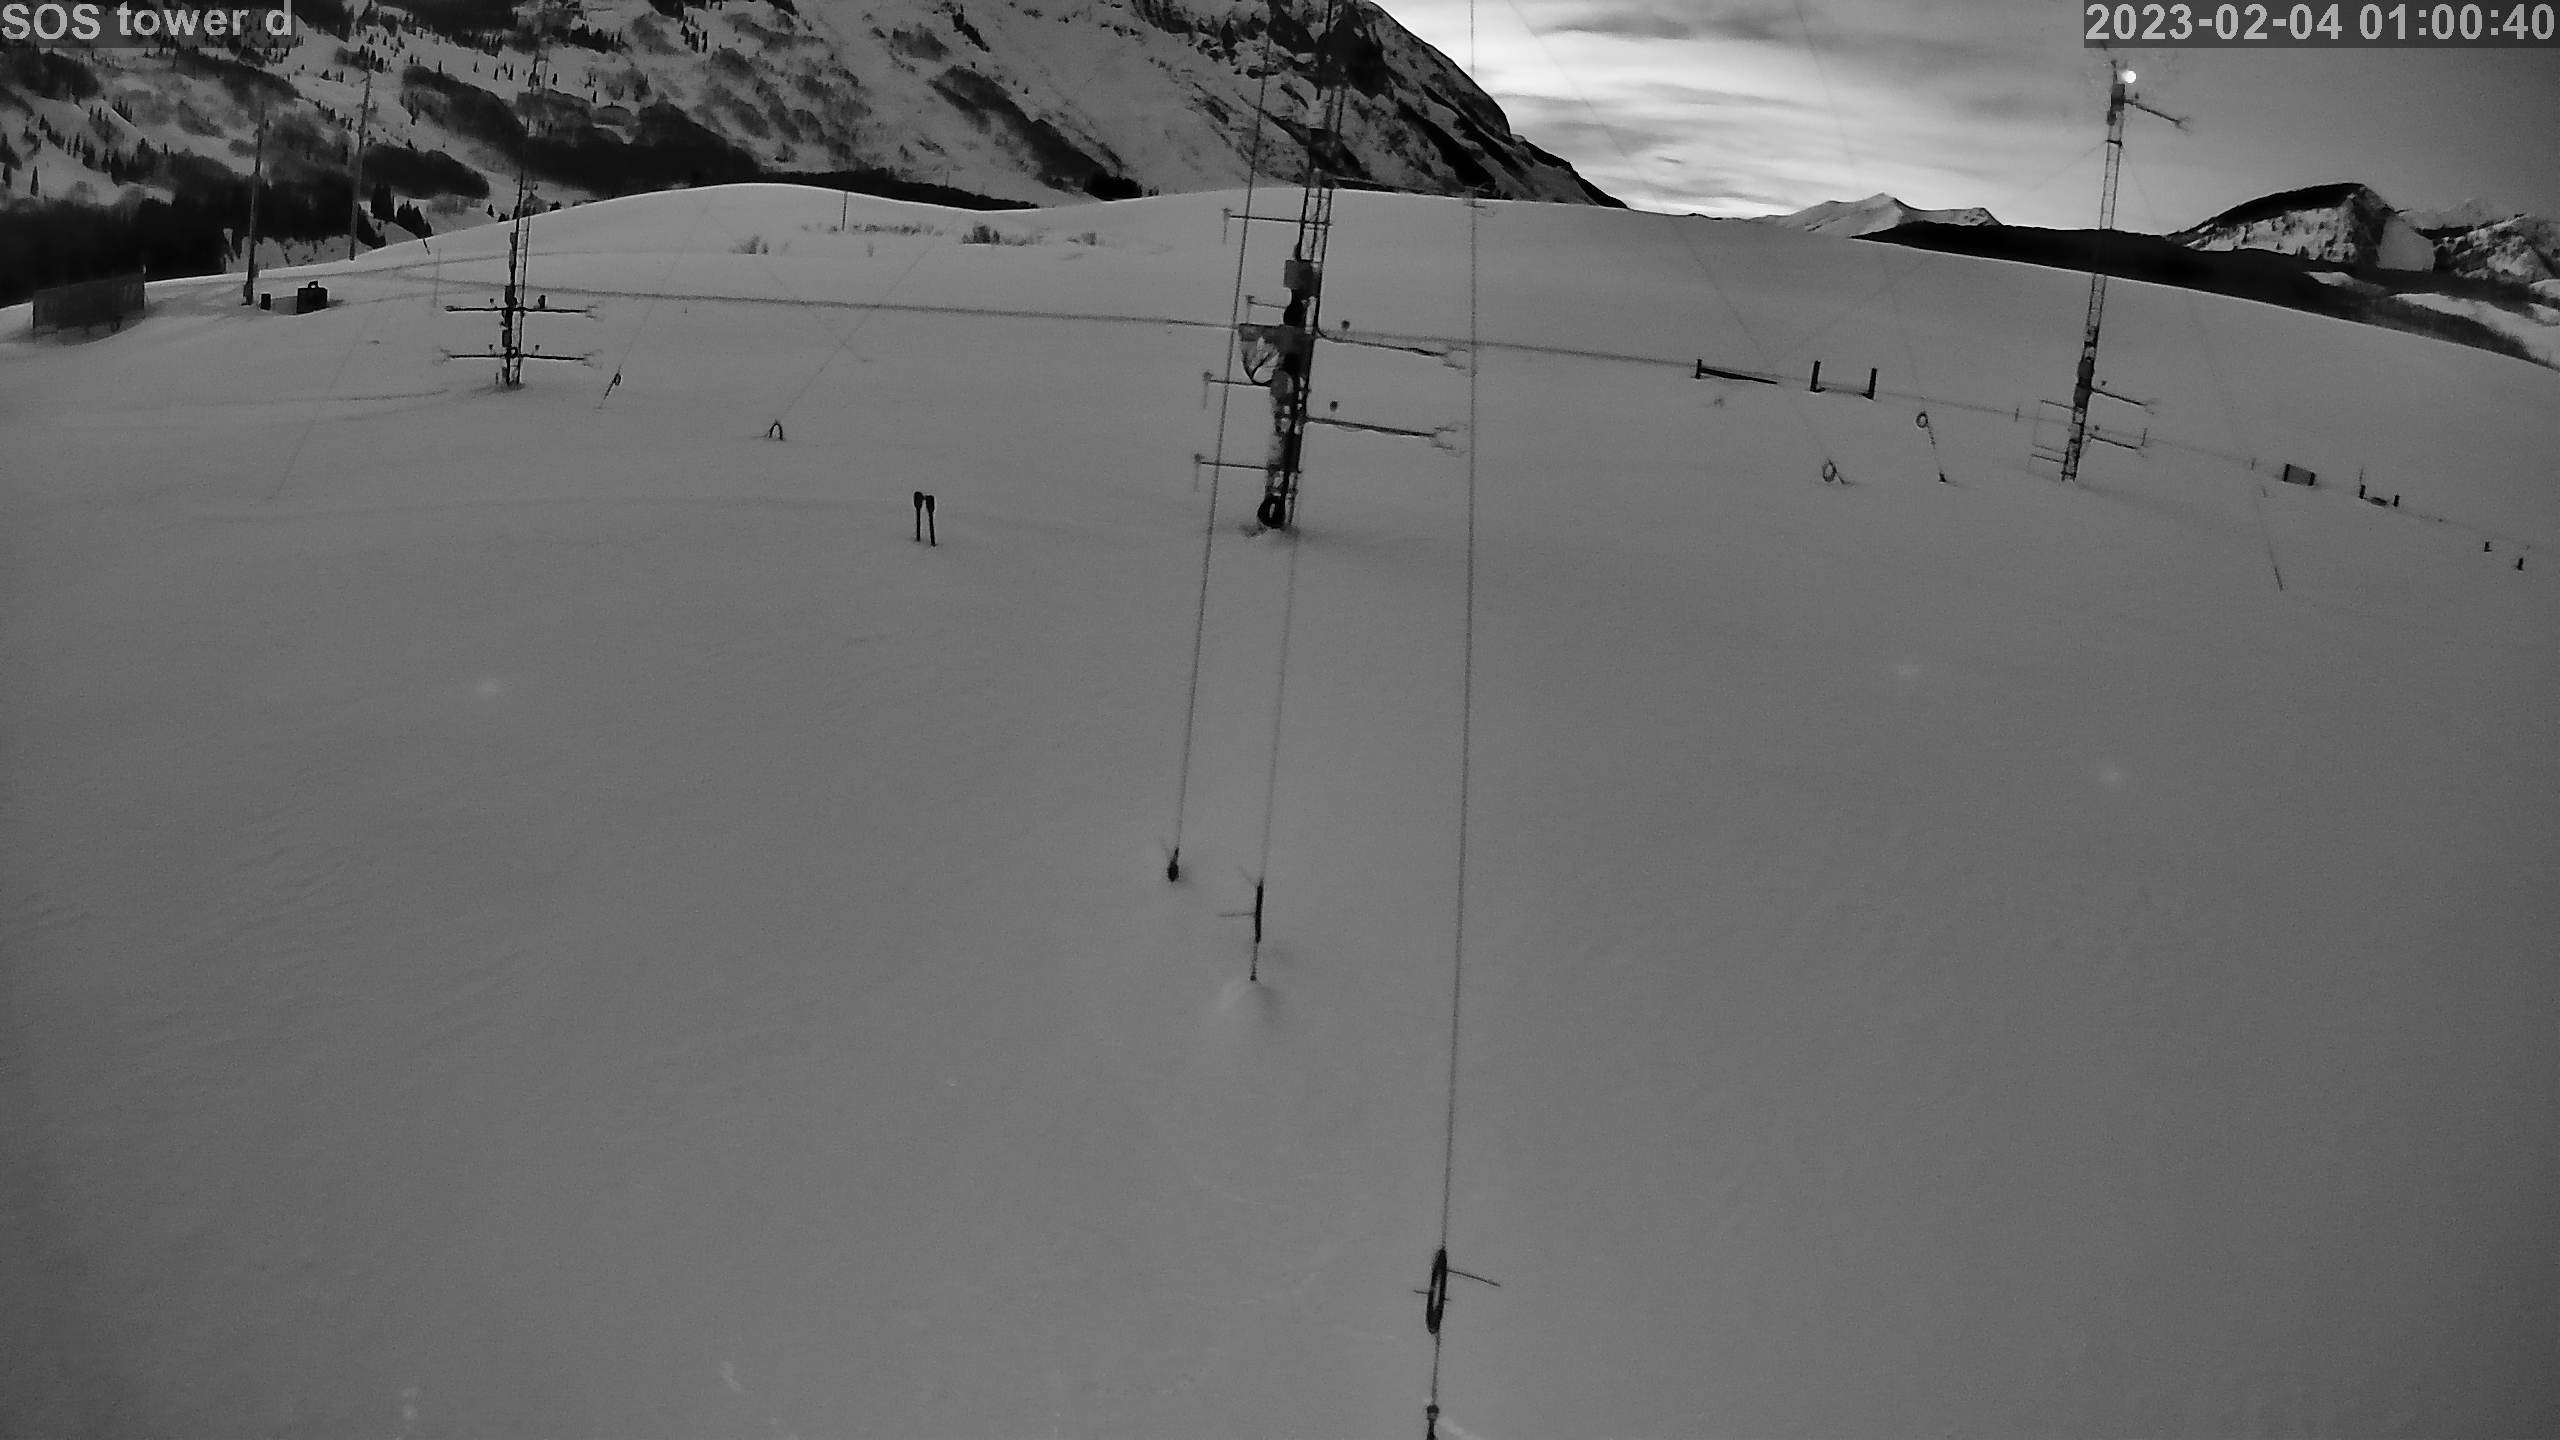
|
photo 2023020402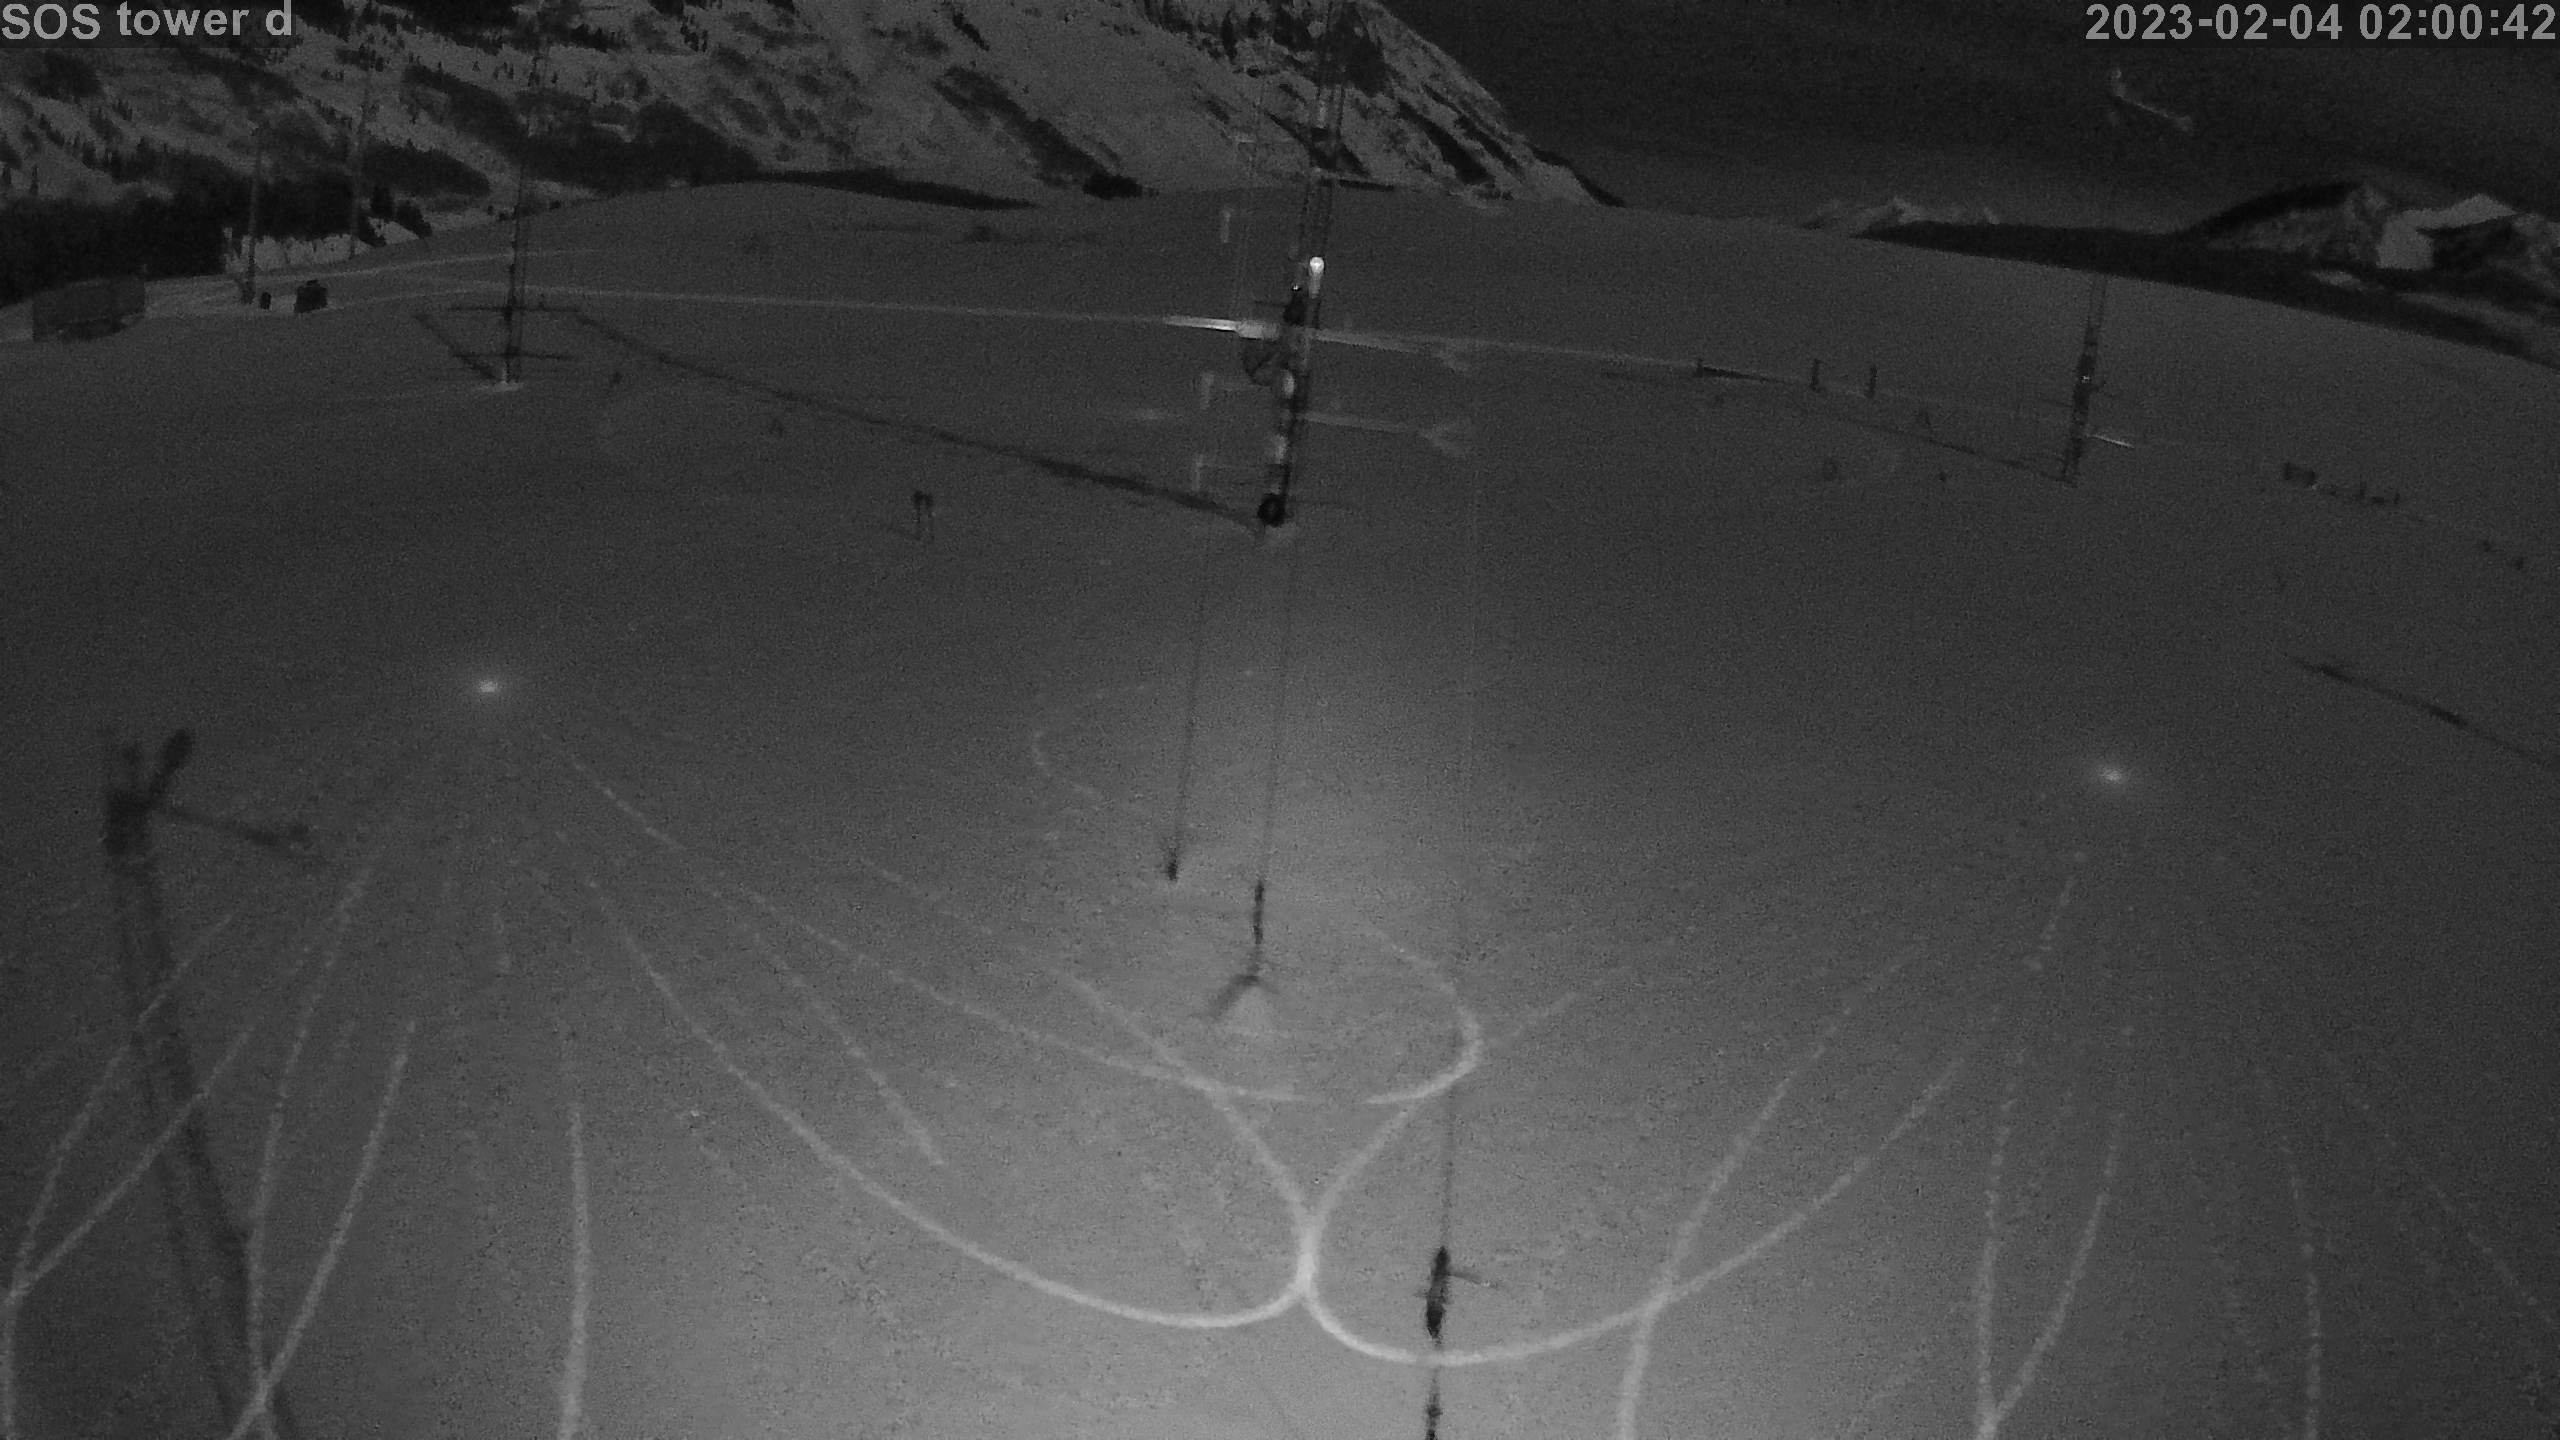
|
photo 2023020403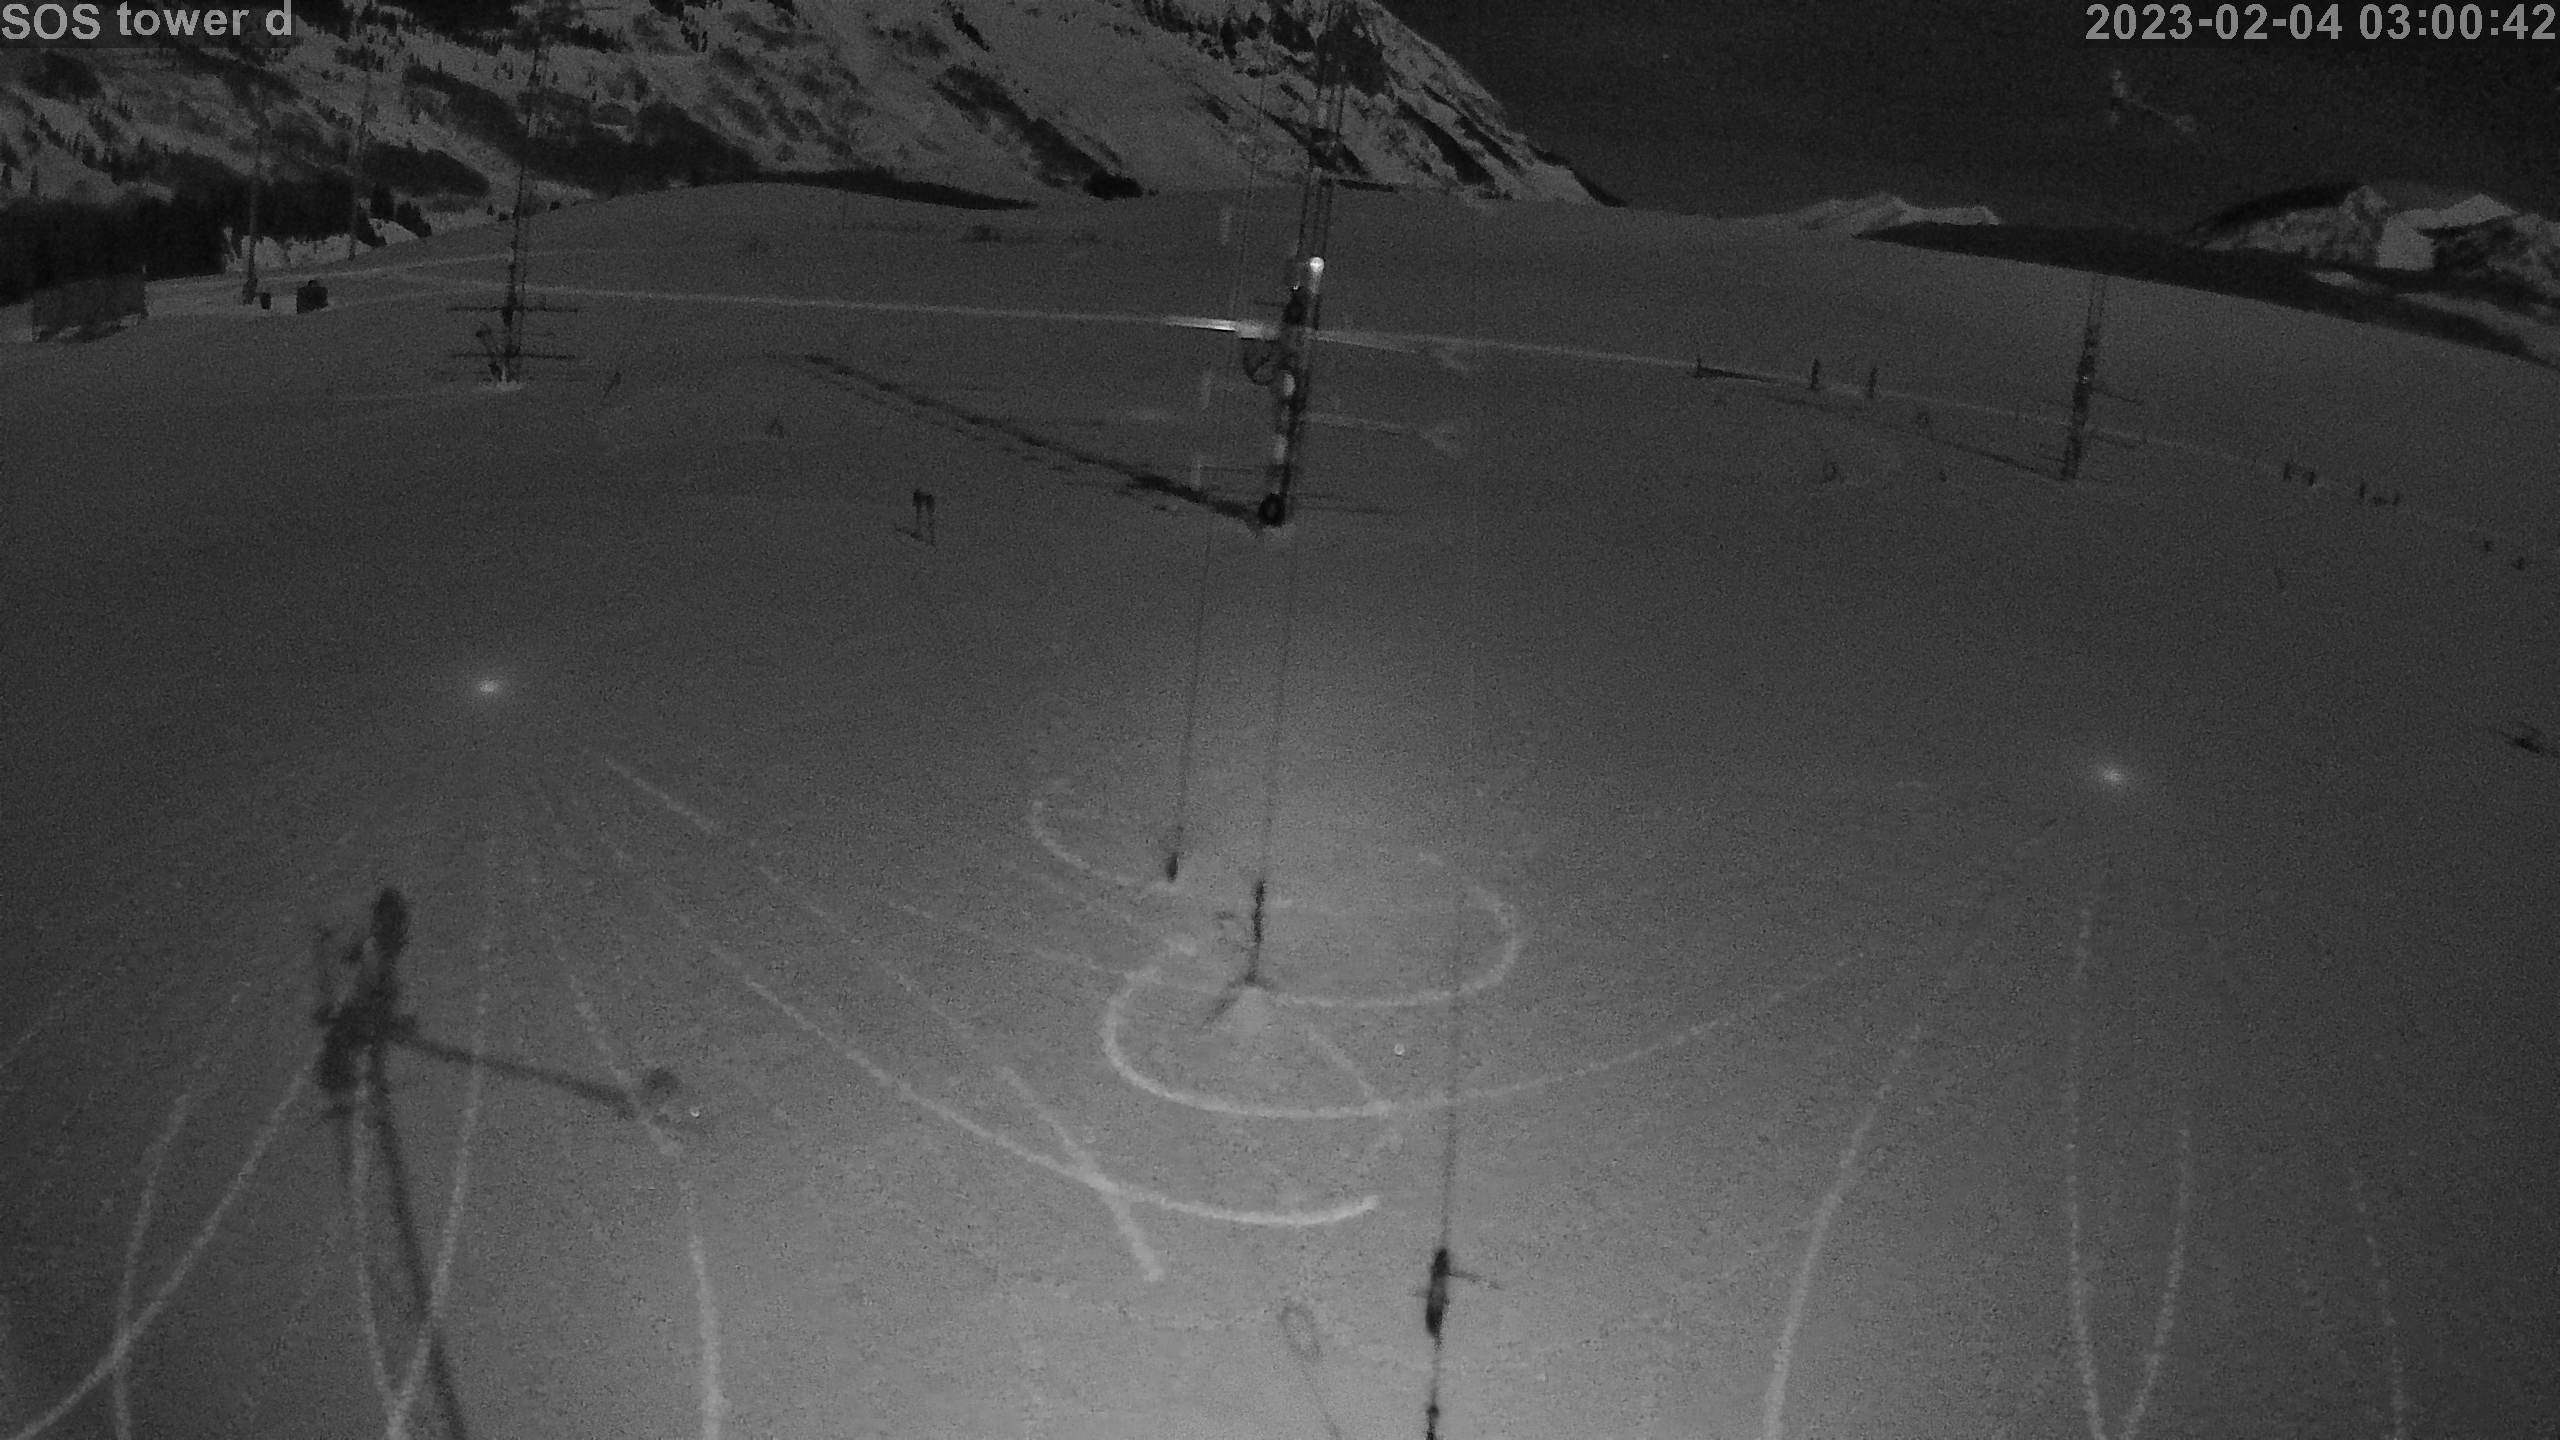
|
photo 2023020404
|
photo 2023020405
|
photo 2023020406
|
photo 2023020407
|
photo 2023020408
|
photo 2023020409
|
photo 2023020410
|
photo 2023020411
|
photo 2023020412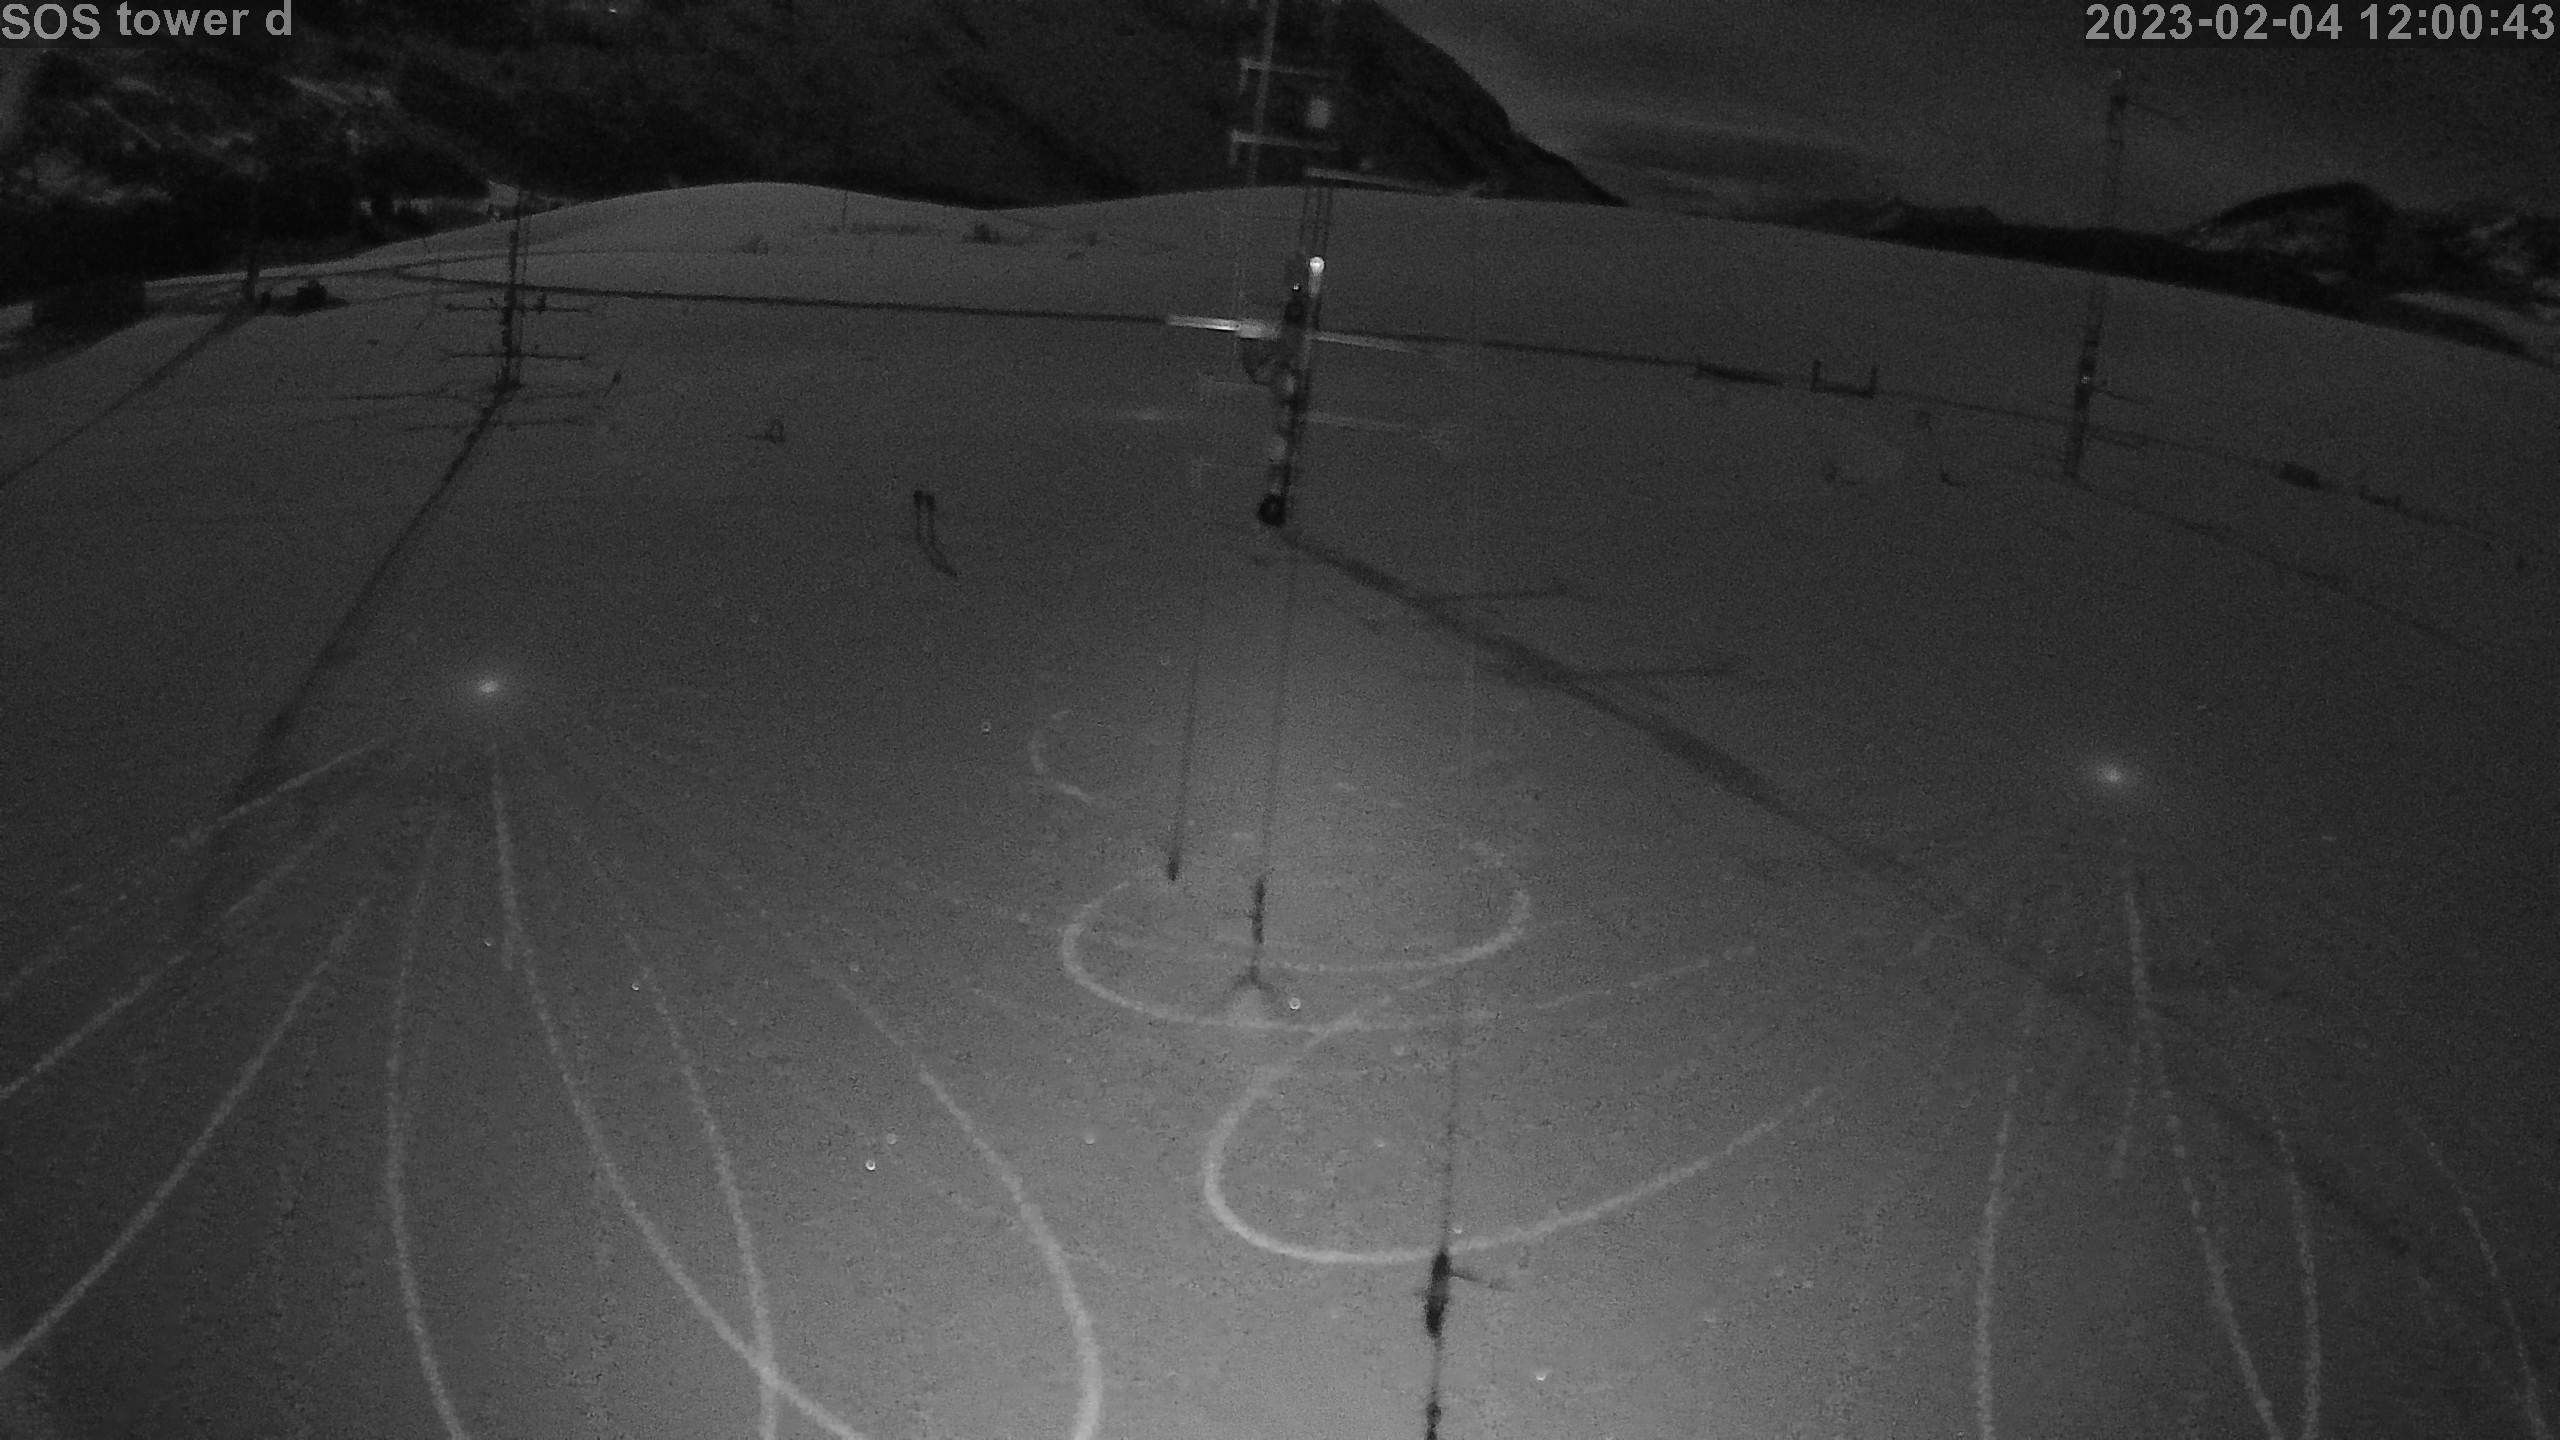
|
photo 2023020413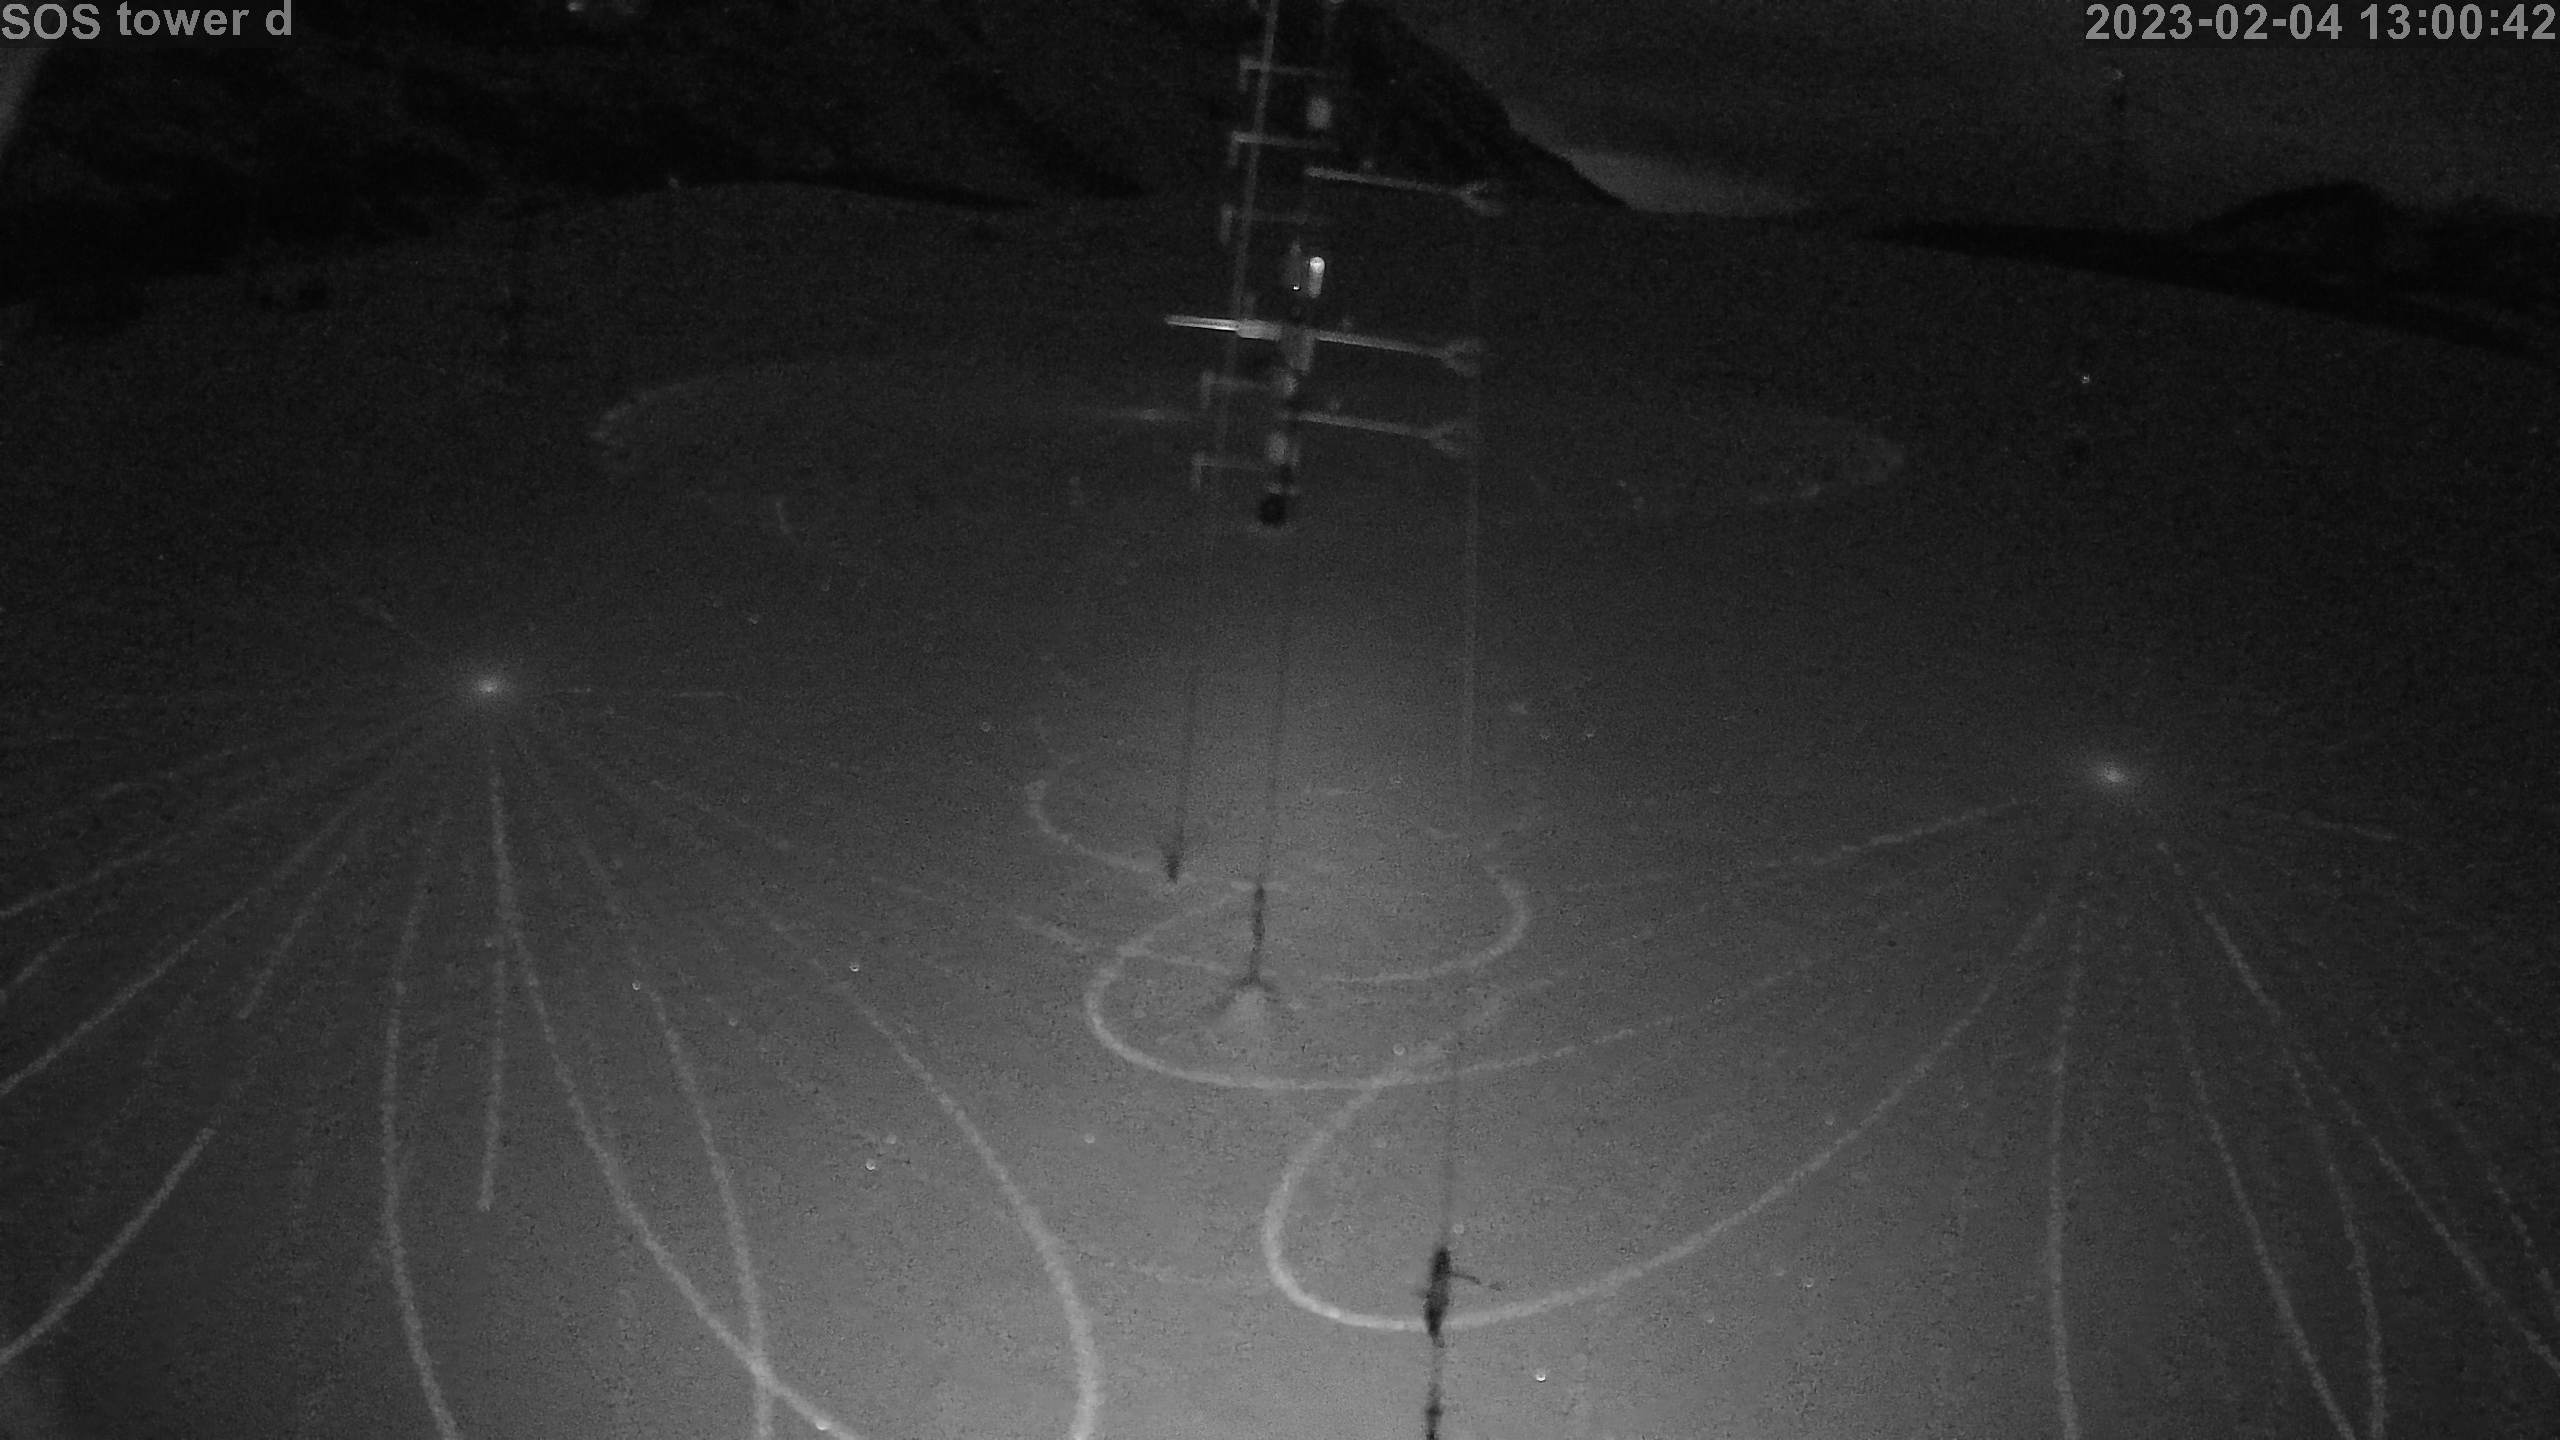
|
photo 2023020414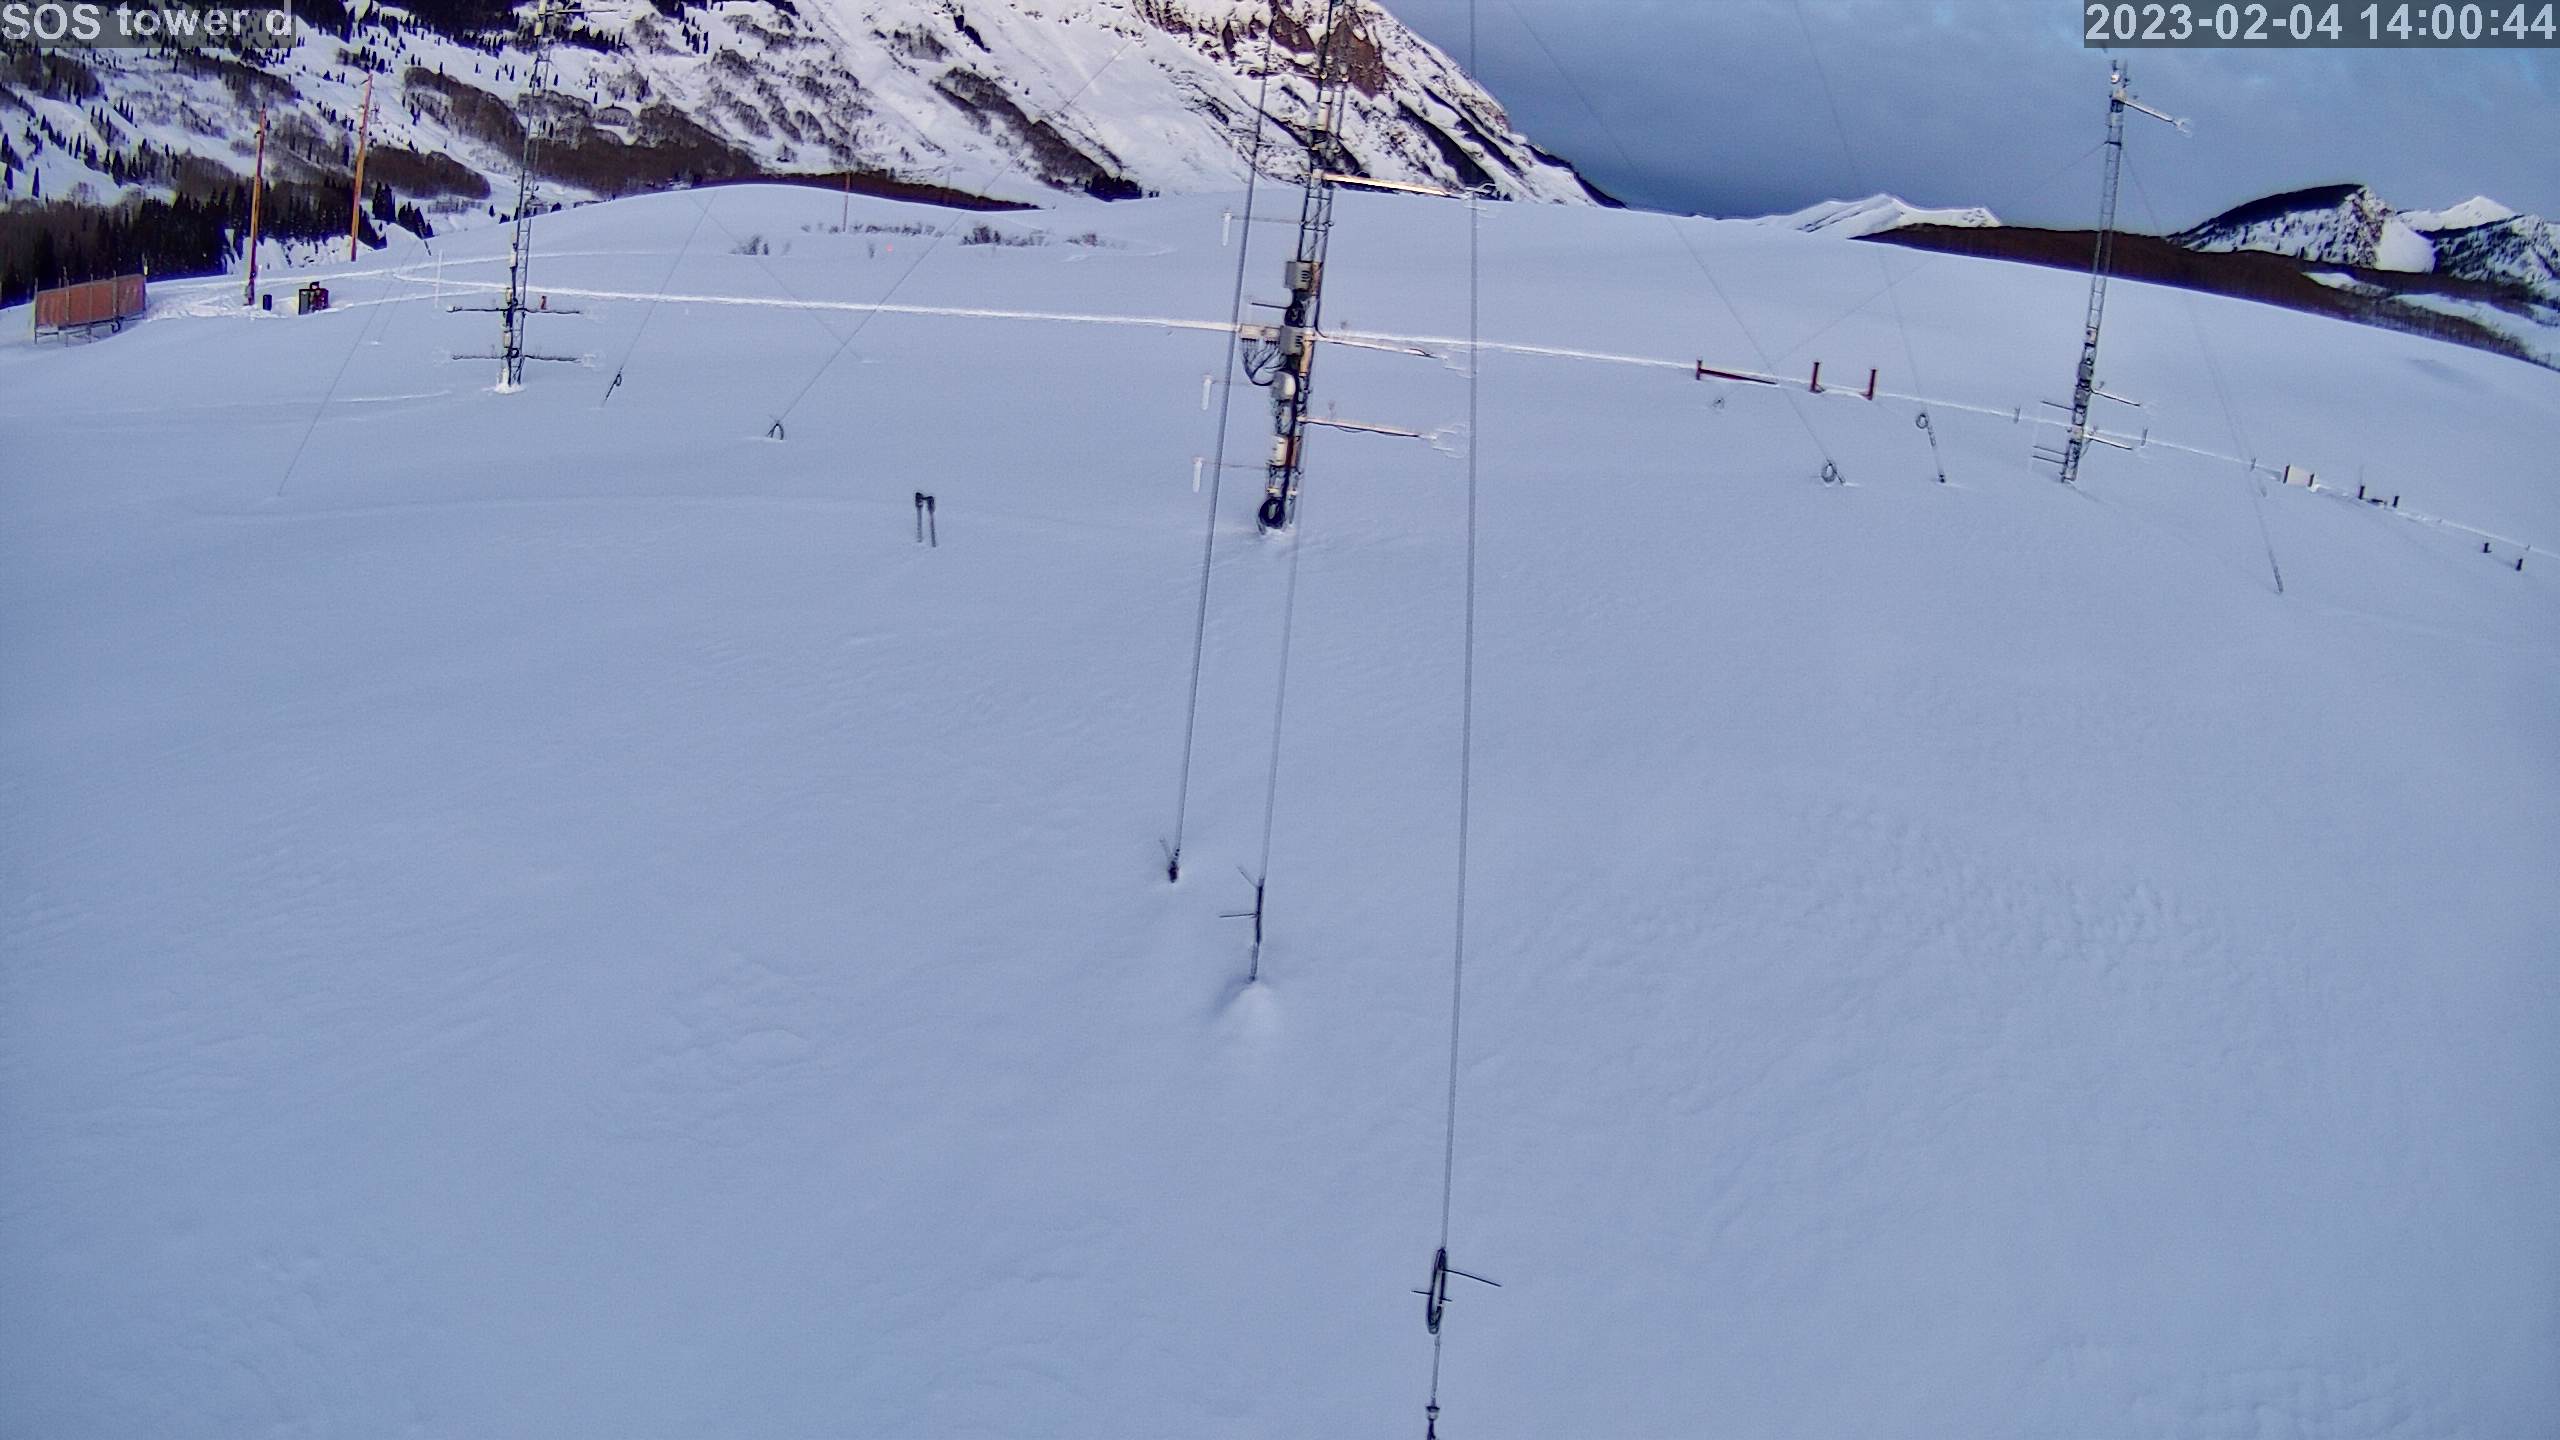
|
photo 2023020415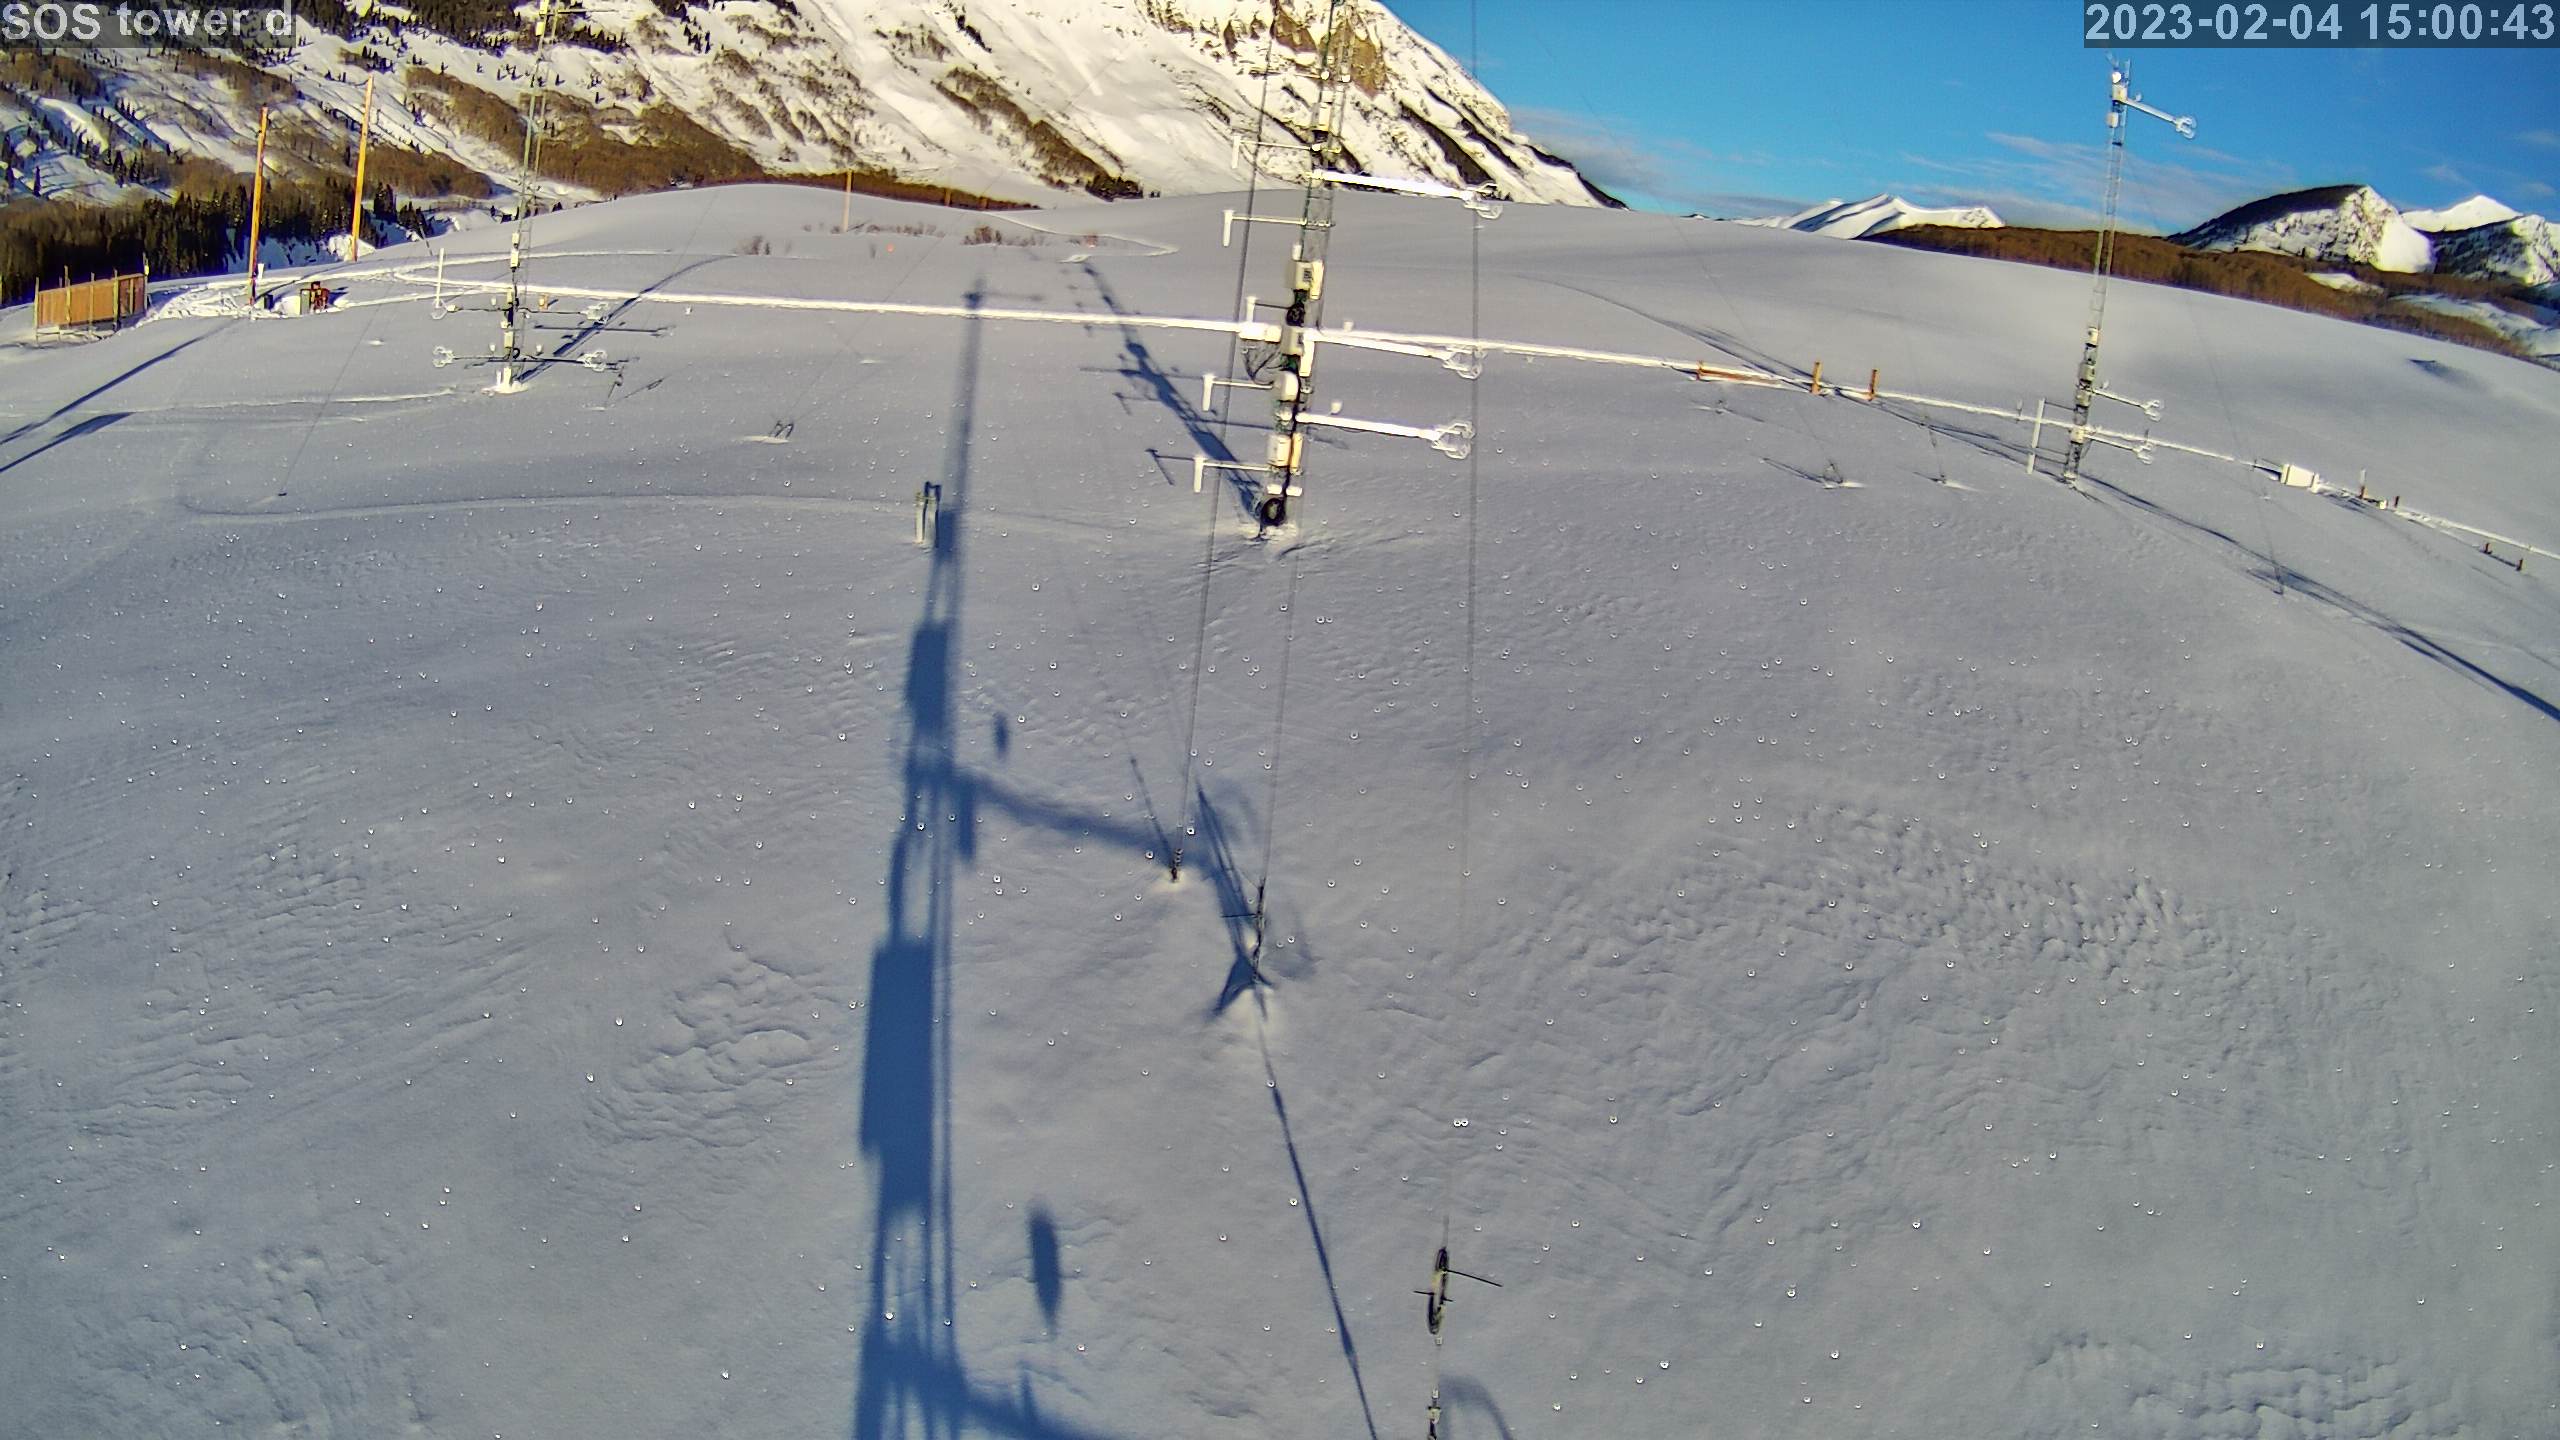
|
photo 2023020416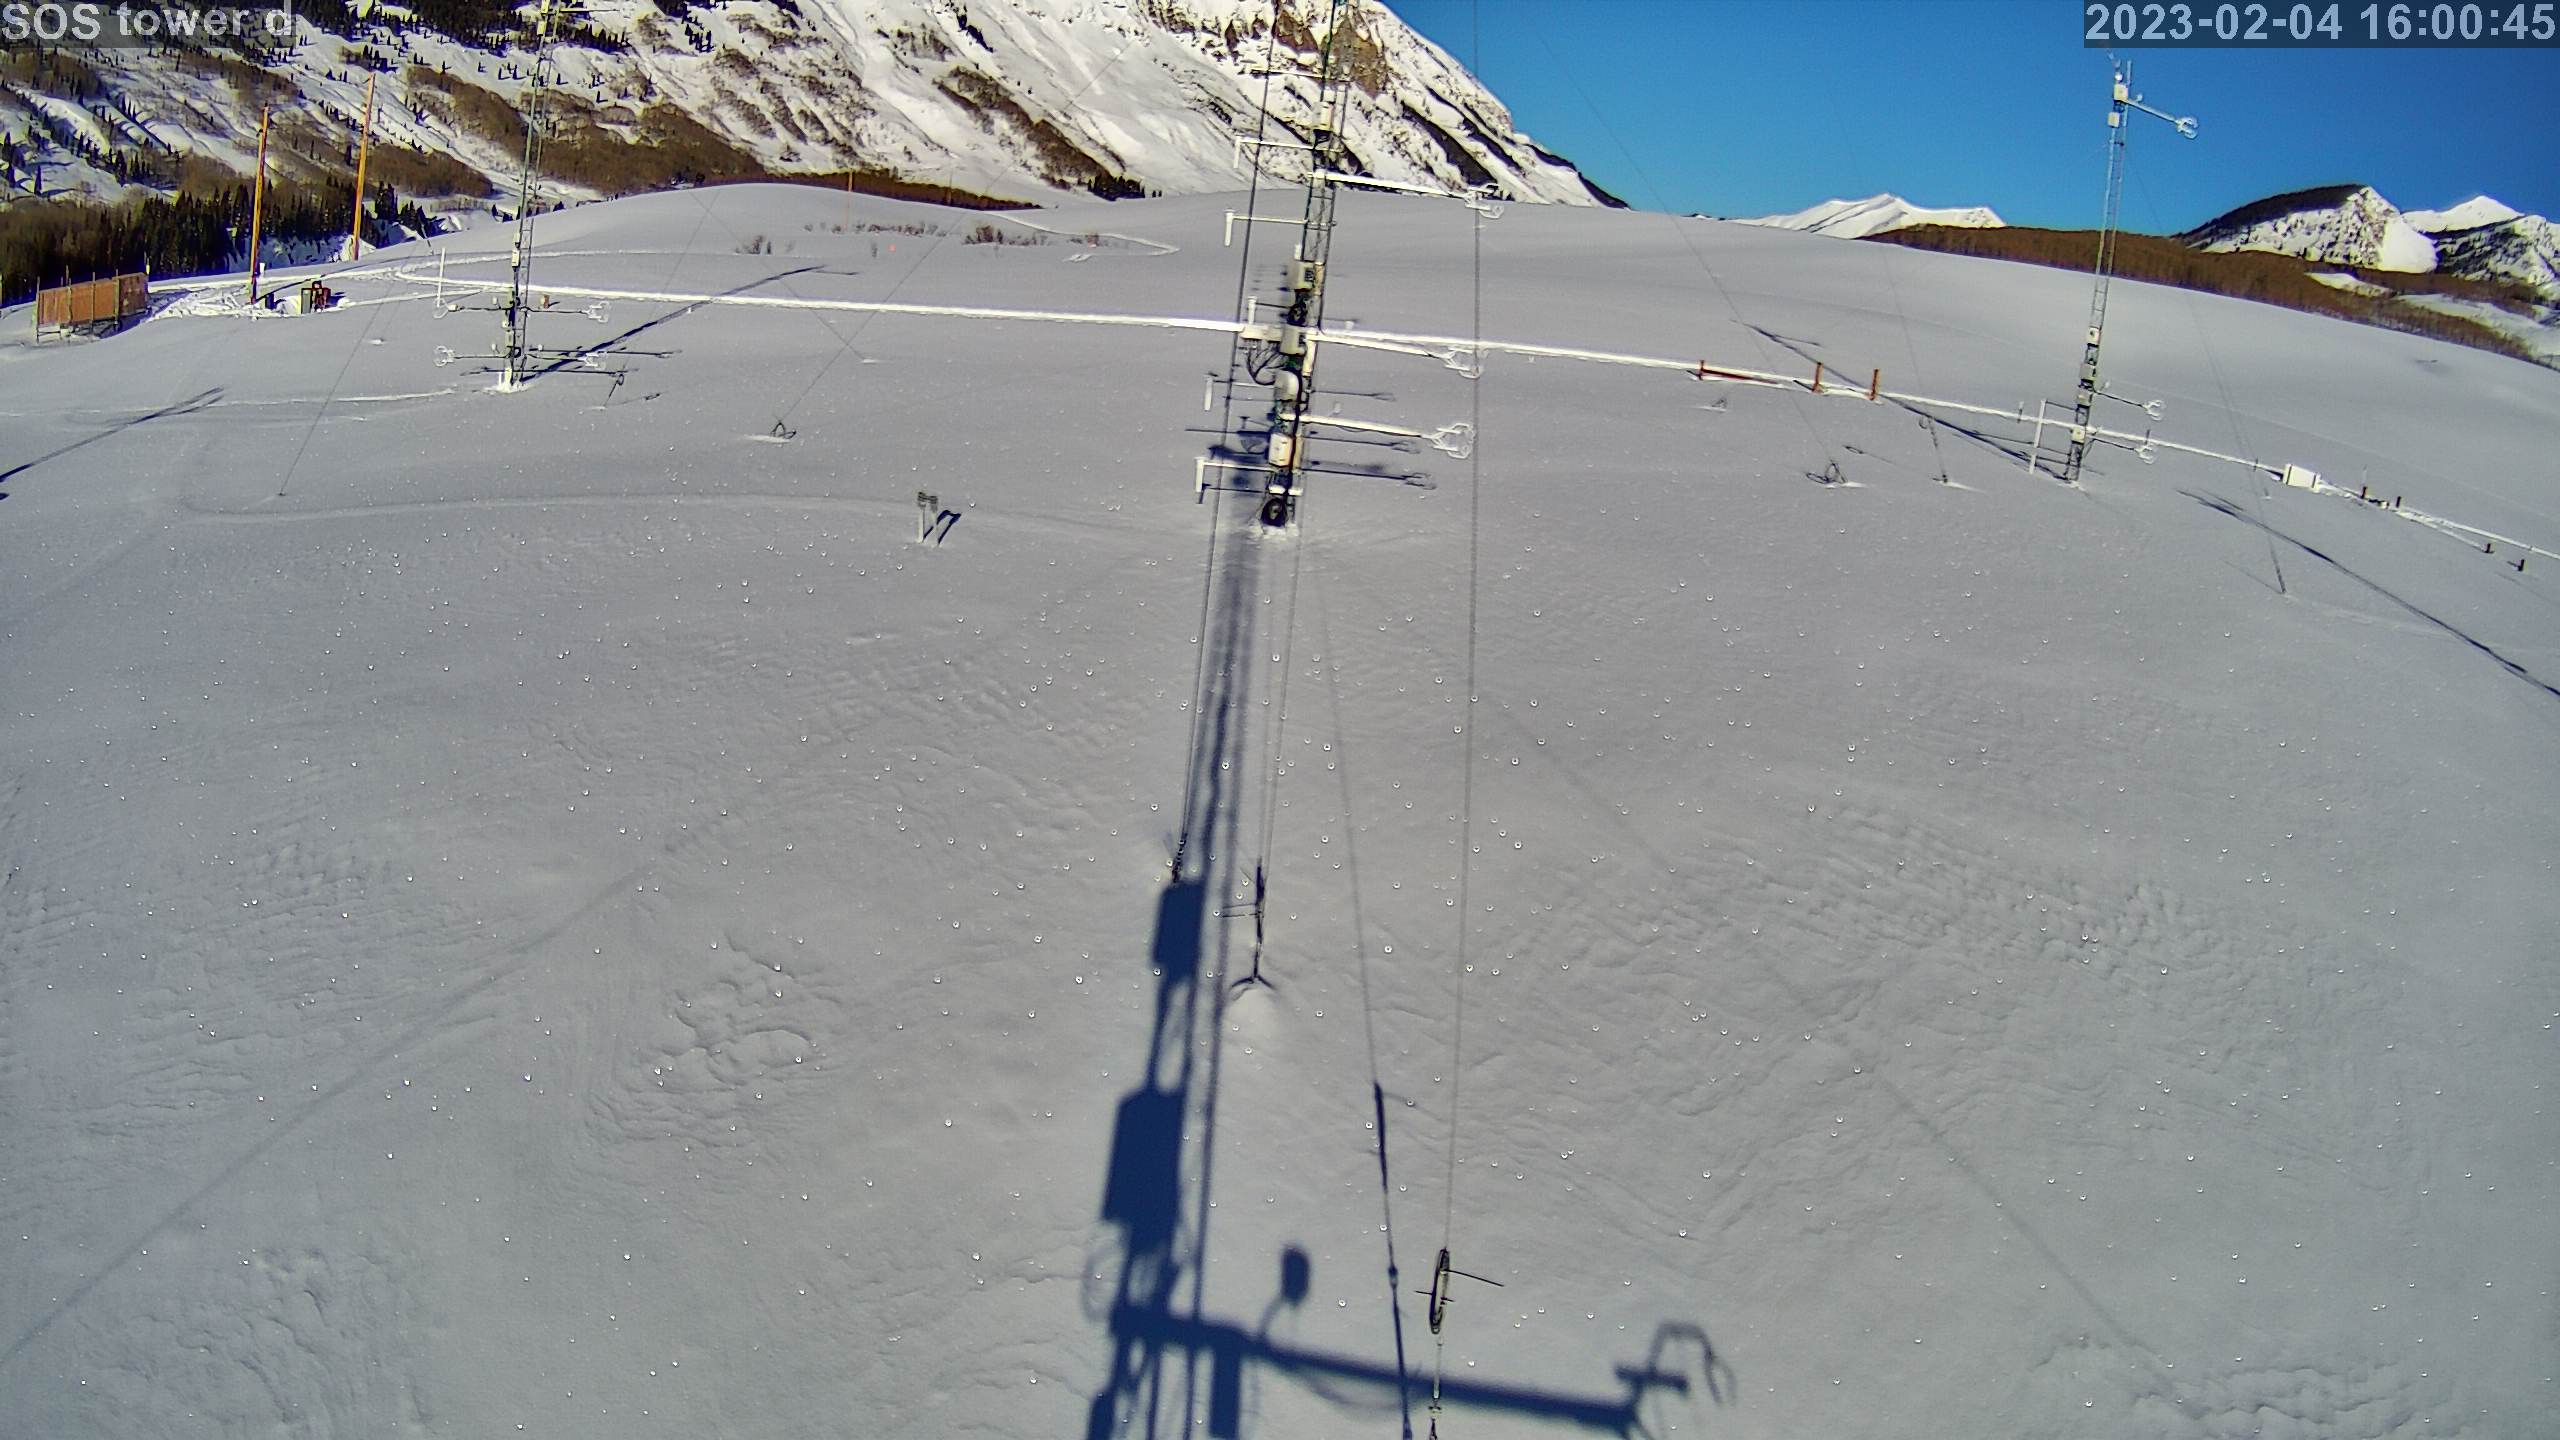
|
photo 2023020417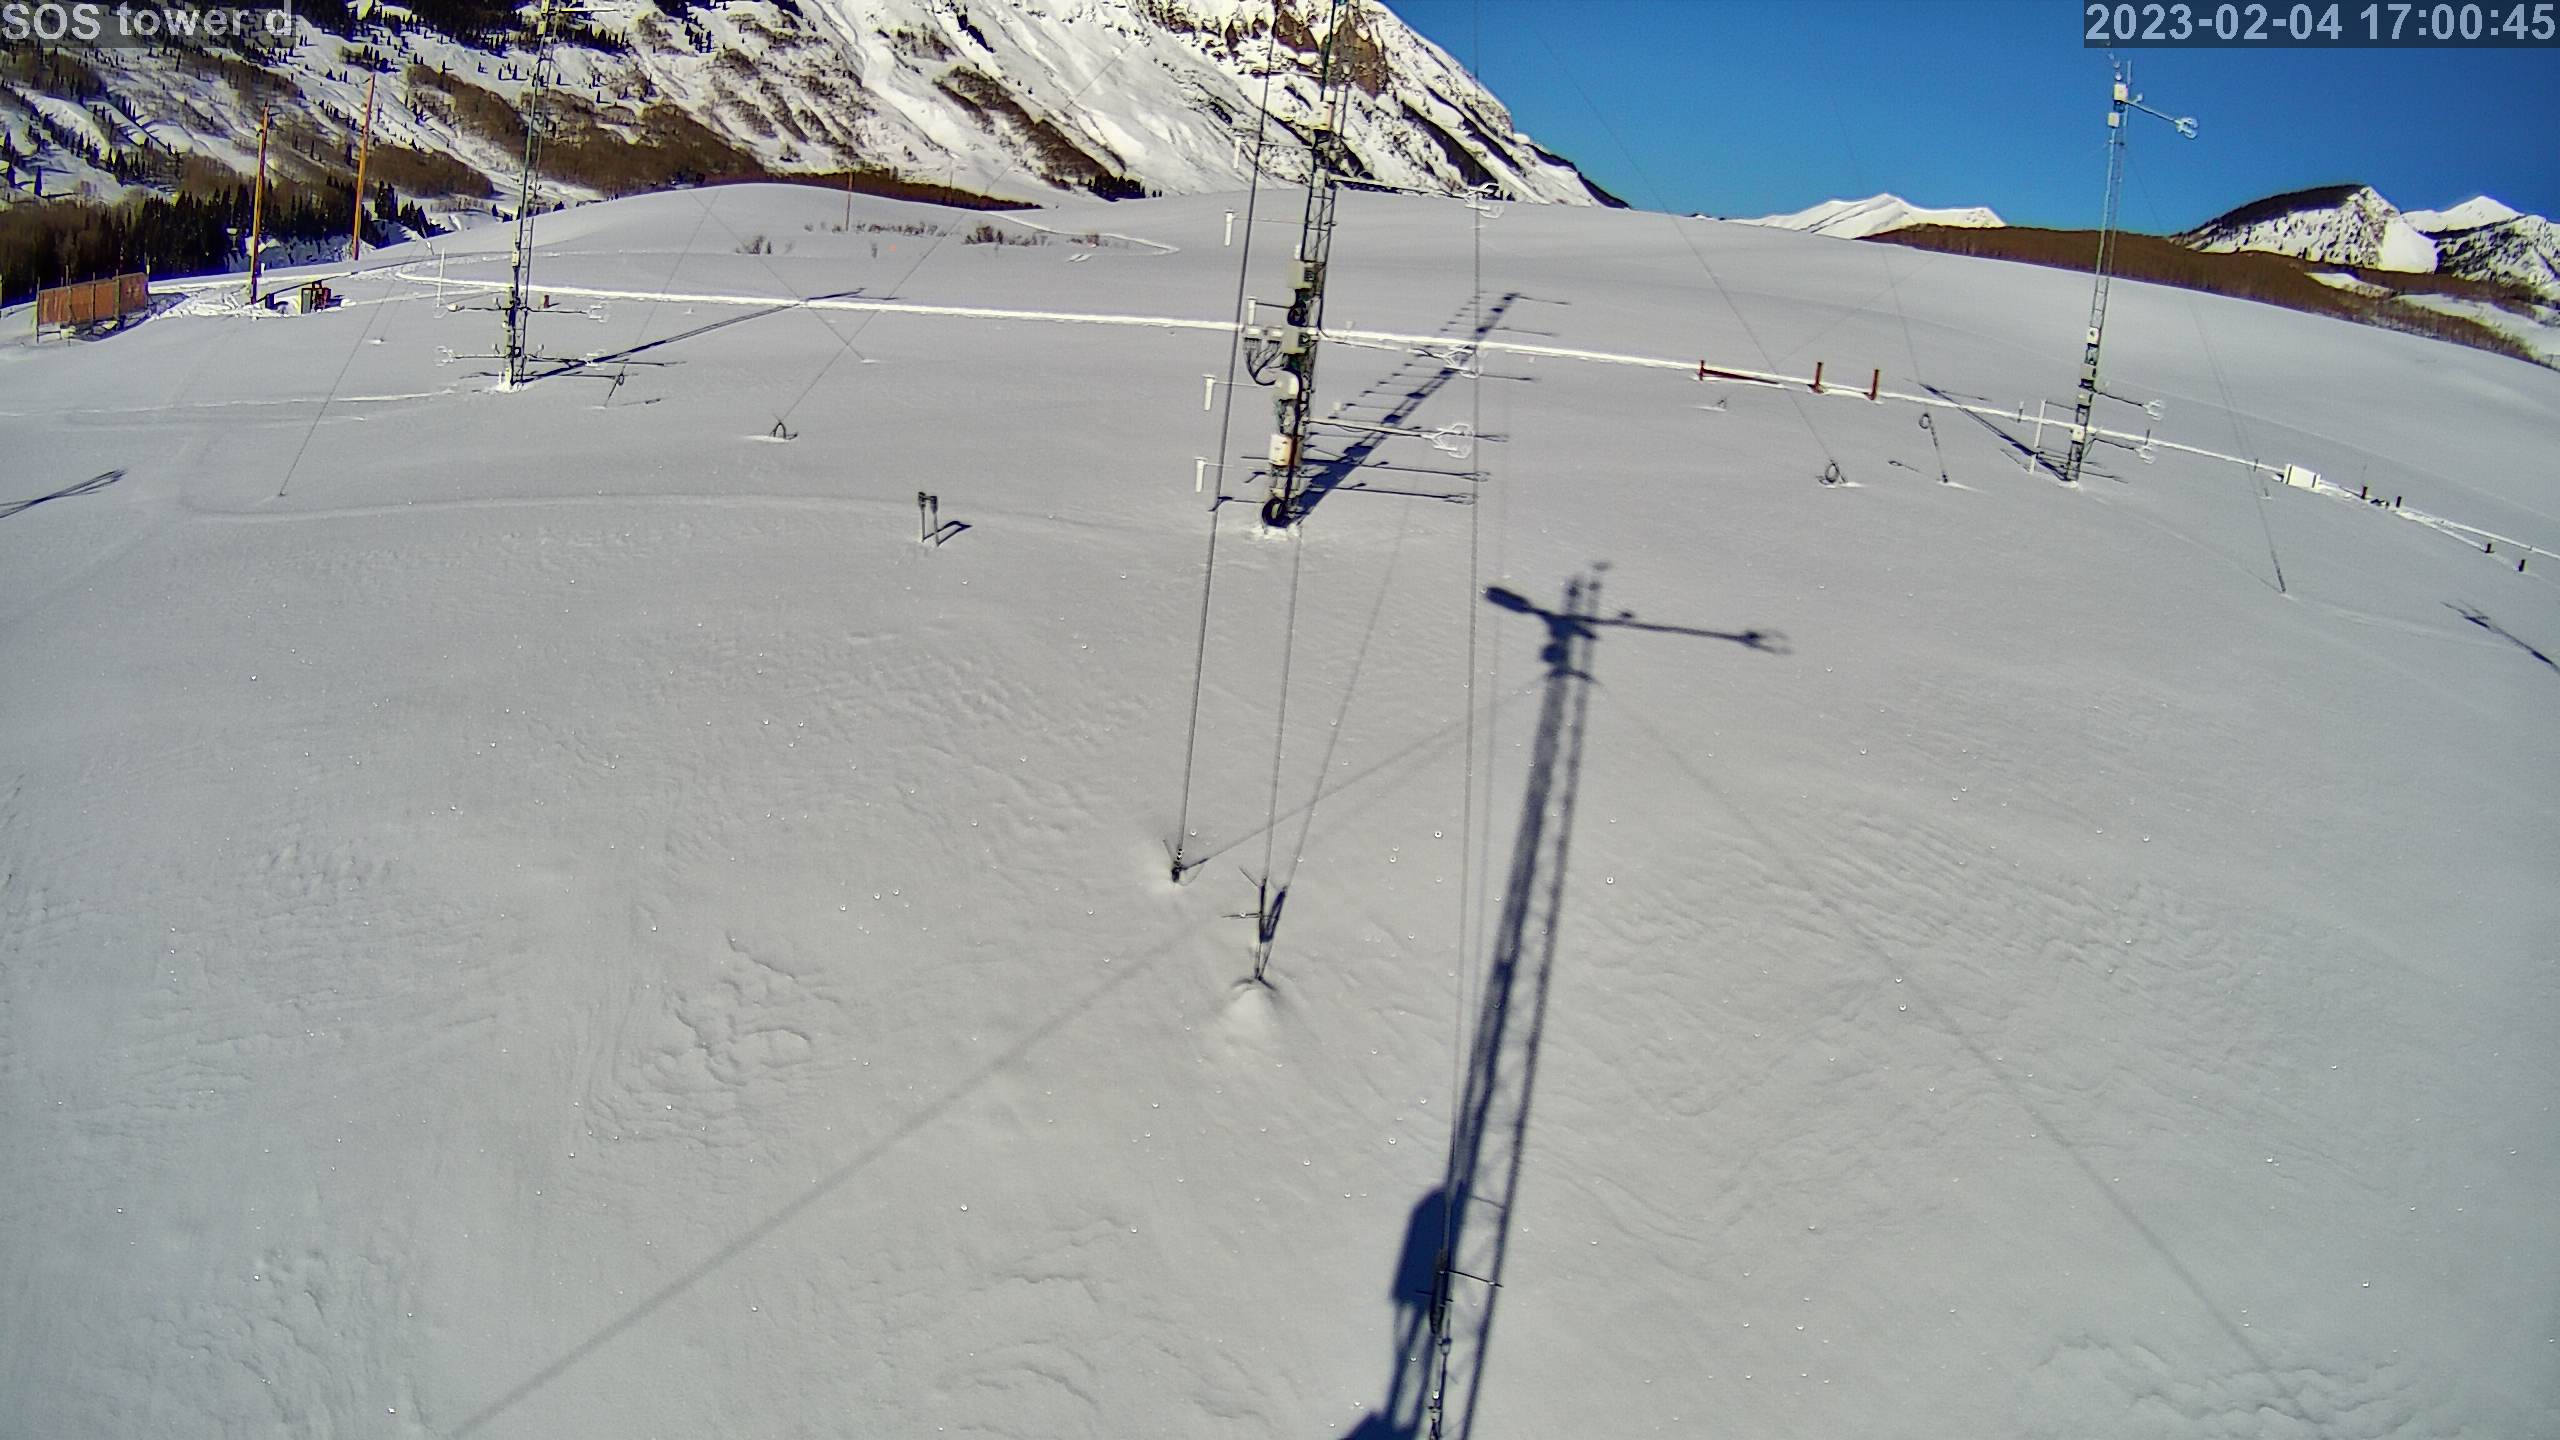
|
photo 2023020418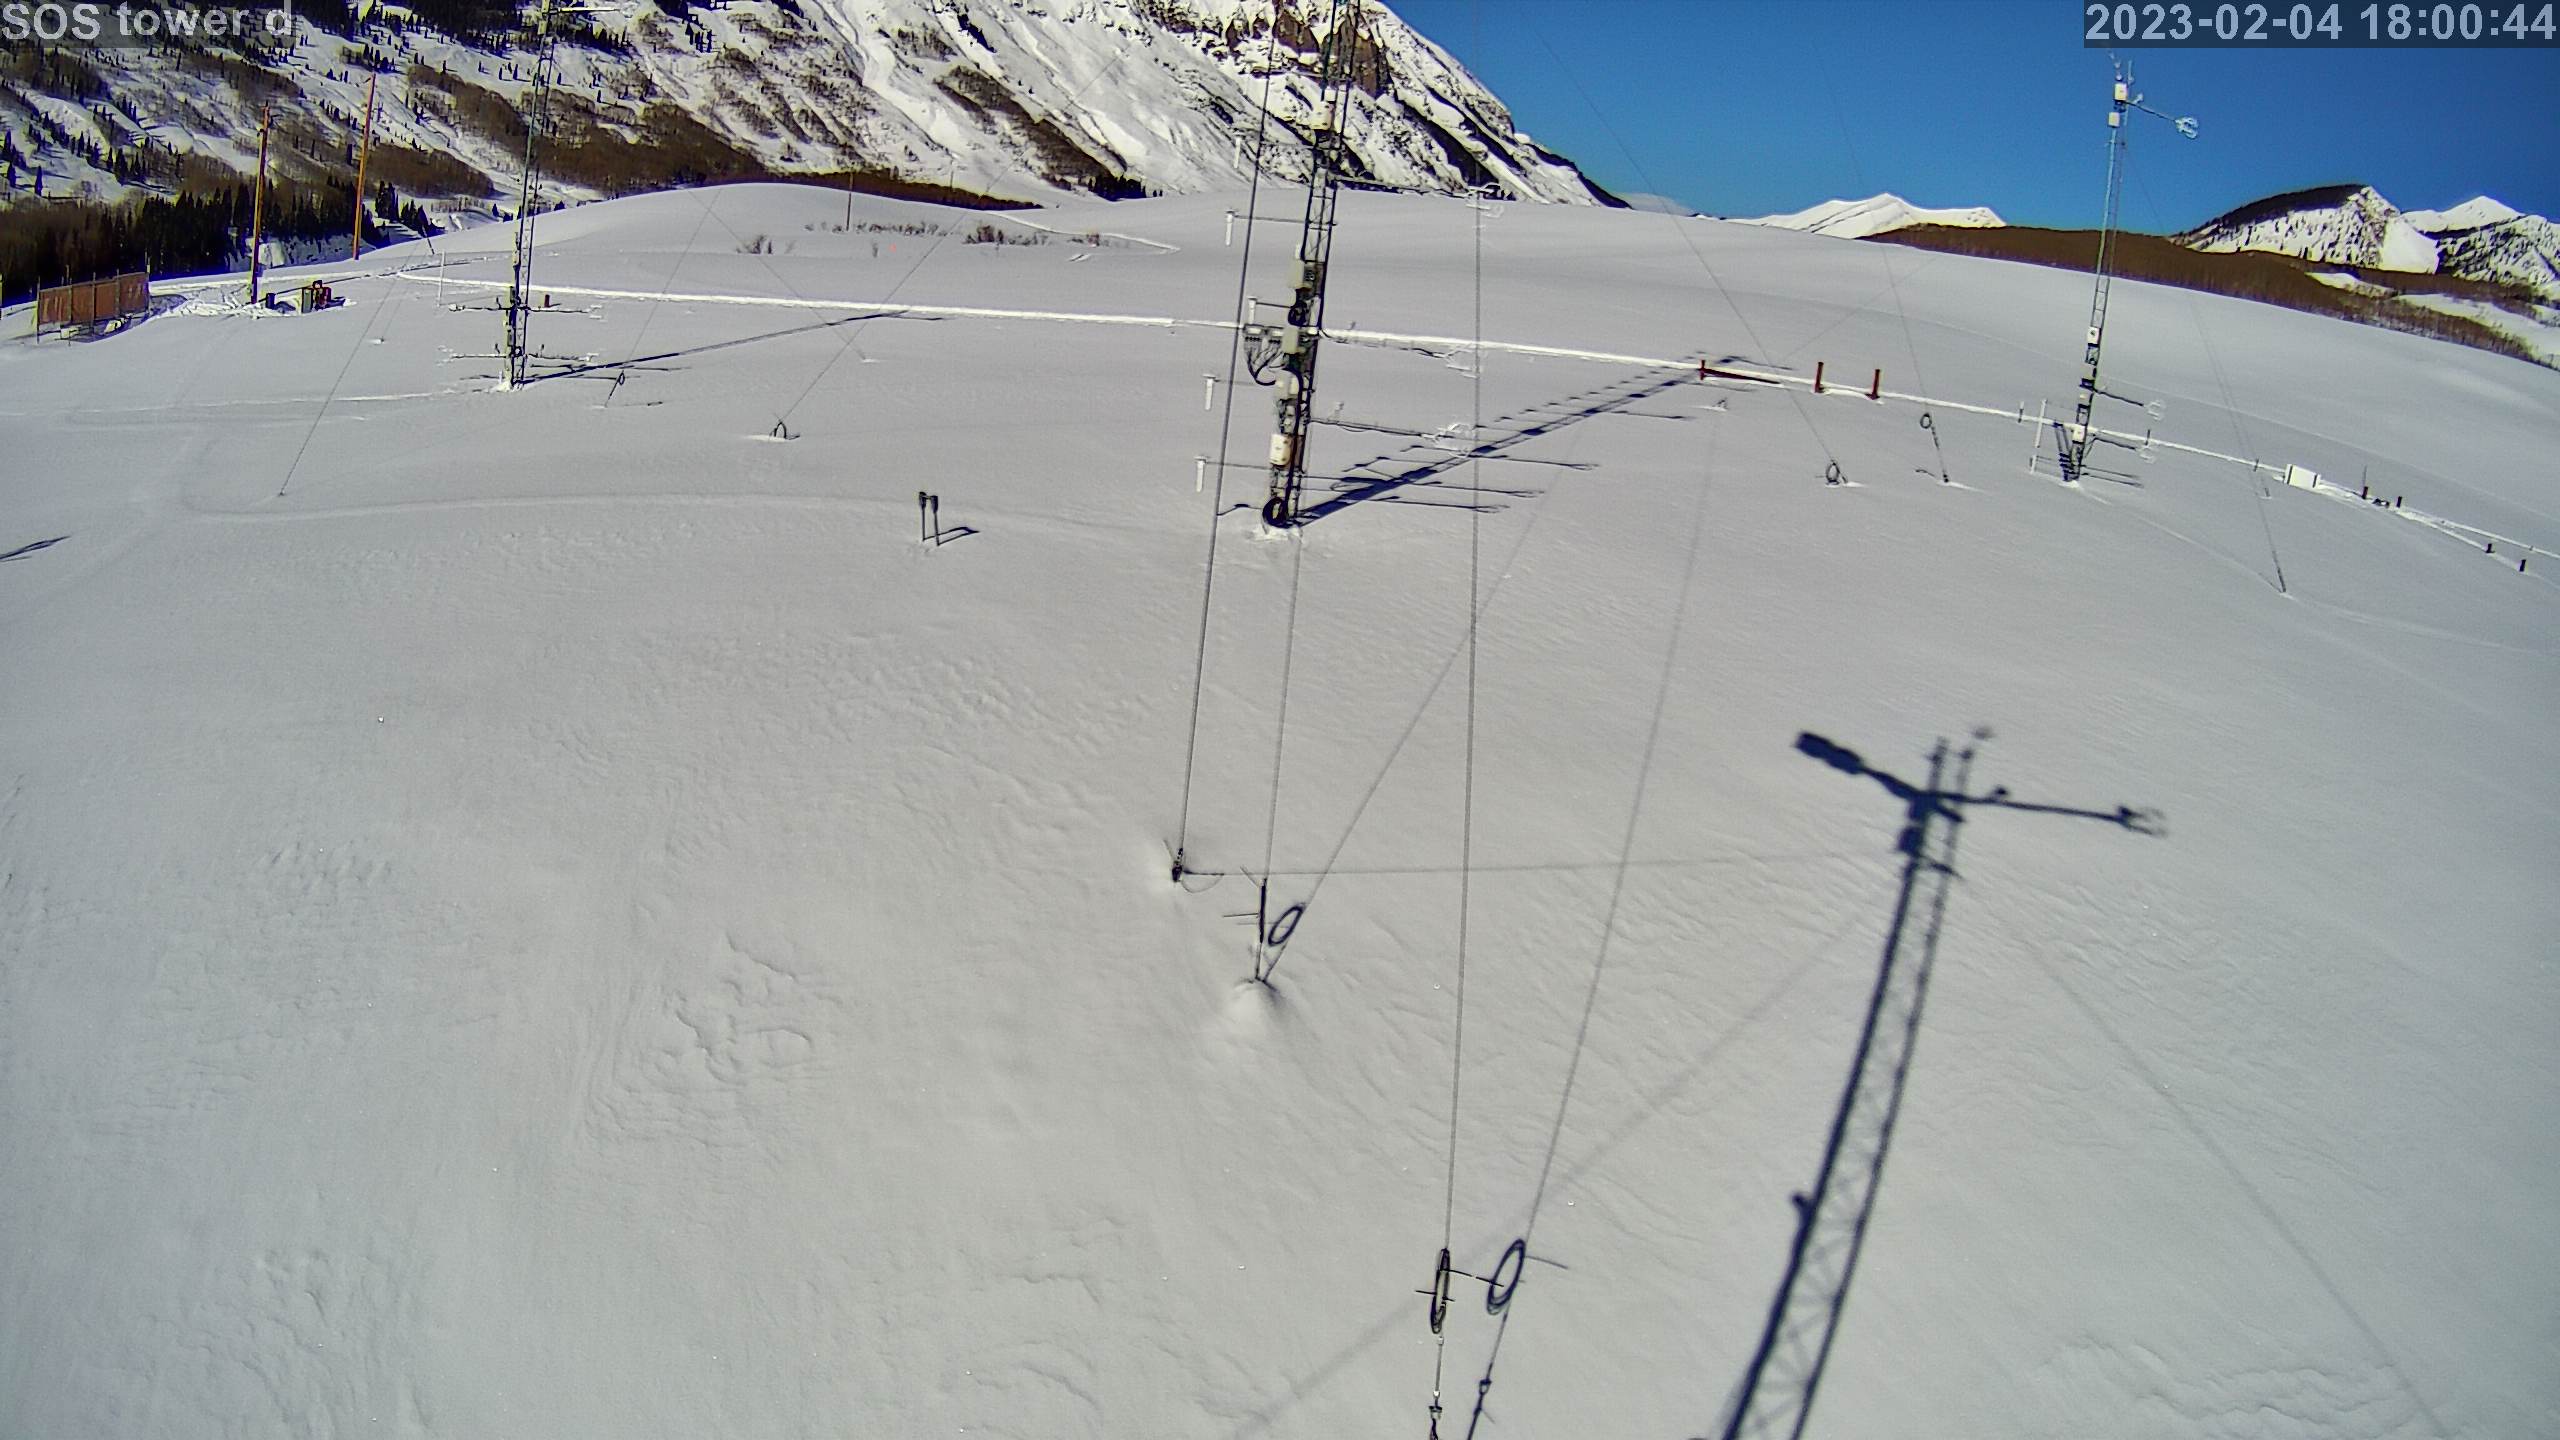
|
photo 2023020419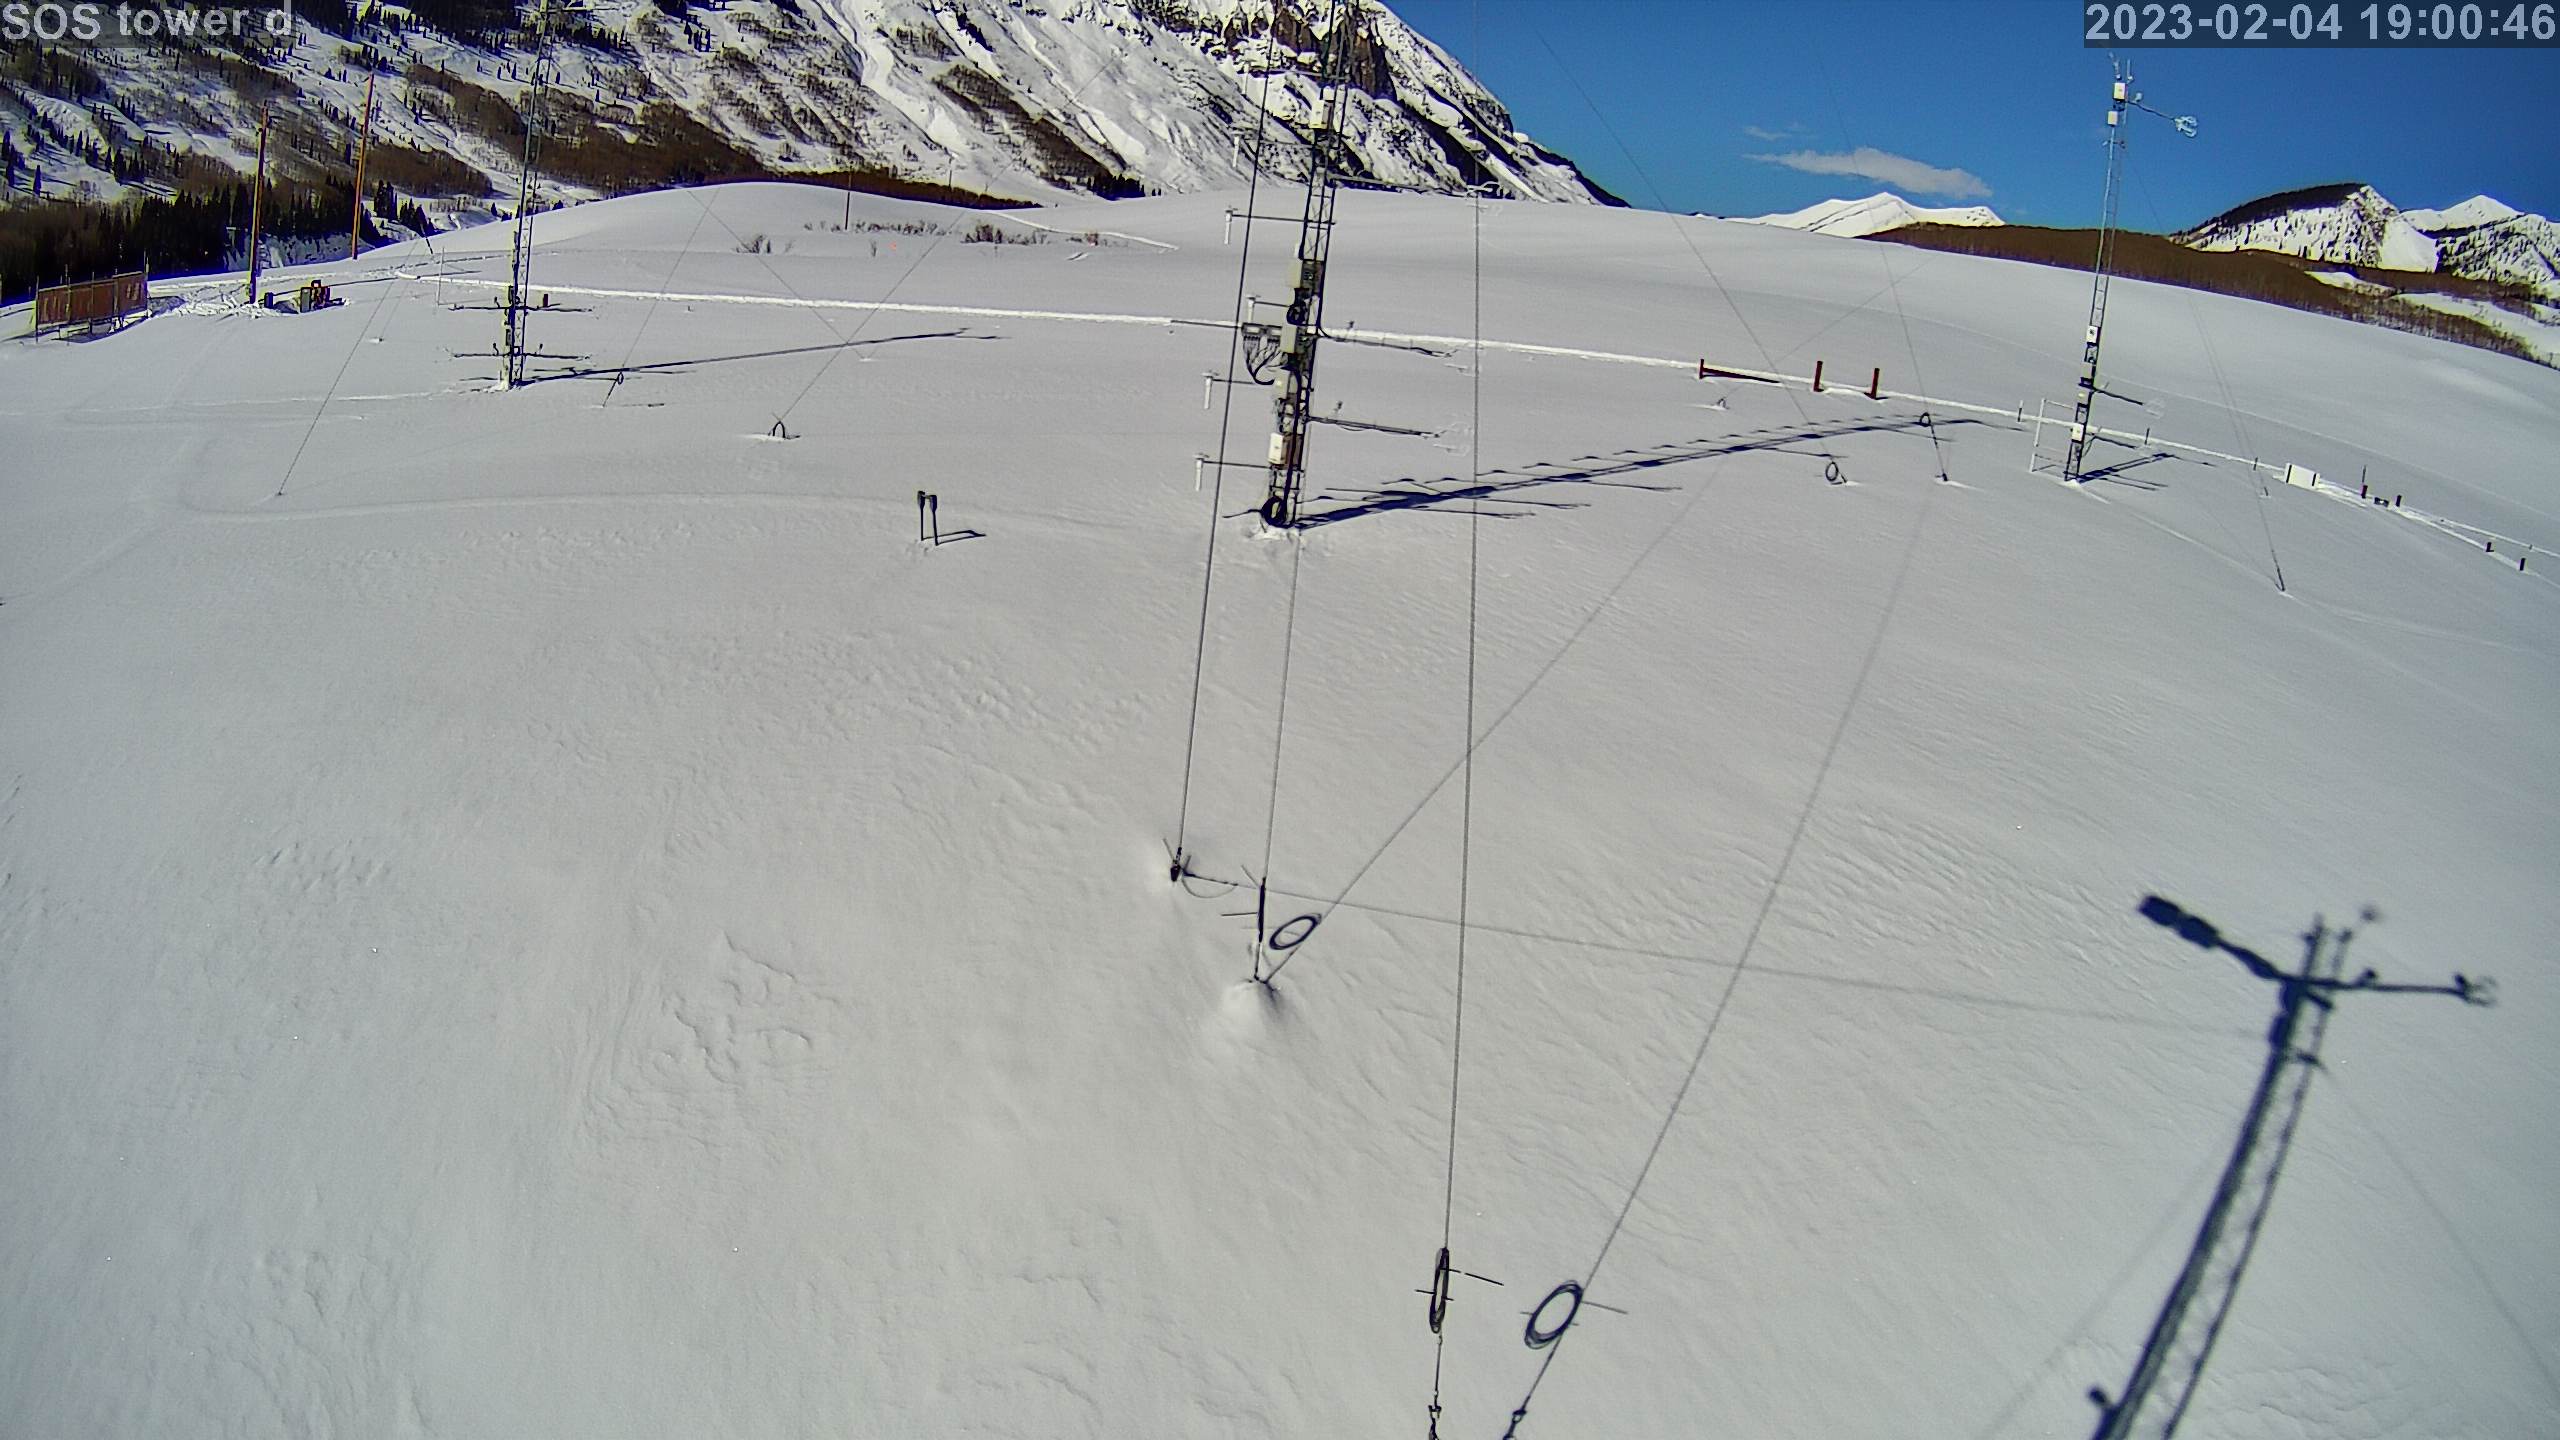
|
photo 2023020420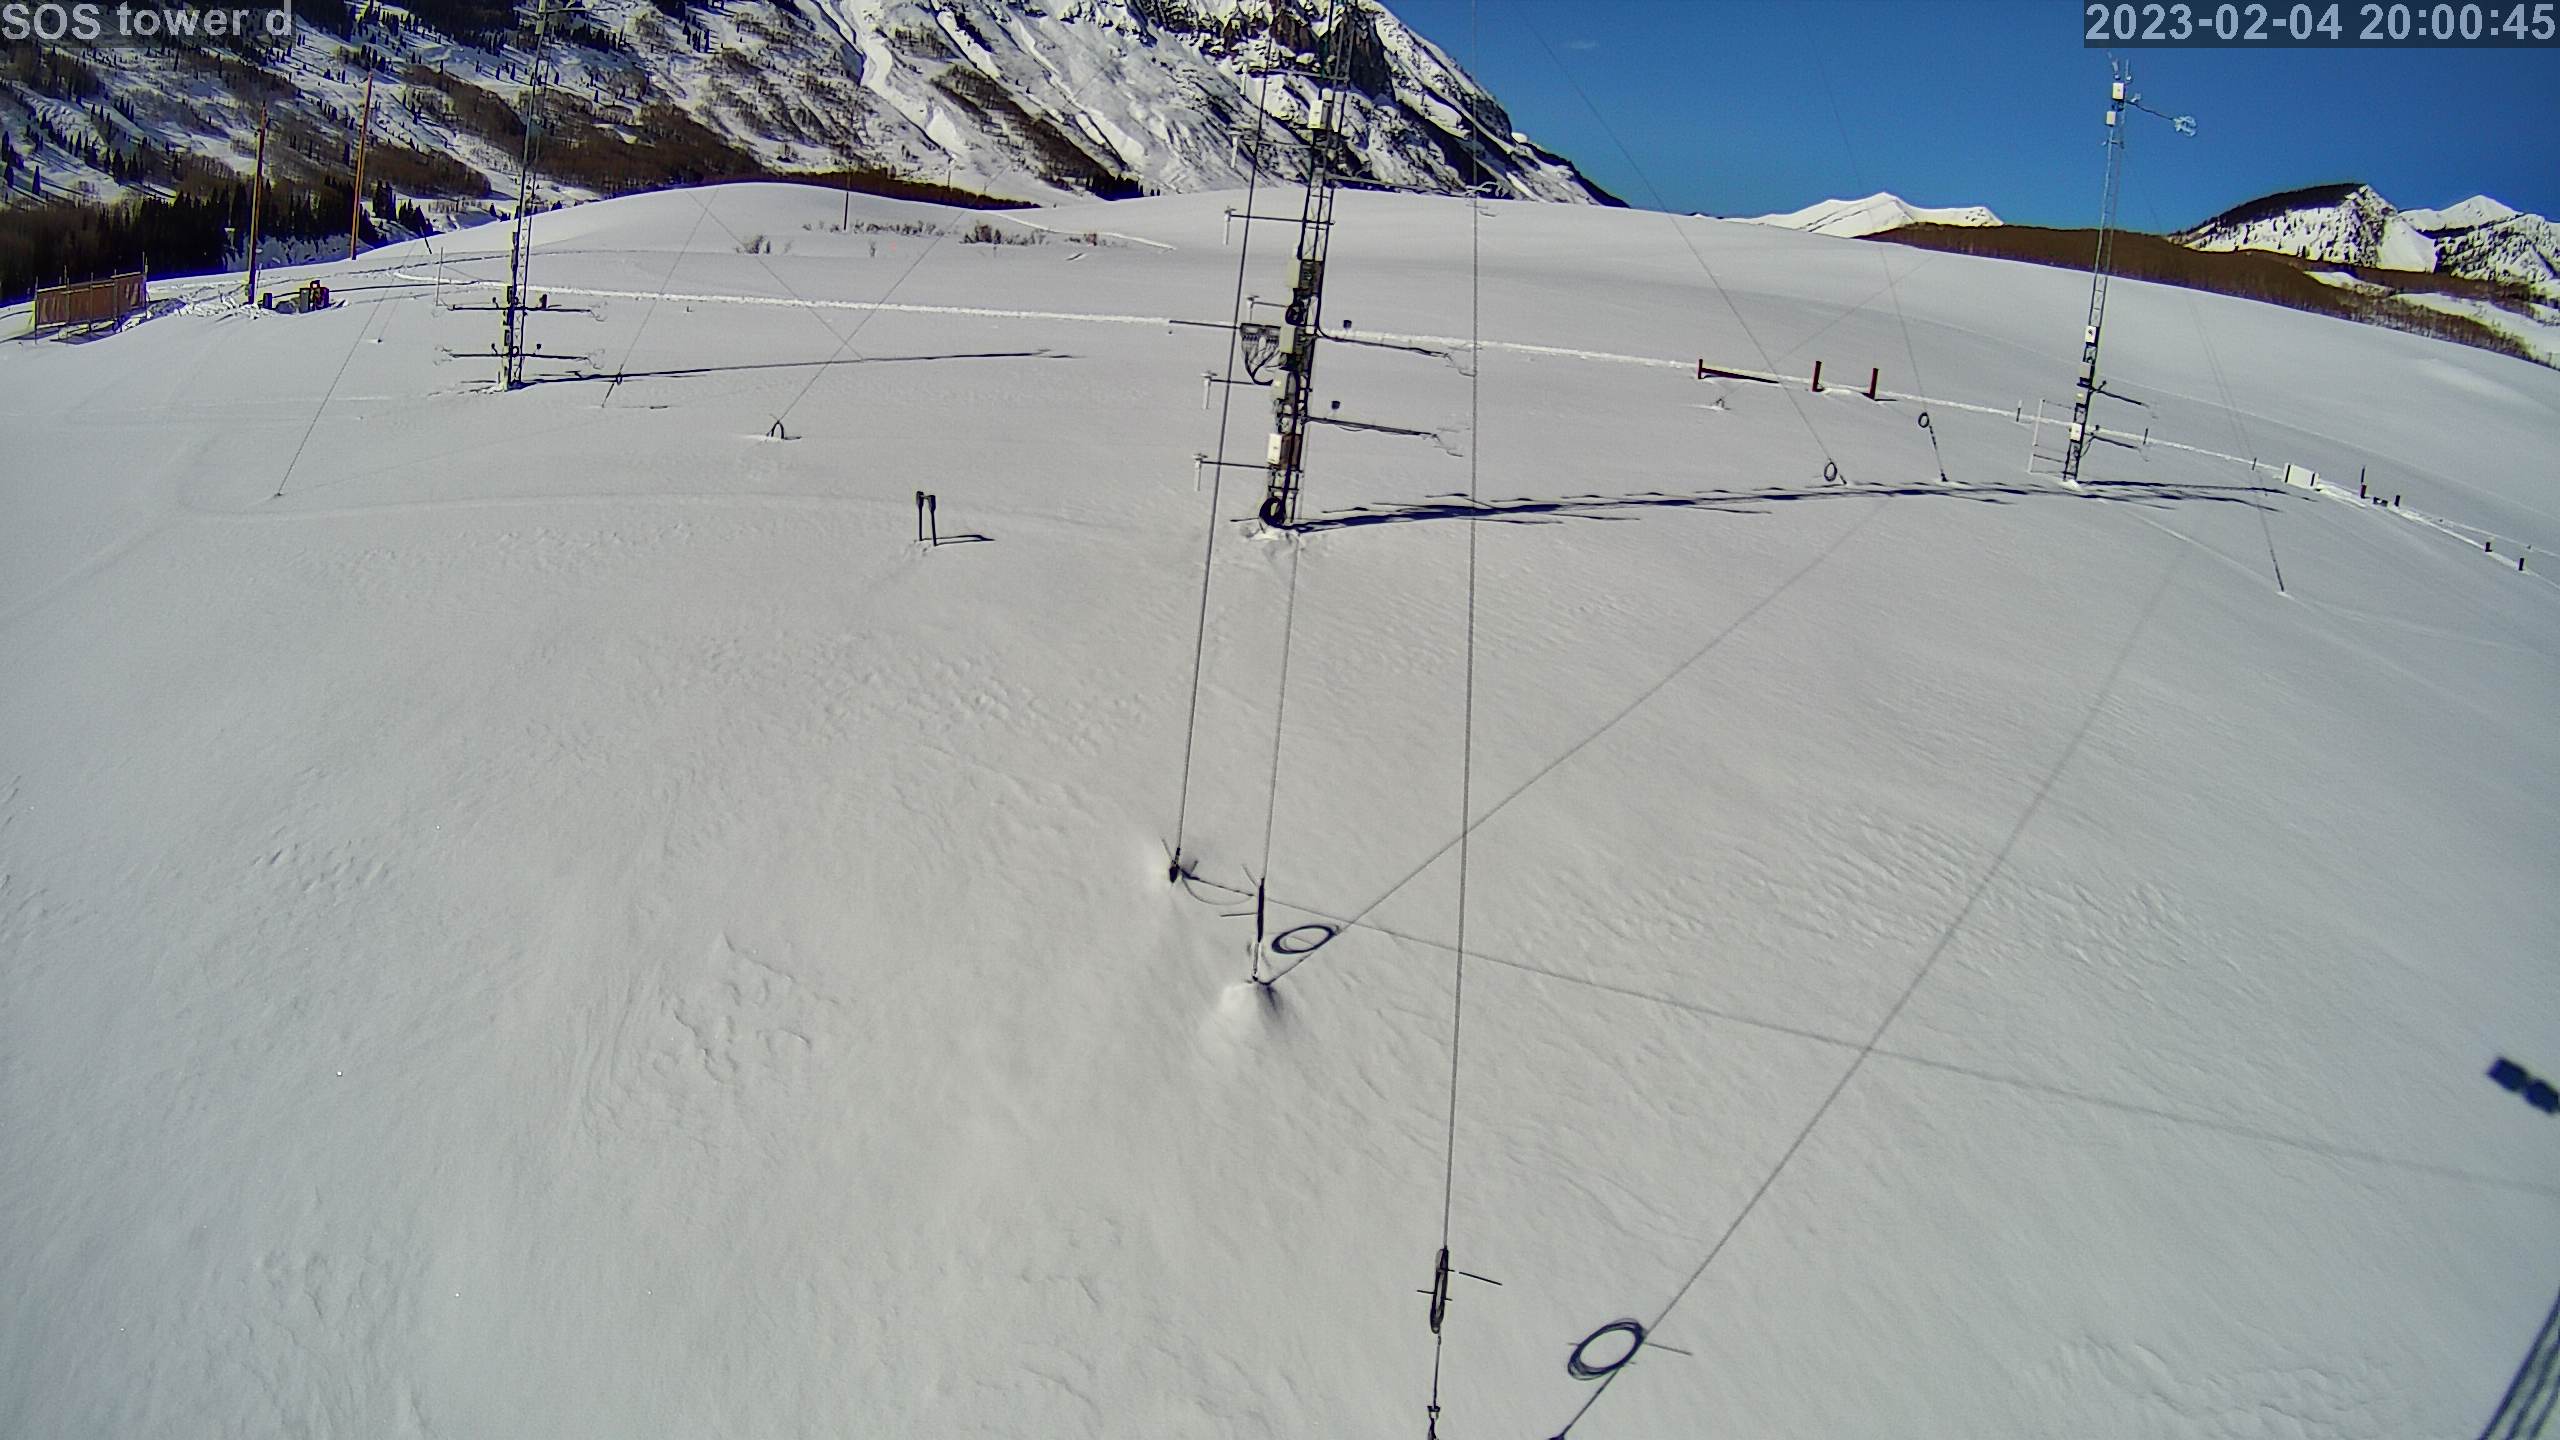
|
photo 2023020421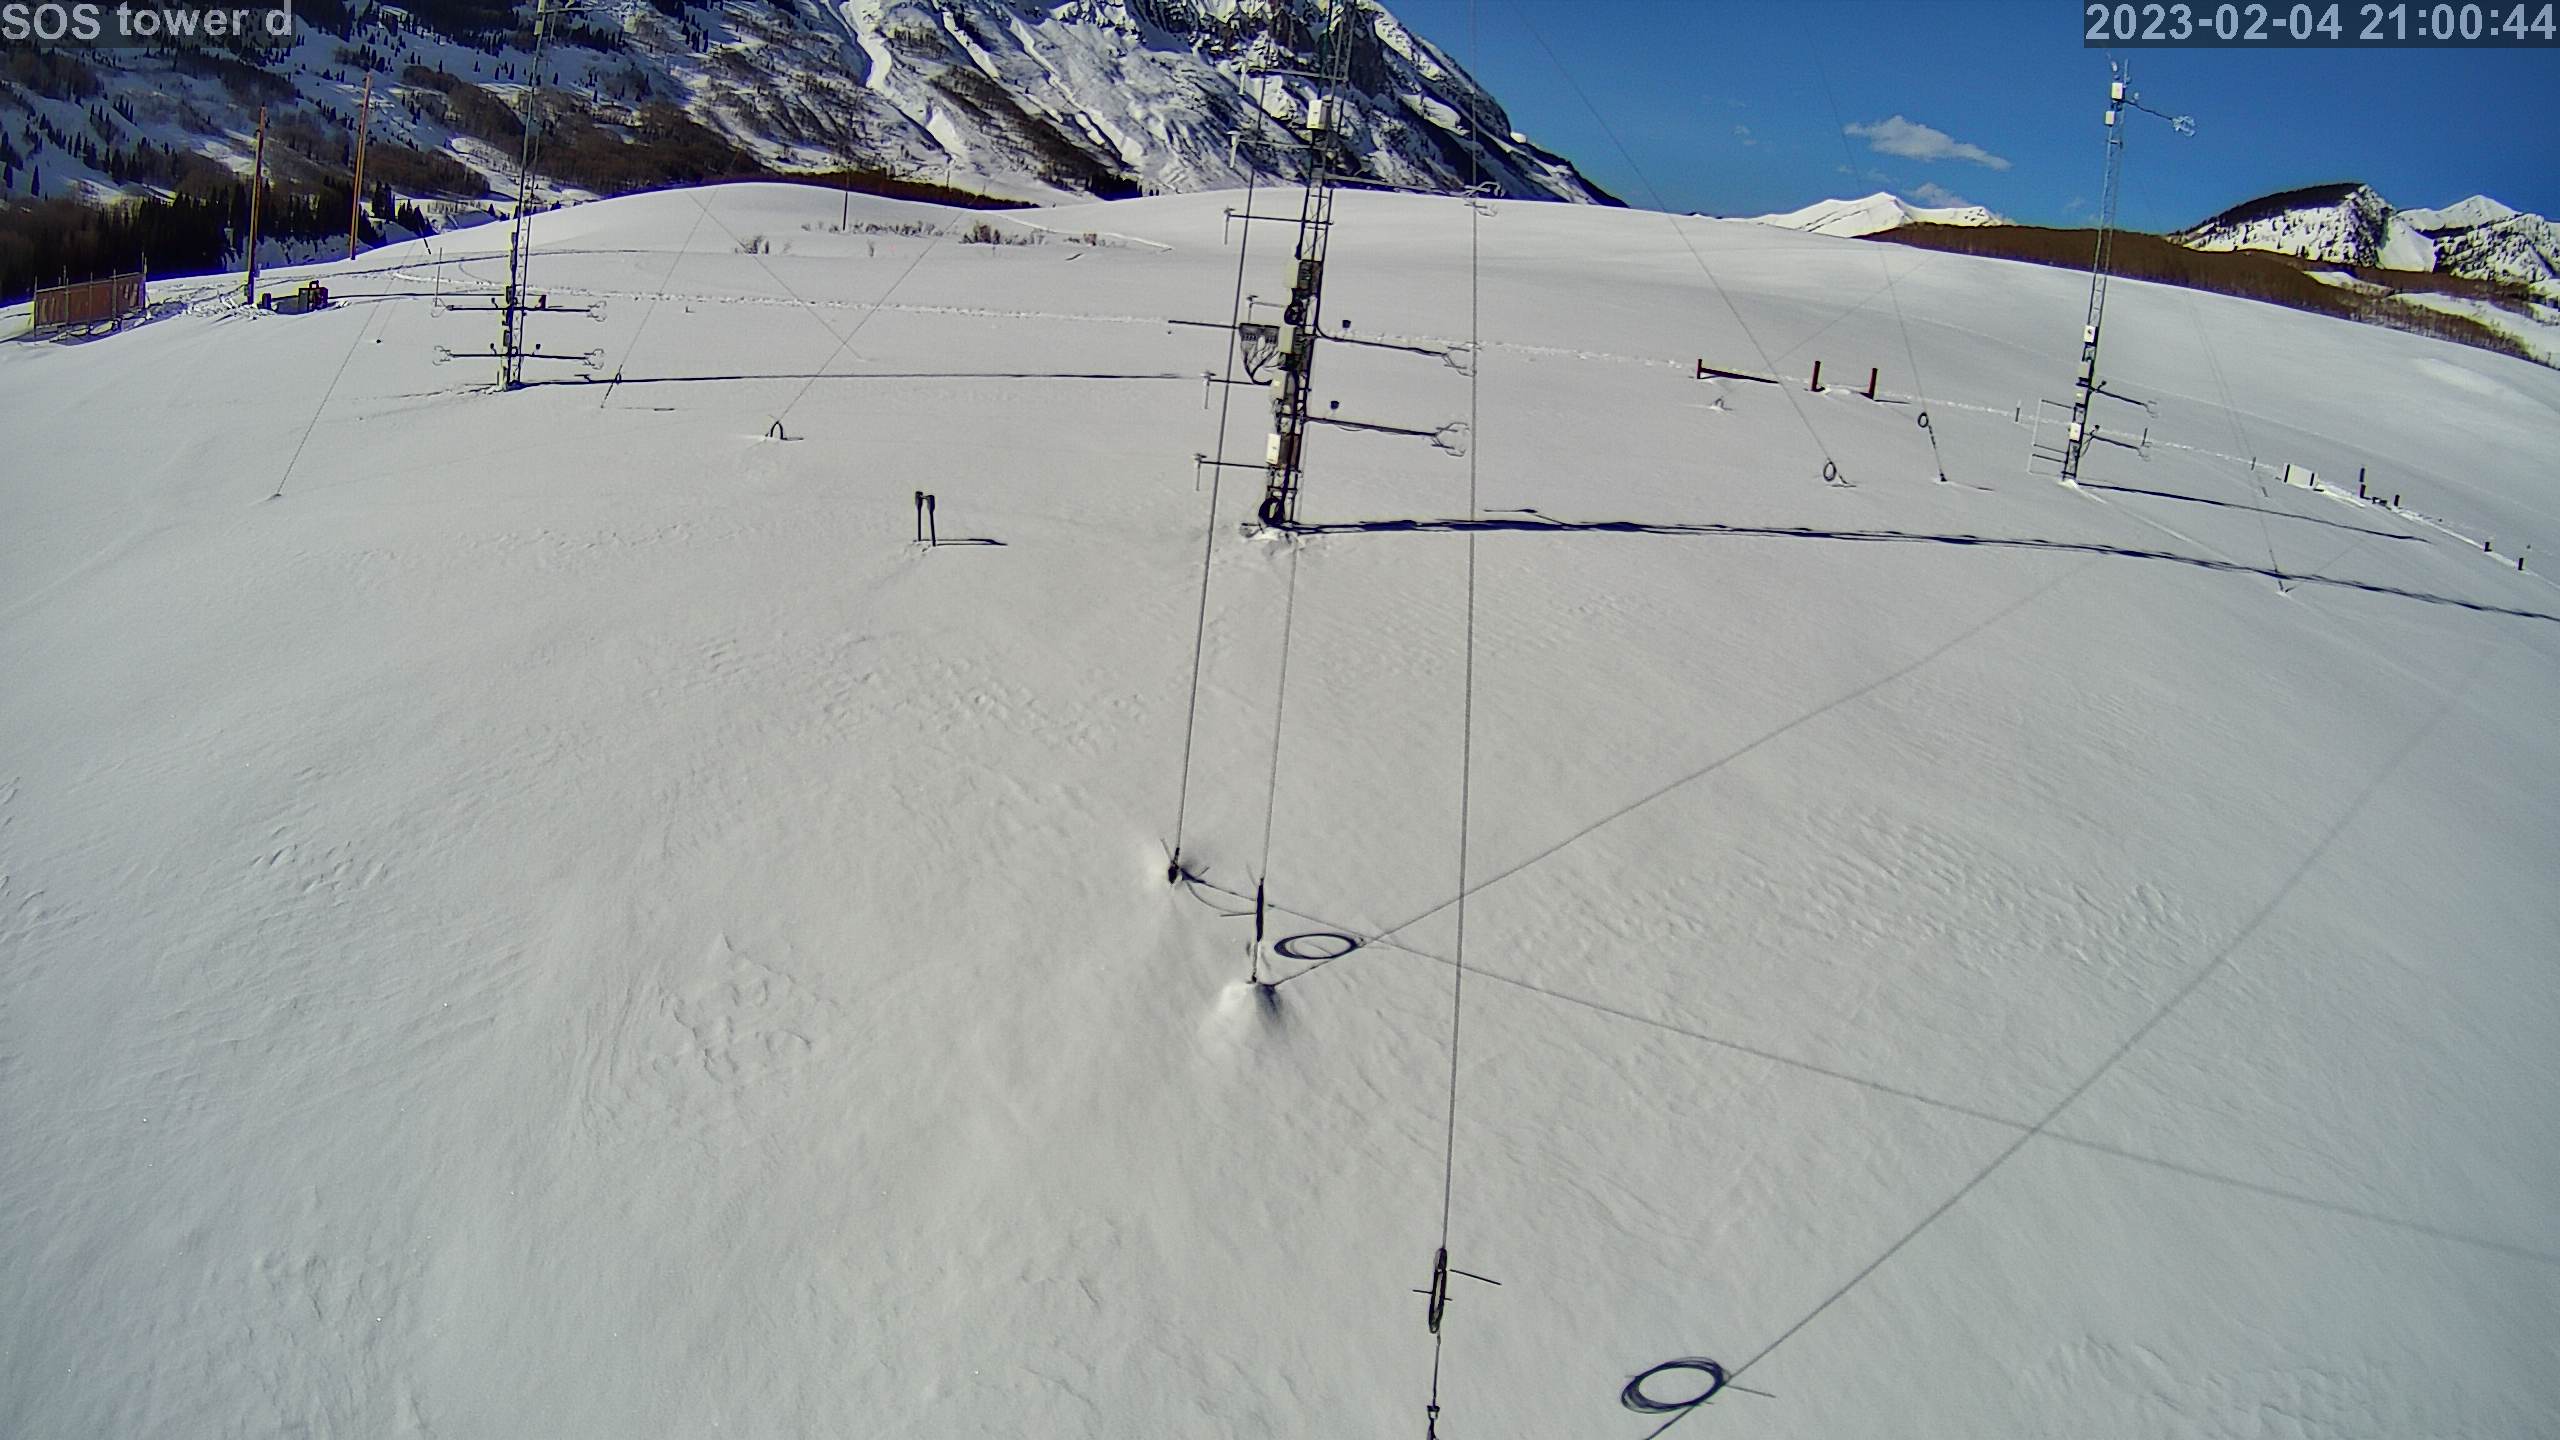
|
photo 2023020422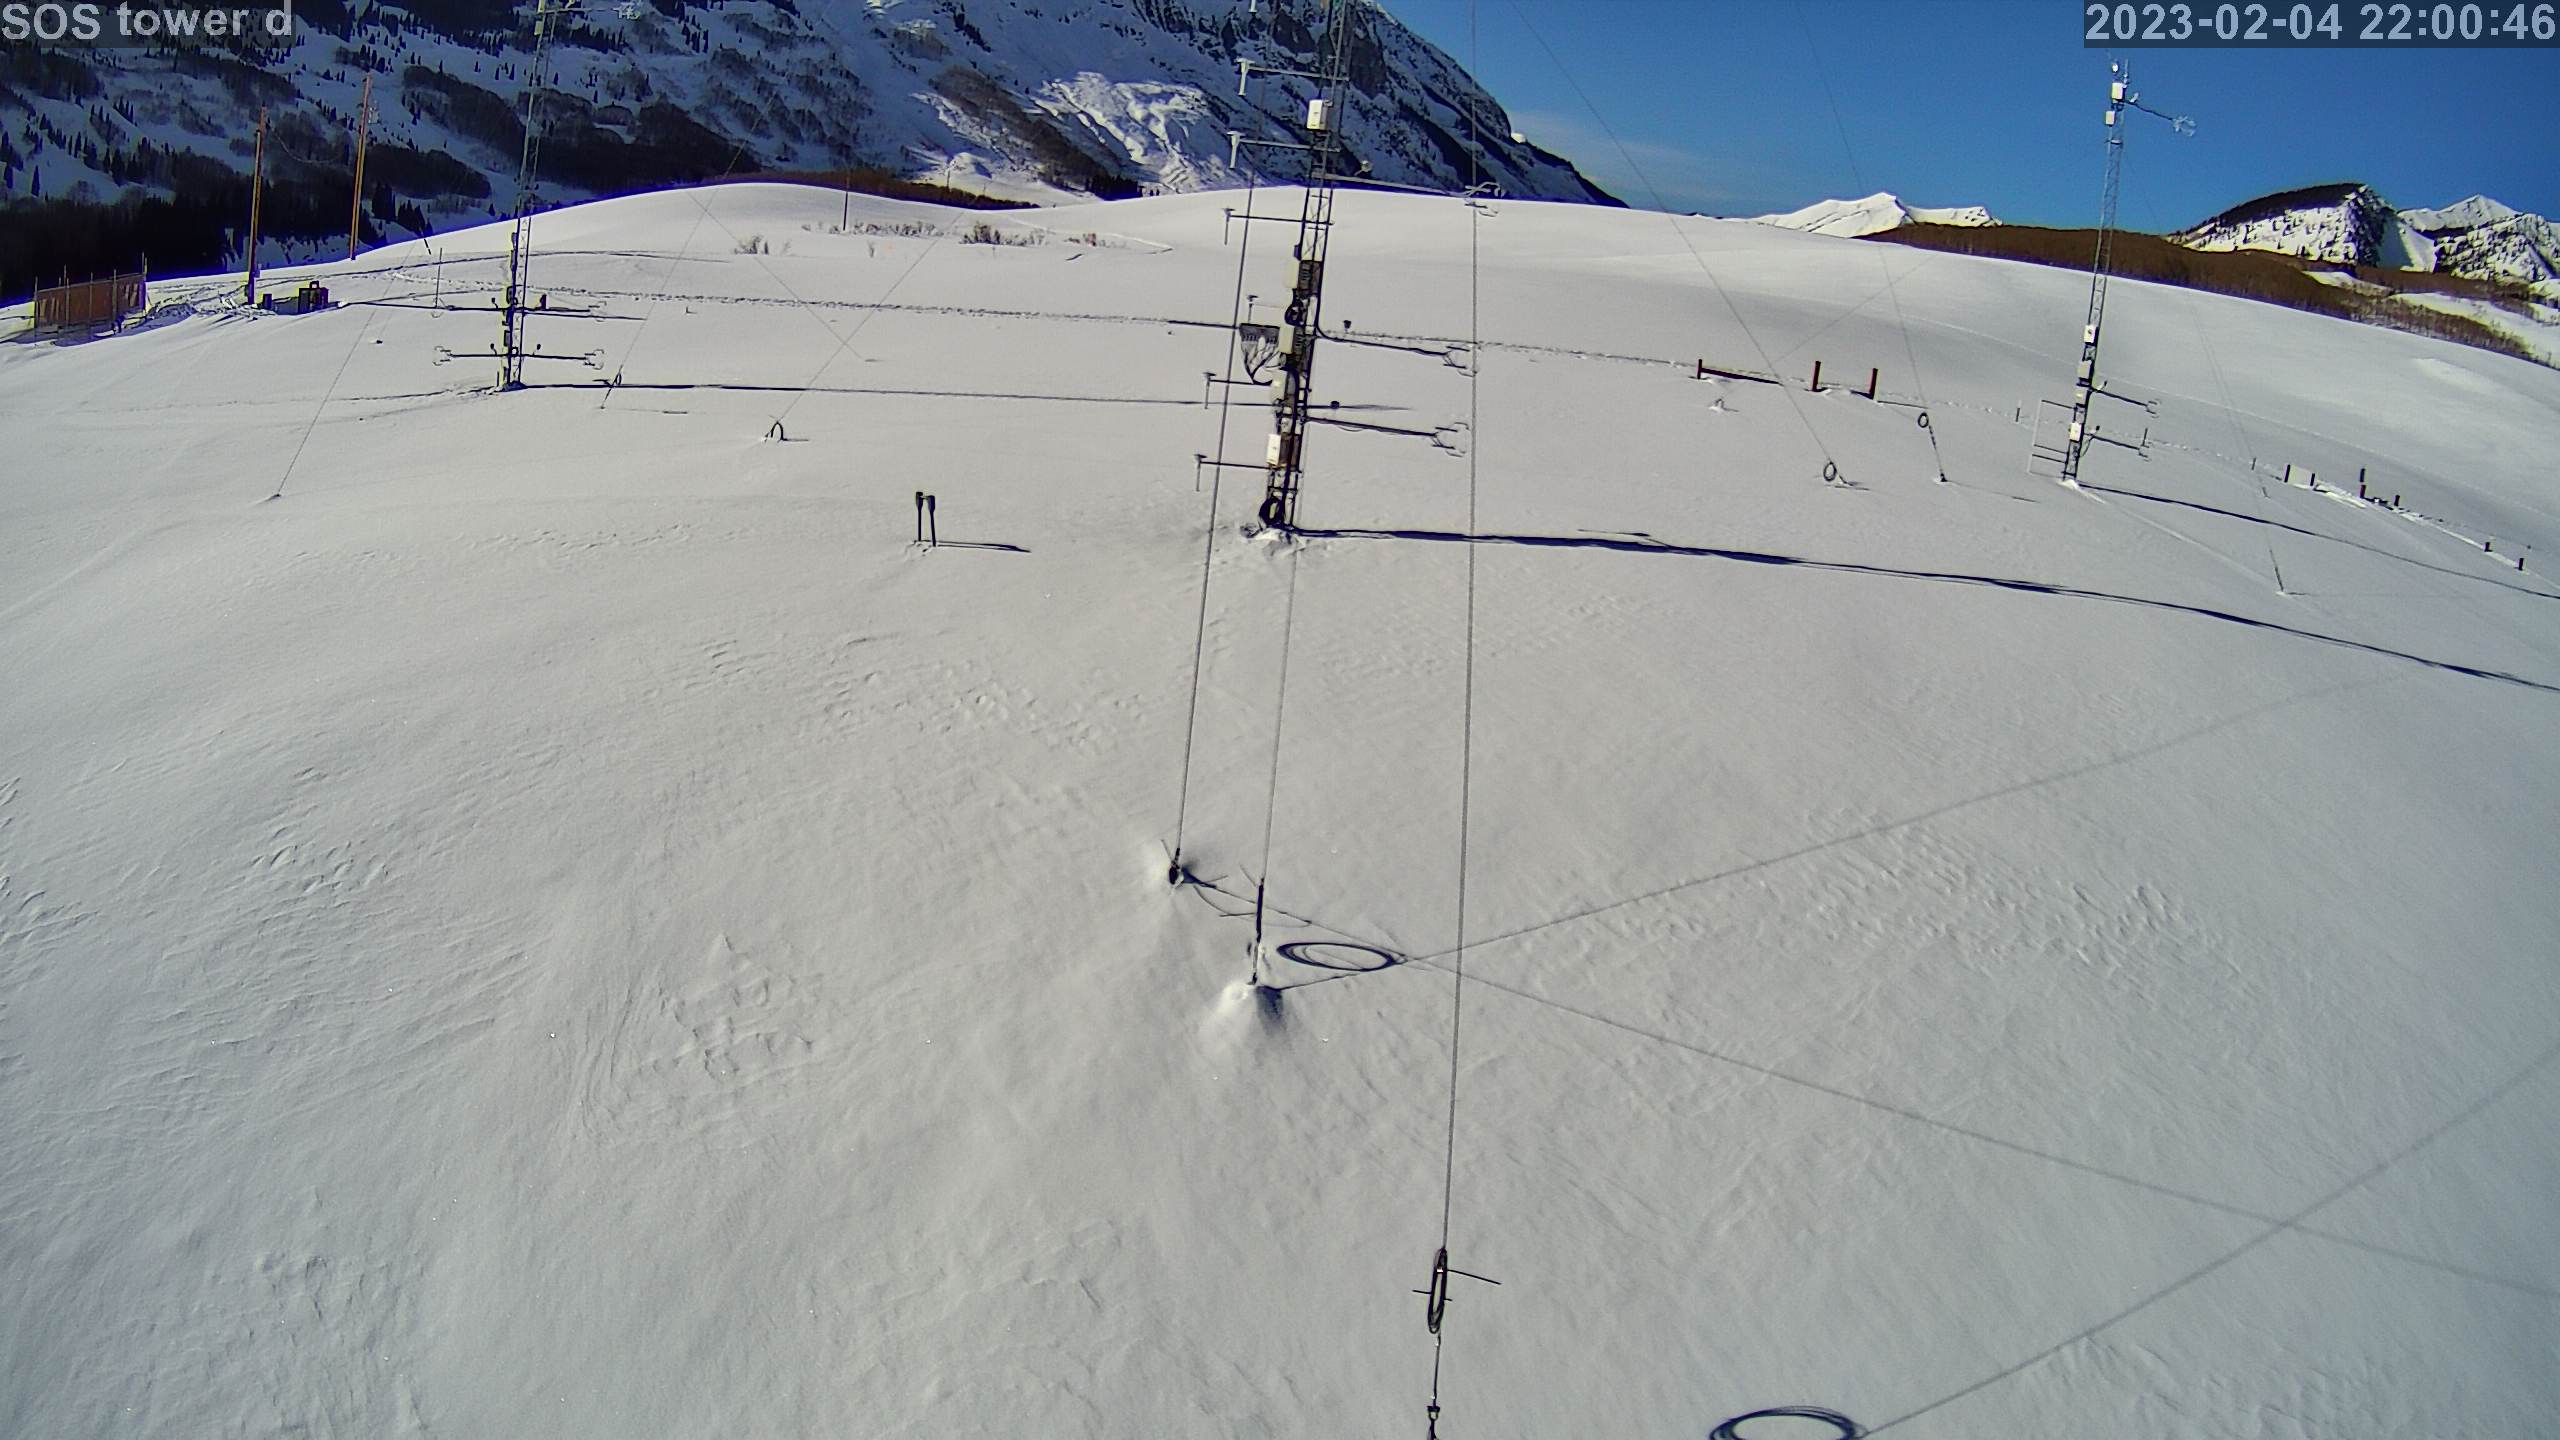
|
photo 2023020423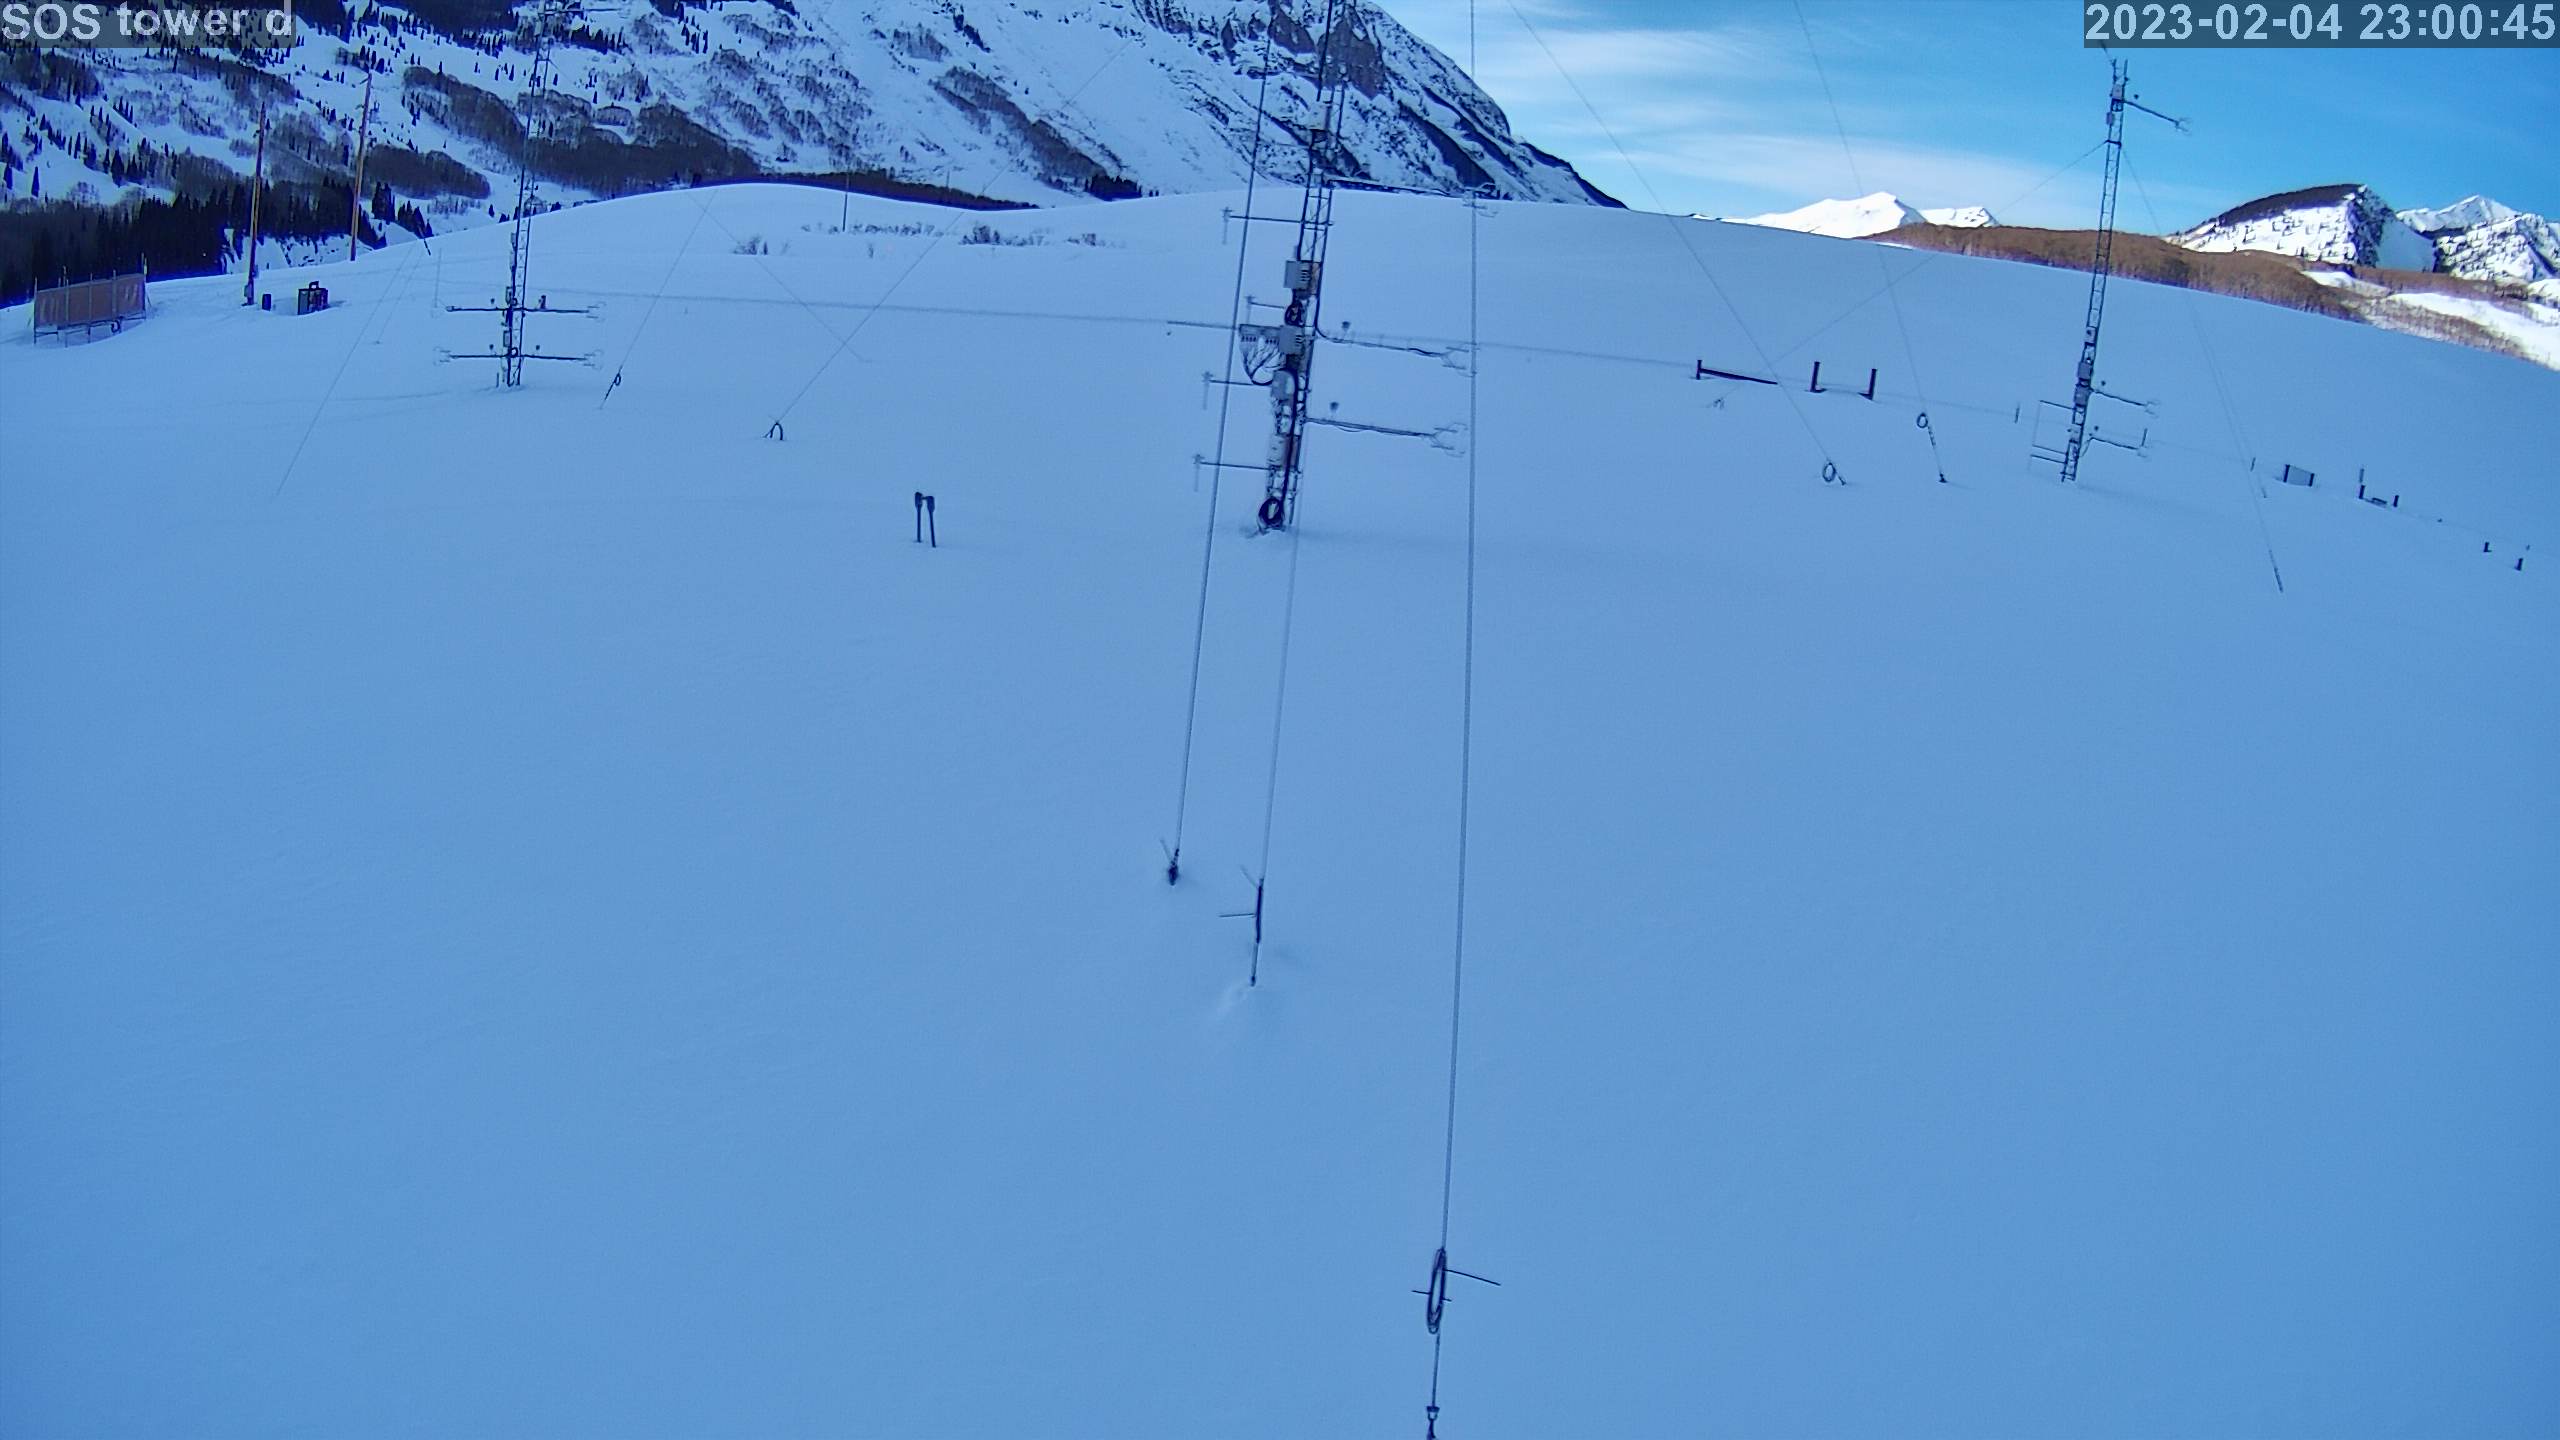
|