| Previous day | Select day | Next day |
The most recent plots are generally updated every 15 minutes. Use the browser reload button to make sure you are seeing the latest version of a plot.
In order to distinquish the traces on the vertical profile plots, a slight offset in X is added to some traces. This is indicated by a "(n)" in the legend for the trace.
If you right-click on an image, most browsers will provide a menu to download or display the plot in another window.
photo 20230203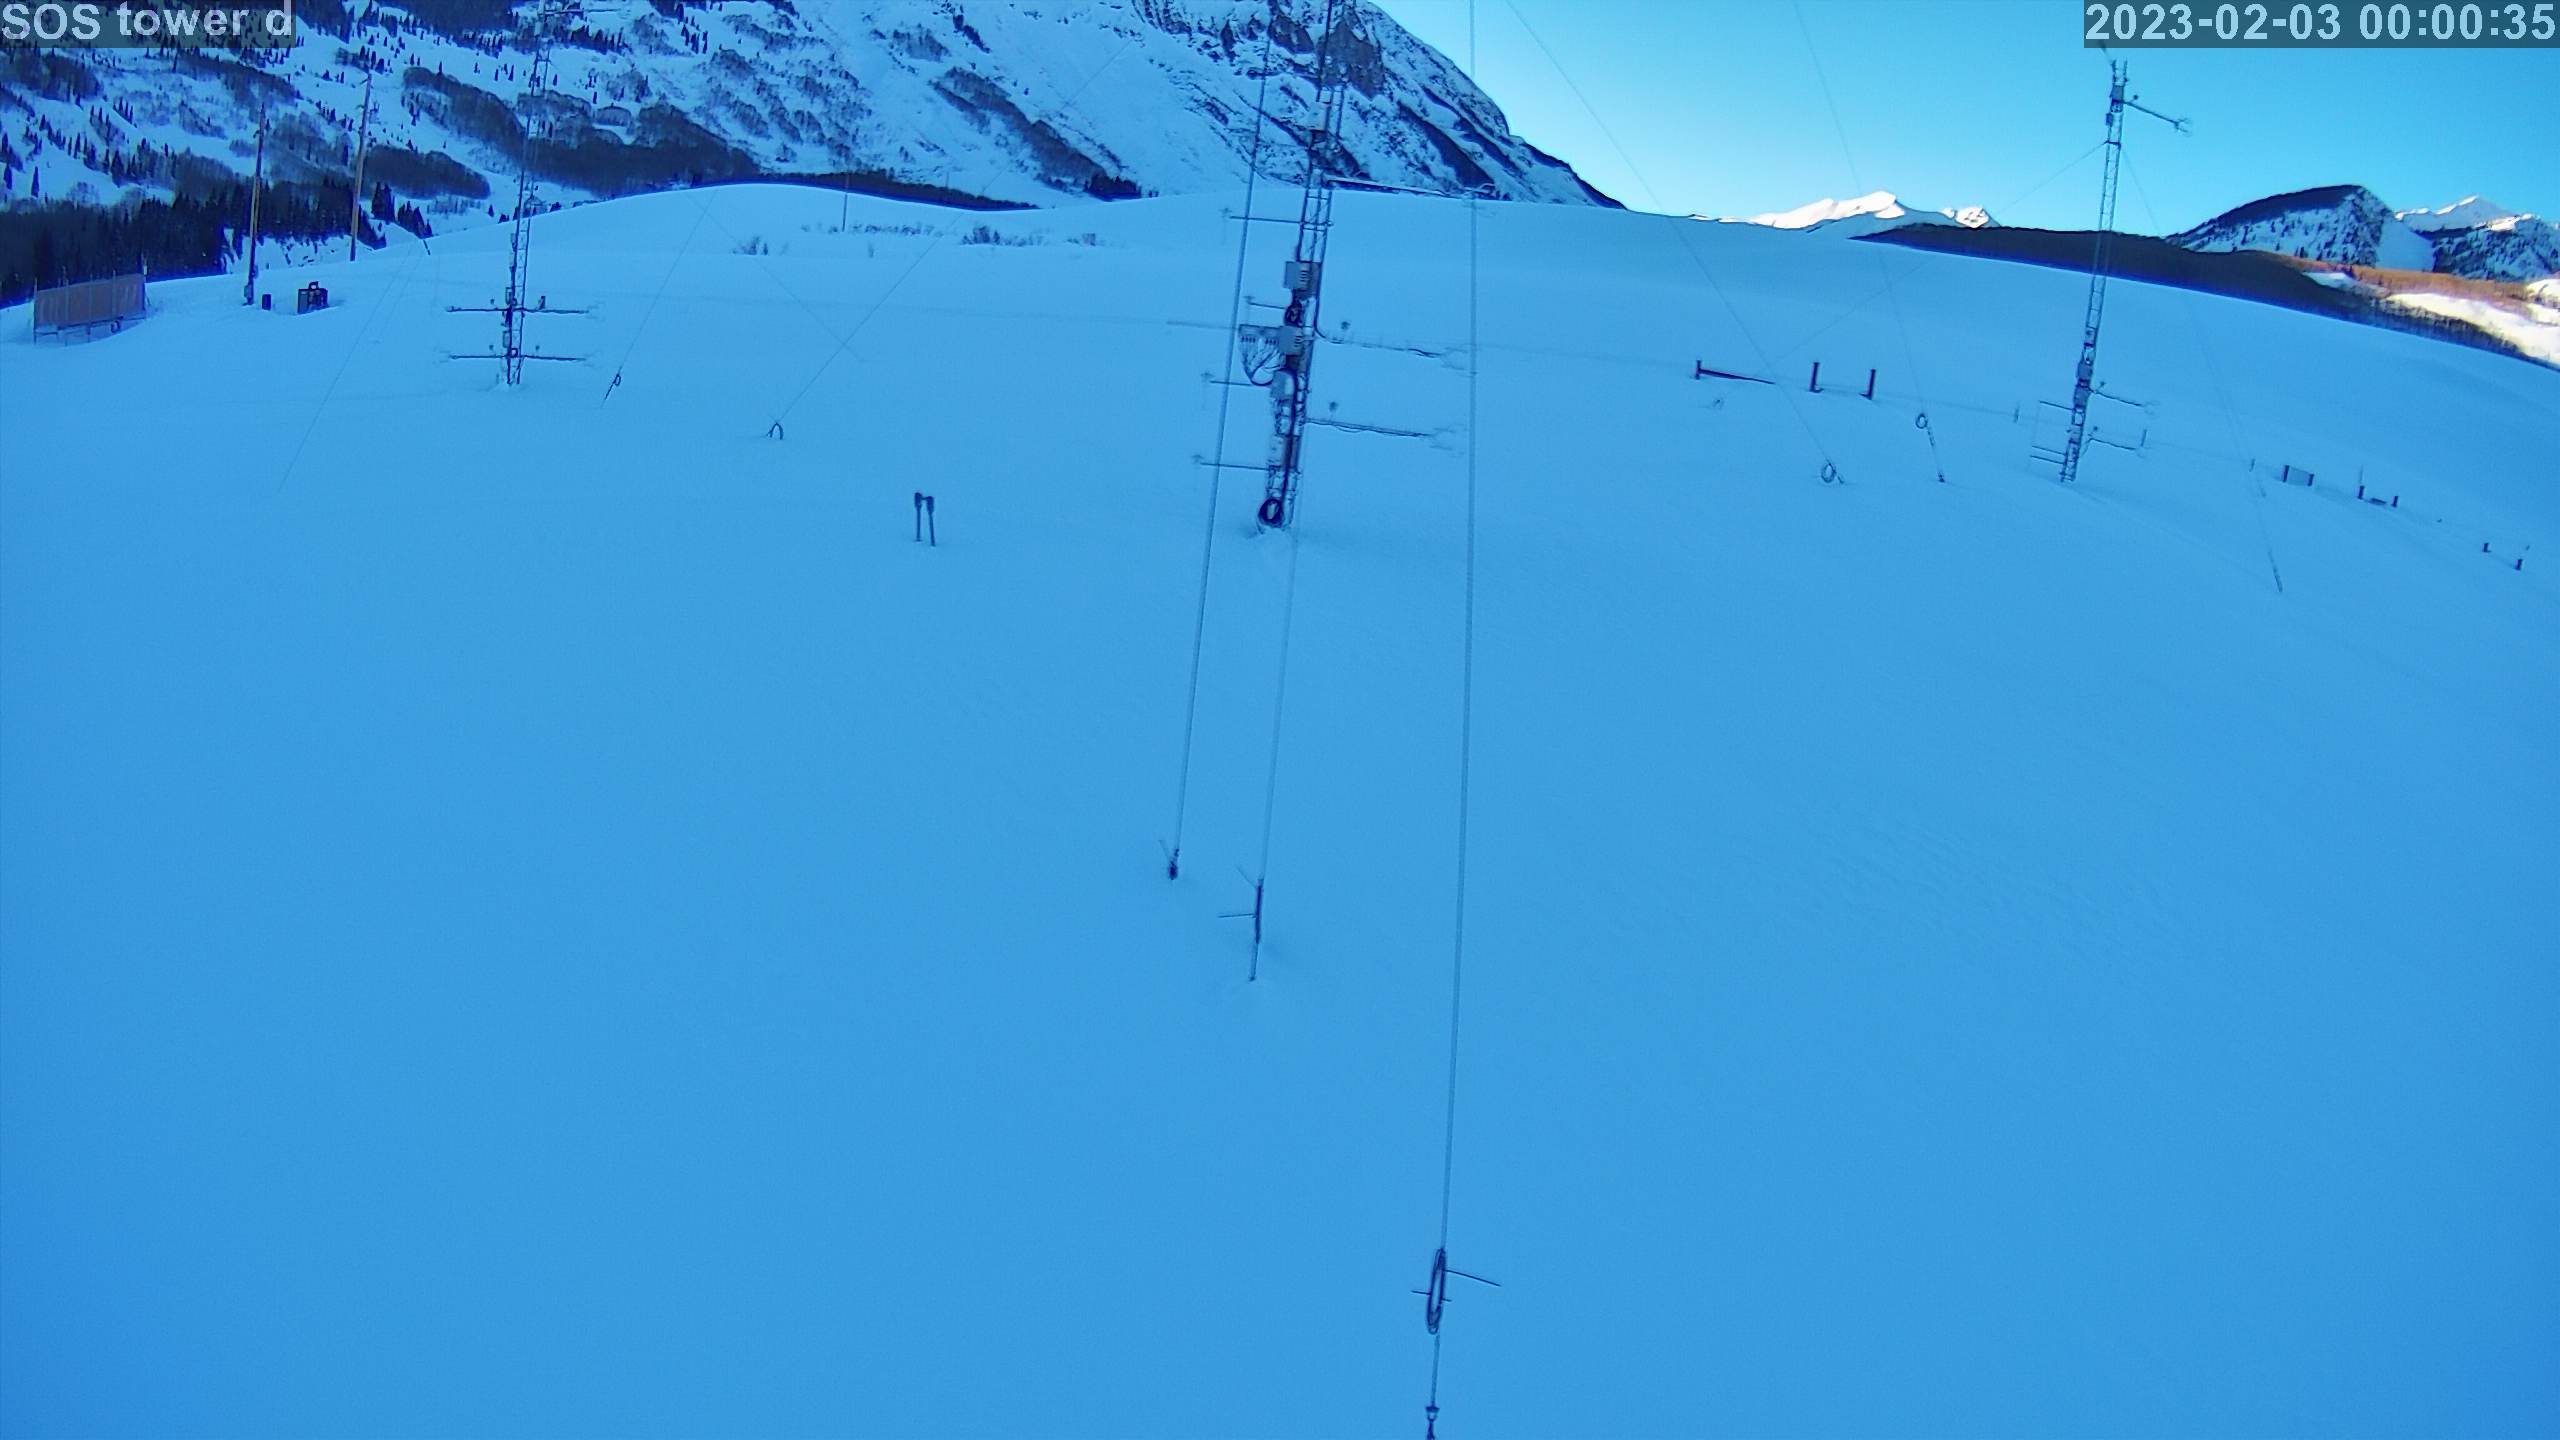
|
photo 2023020301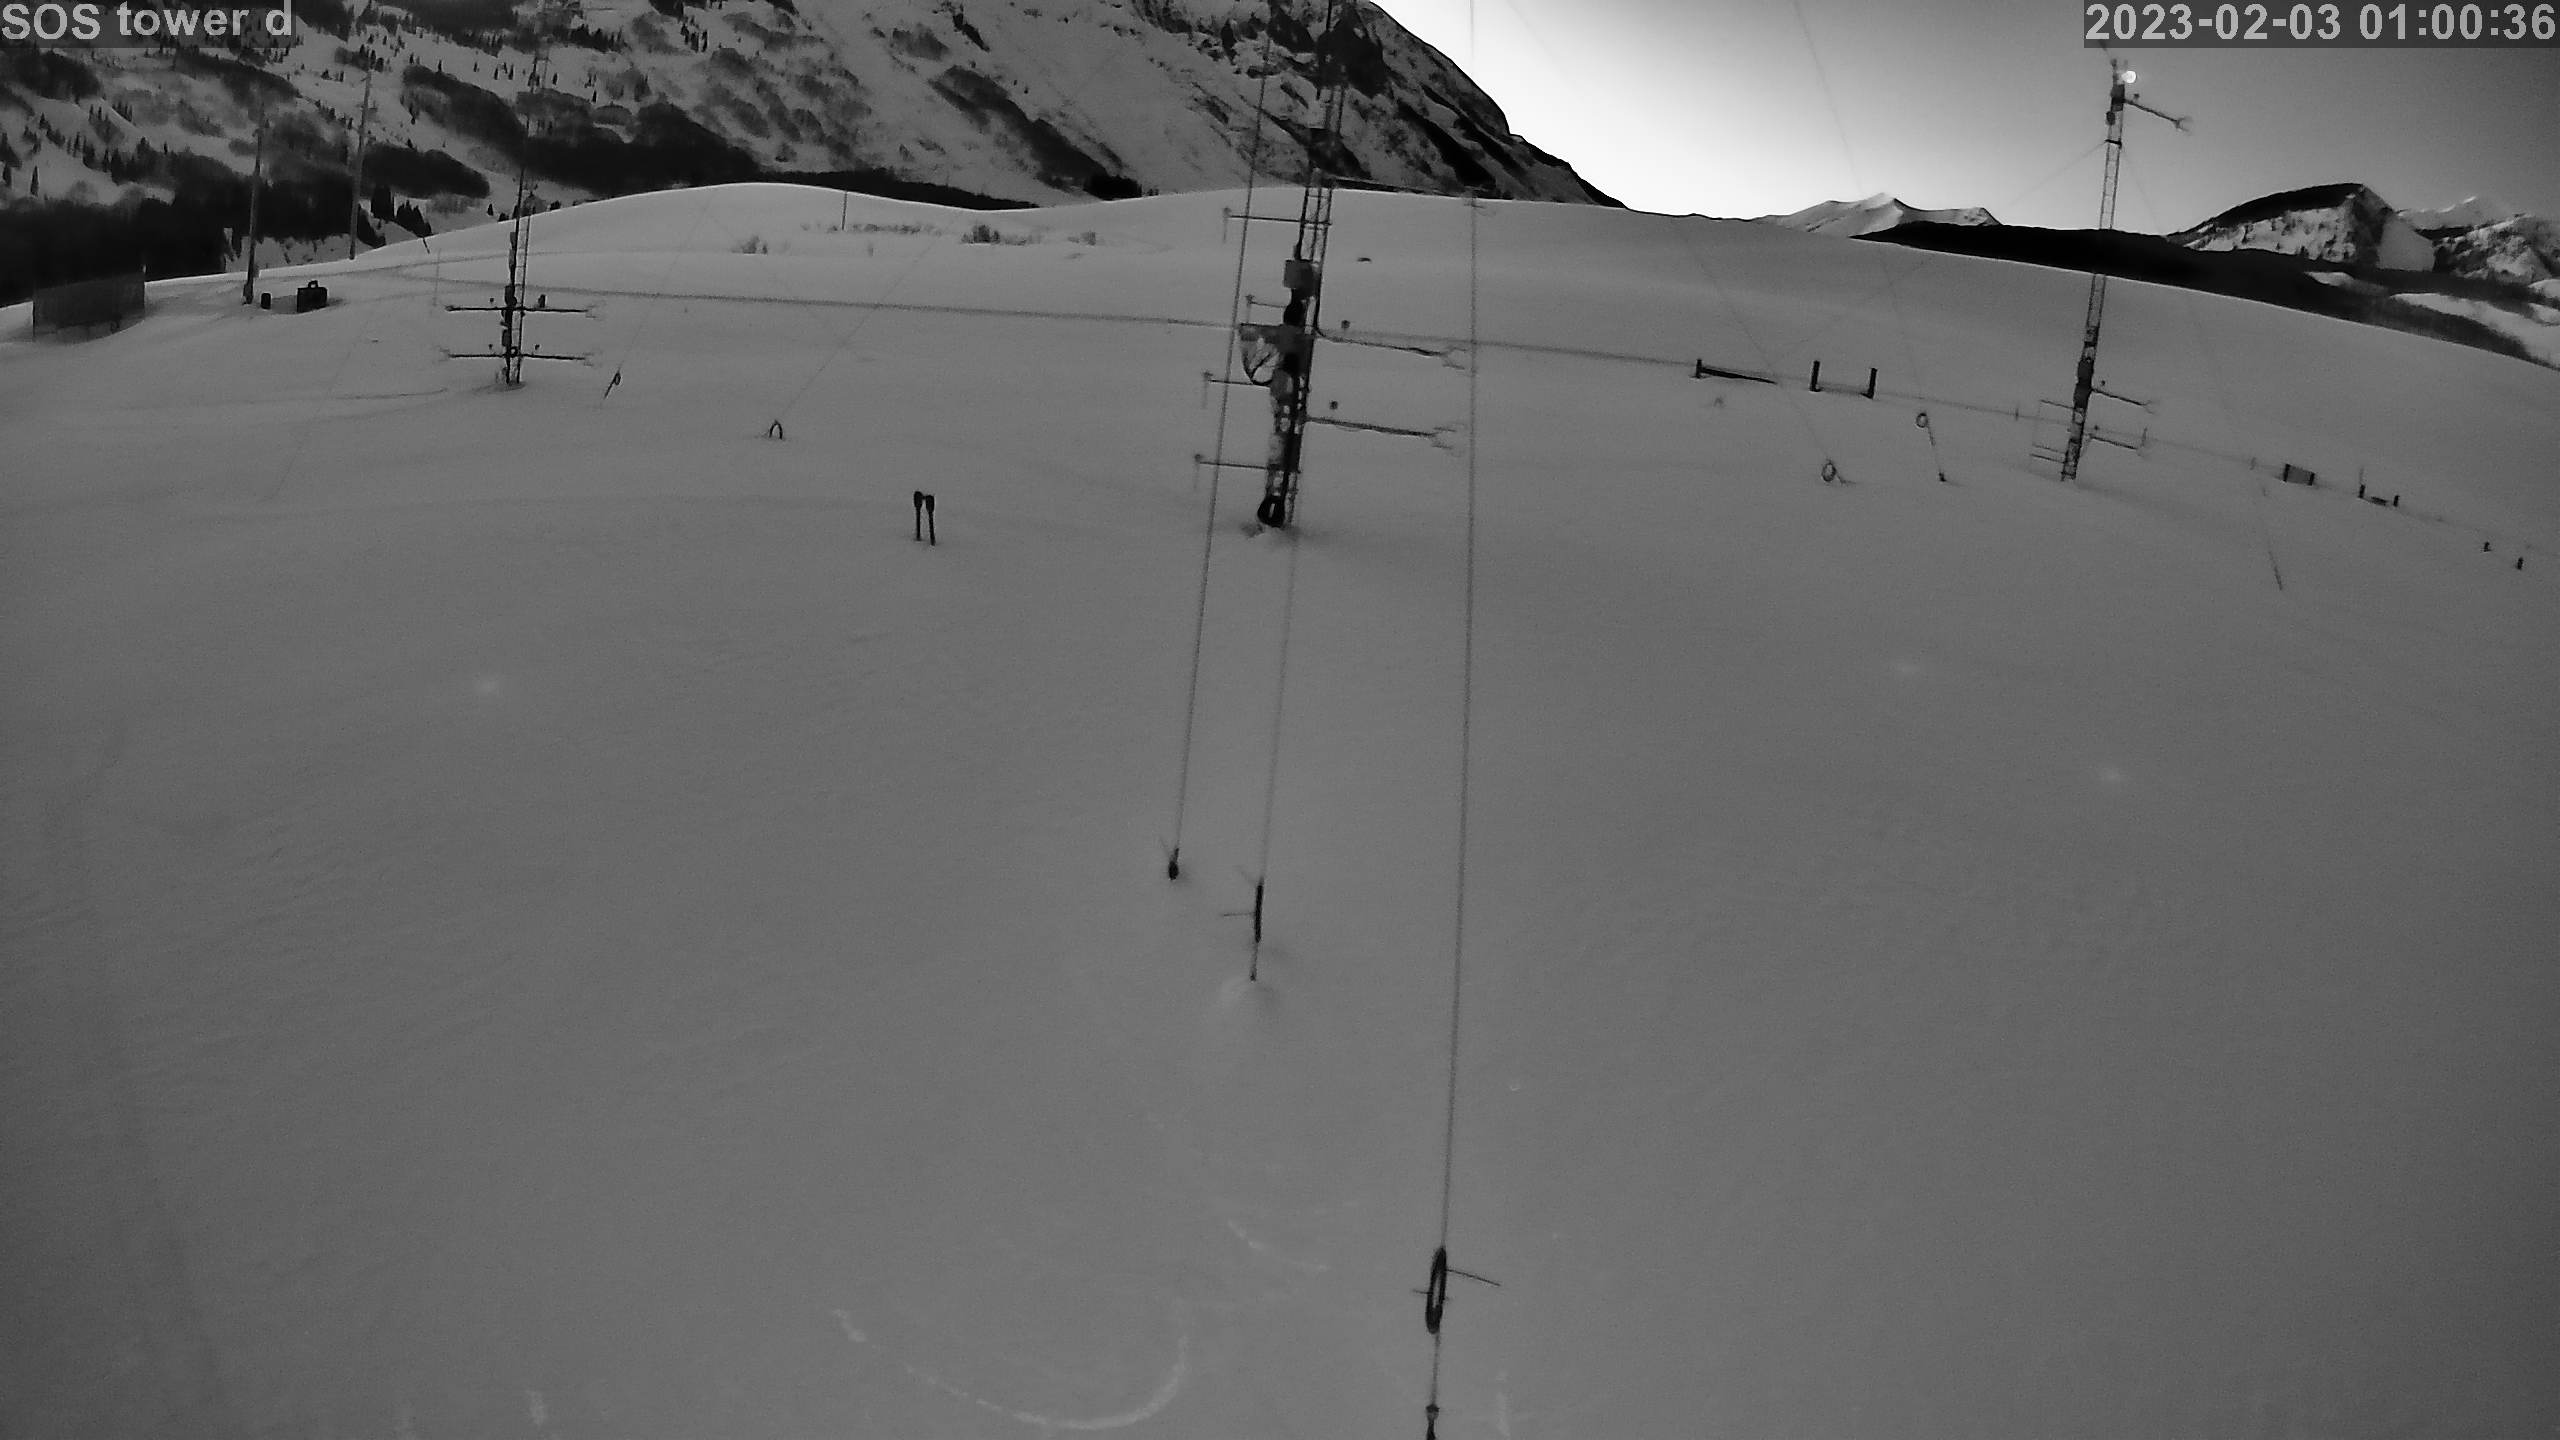
|
photo 2023020302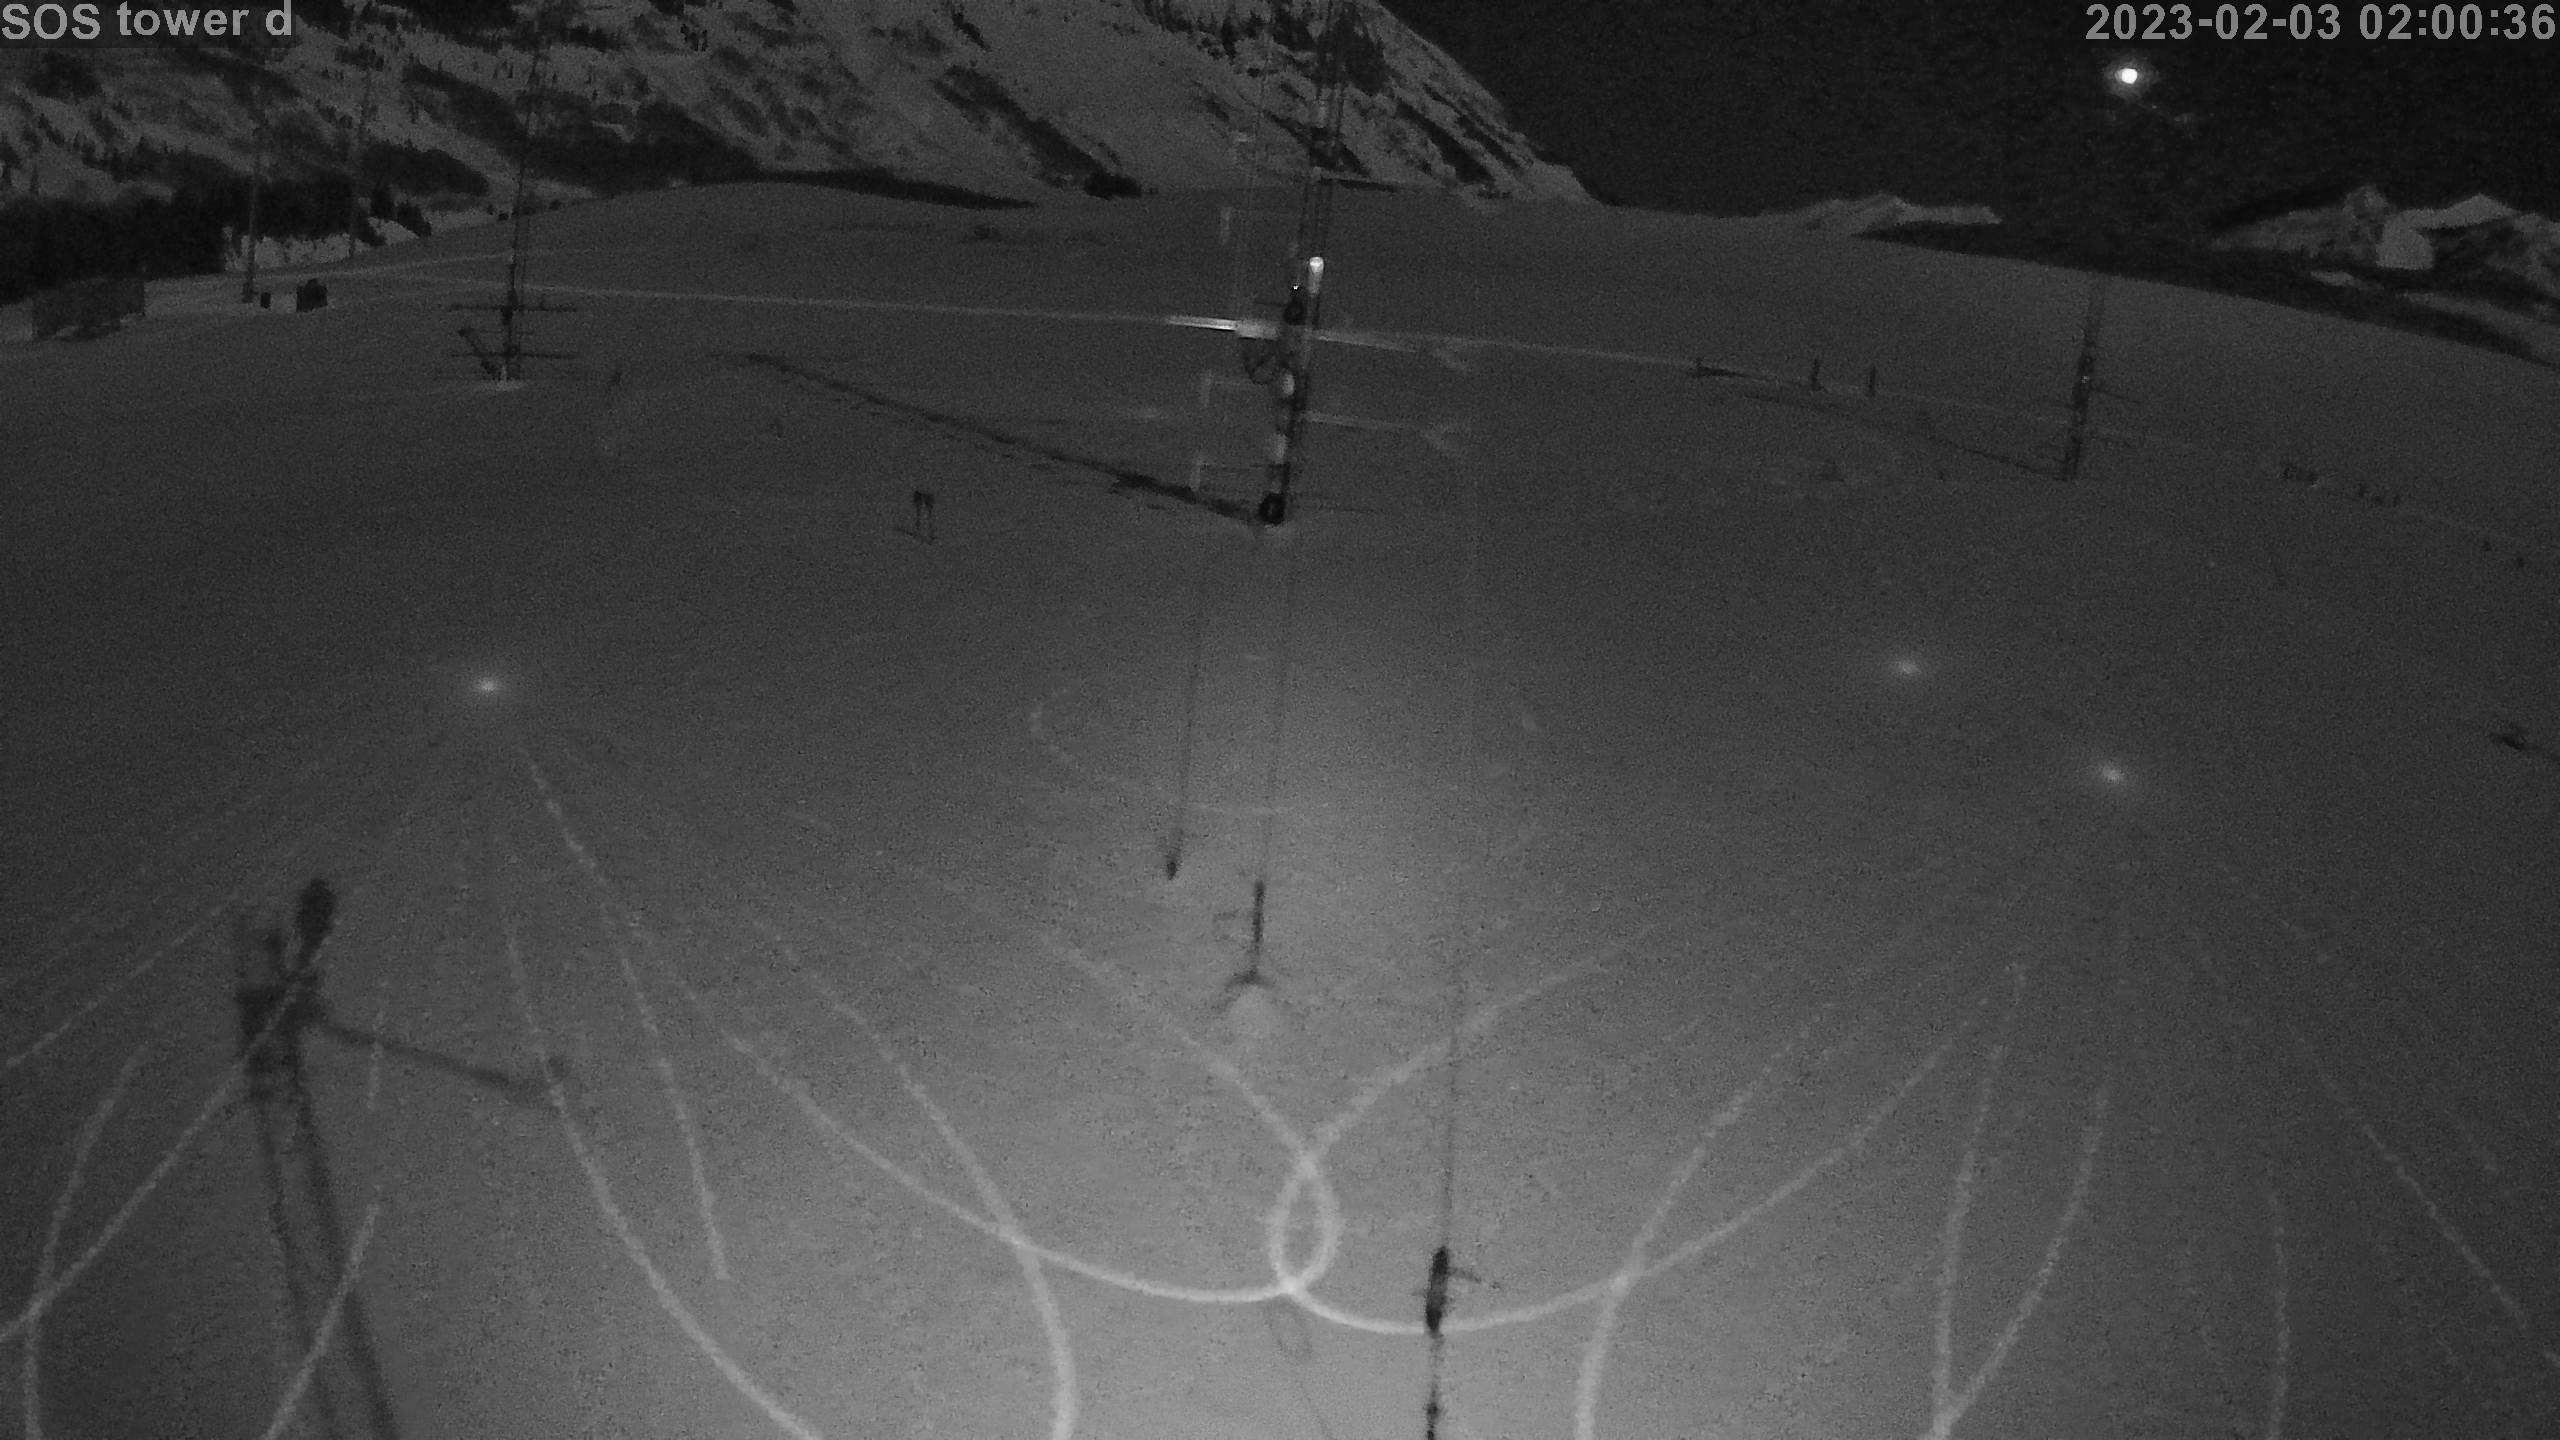
|
photo 2023020303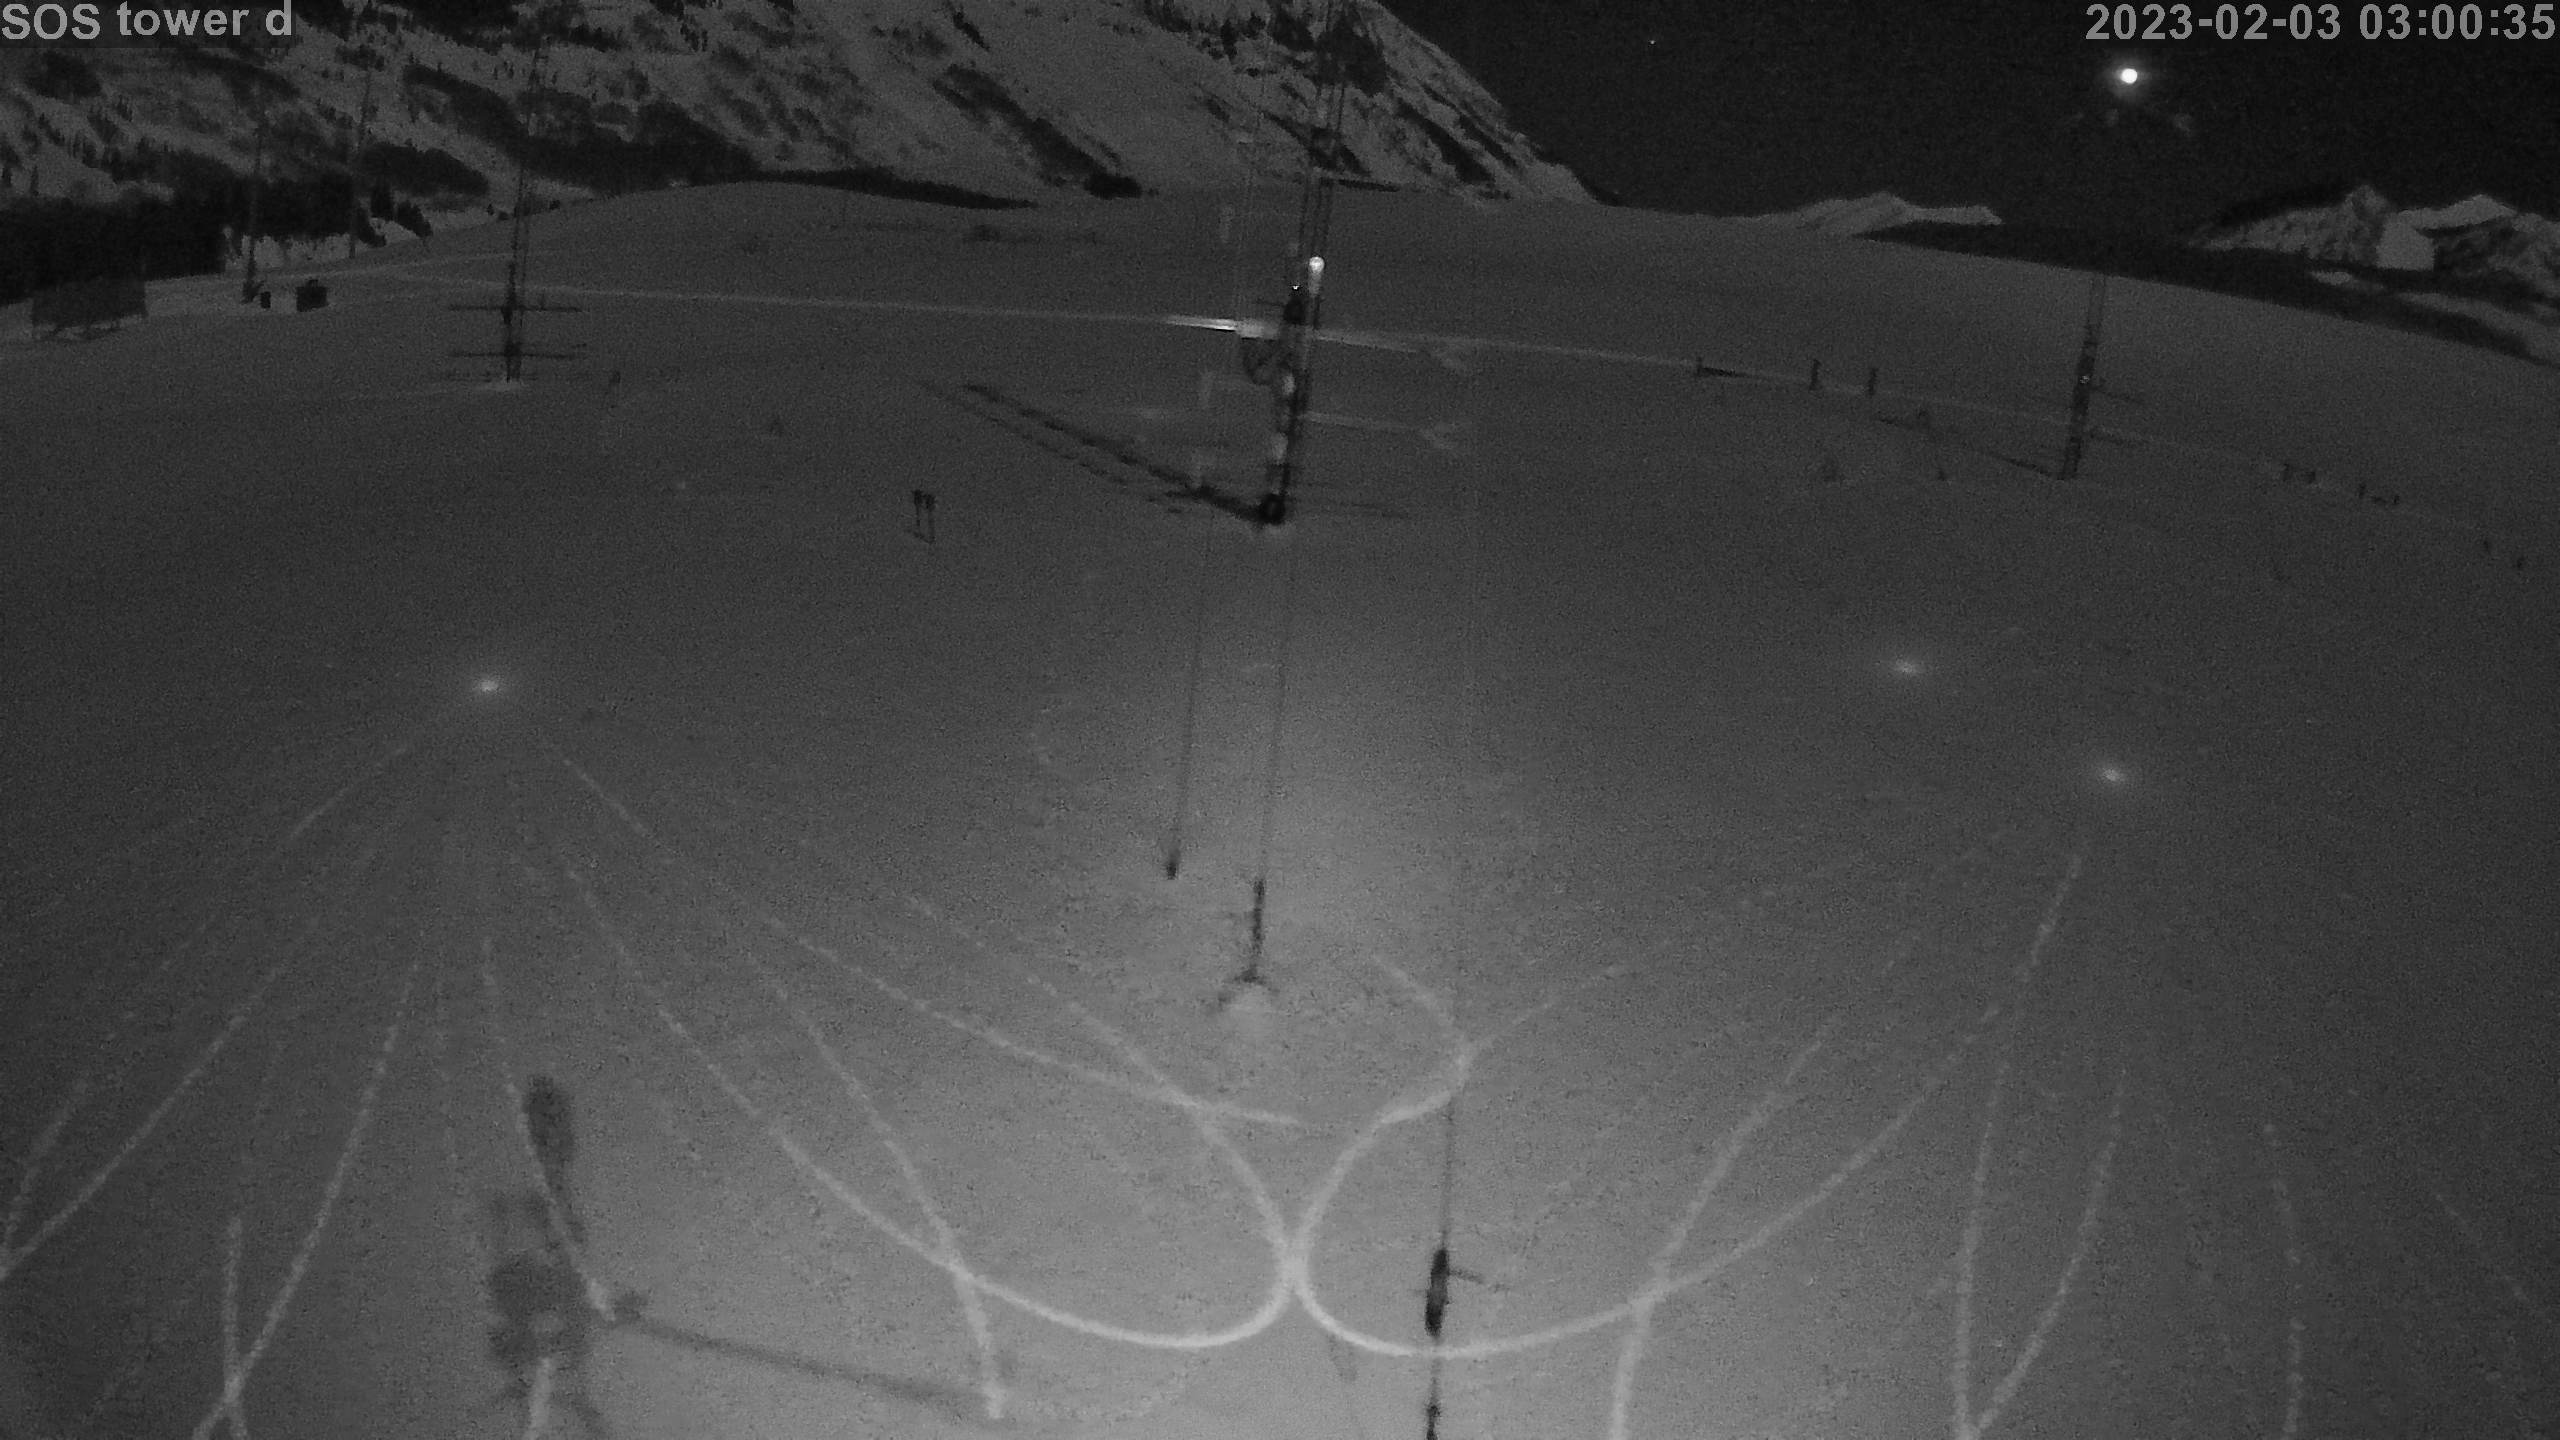
|
photo 2023020304
|
photo 2023020305
|
photo 2023020306
|
photo 2023020307
|
photo 2023020308
|
photo 2023020309
|
photo 2023020310
|
photo 2023020311
|
photo 2023020312
|
photo 2023020313
|
photo 2023020314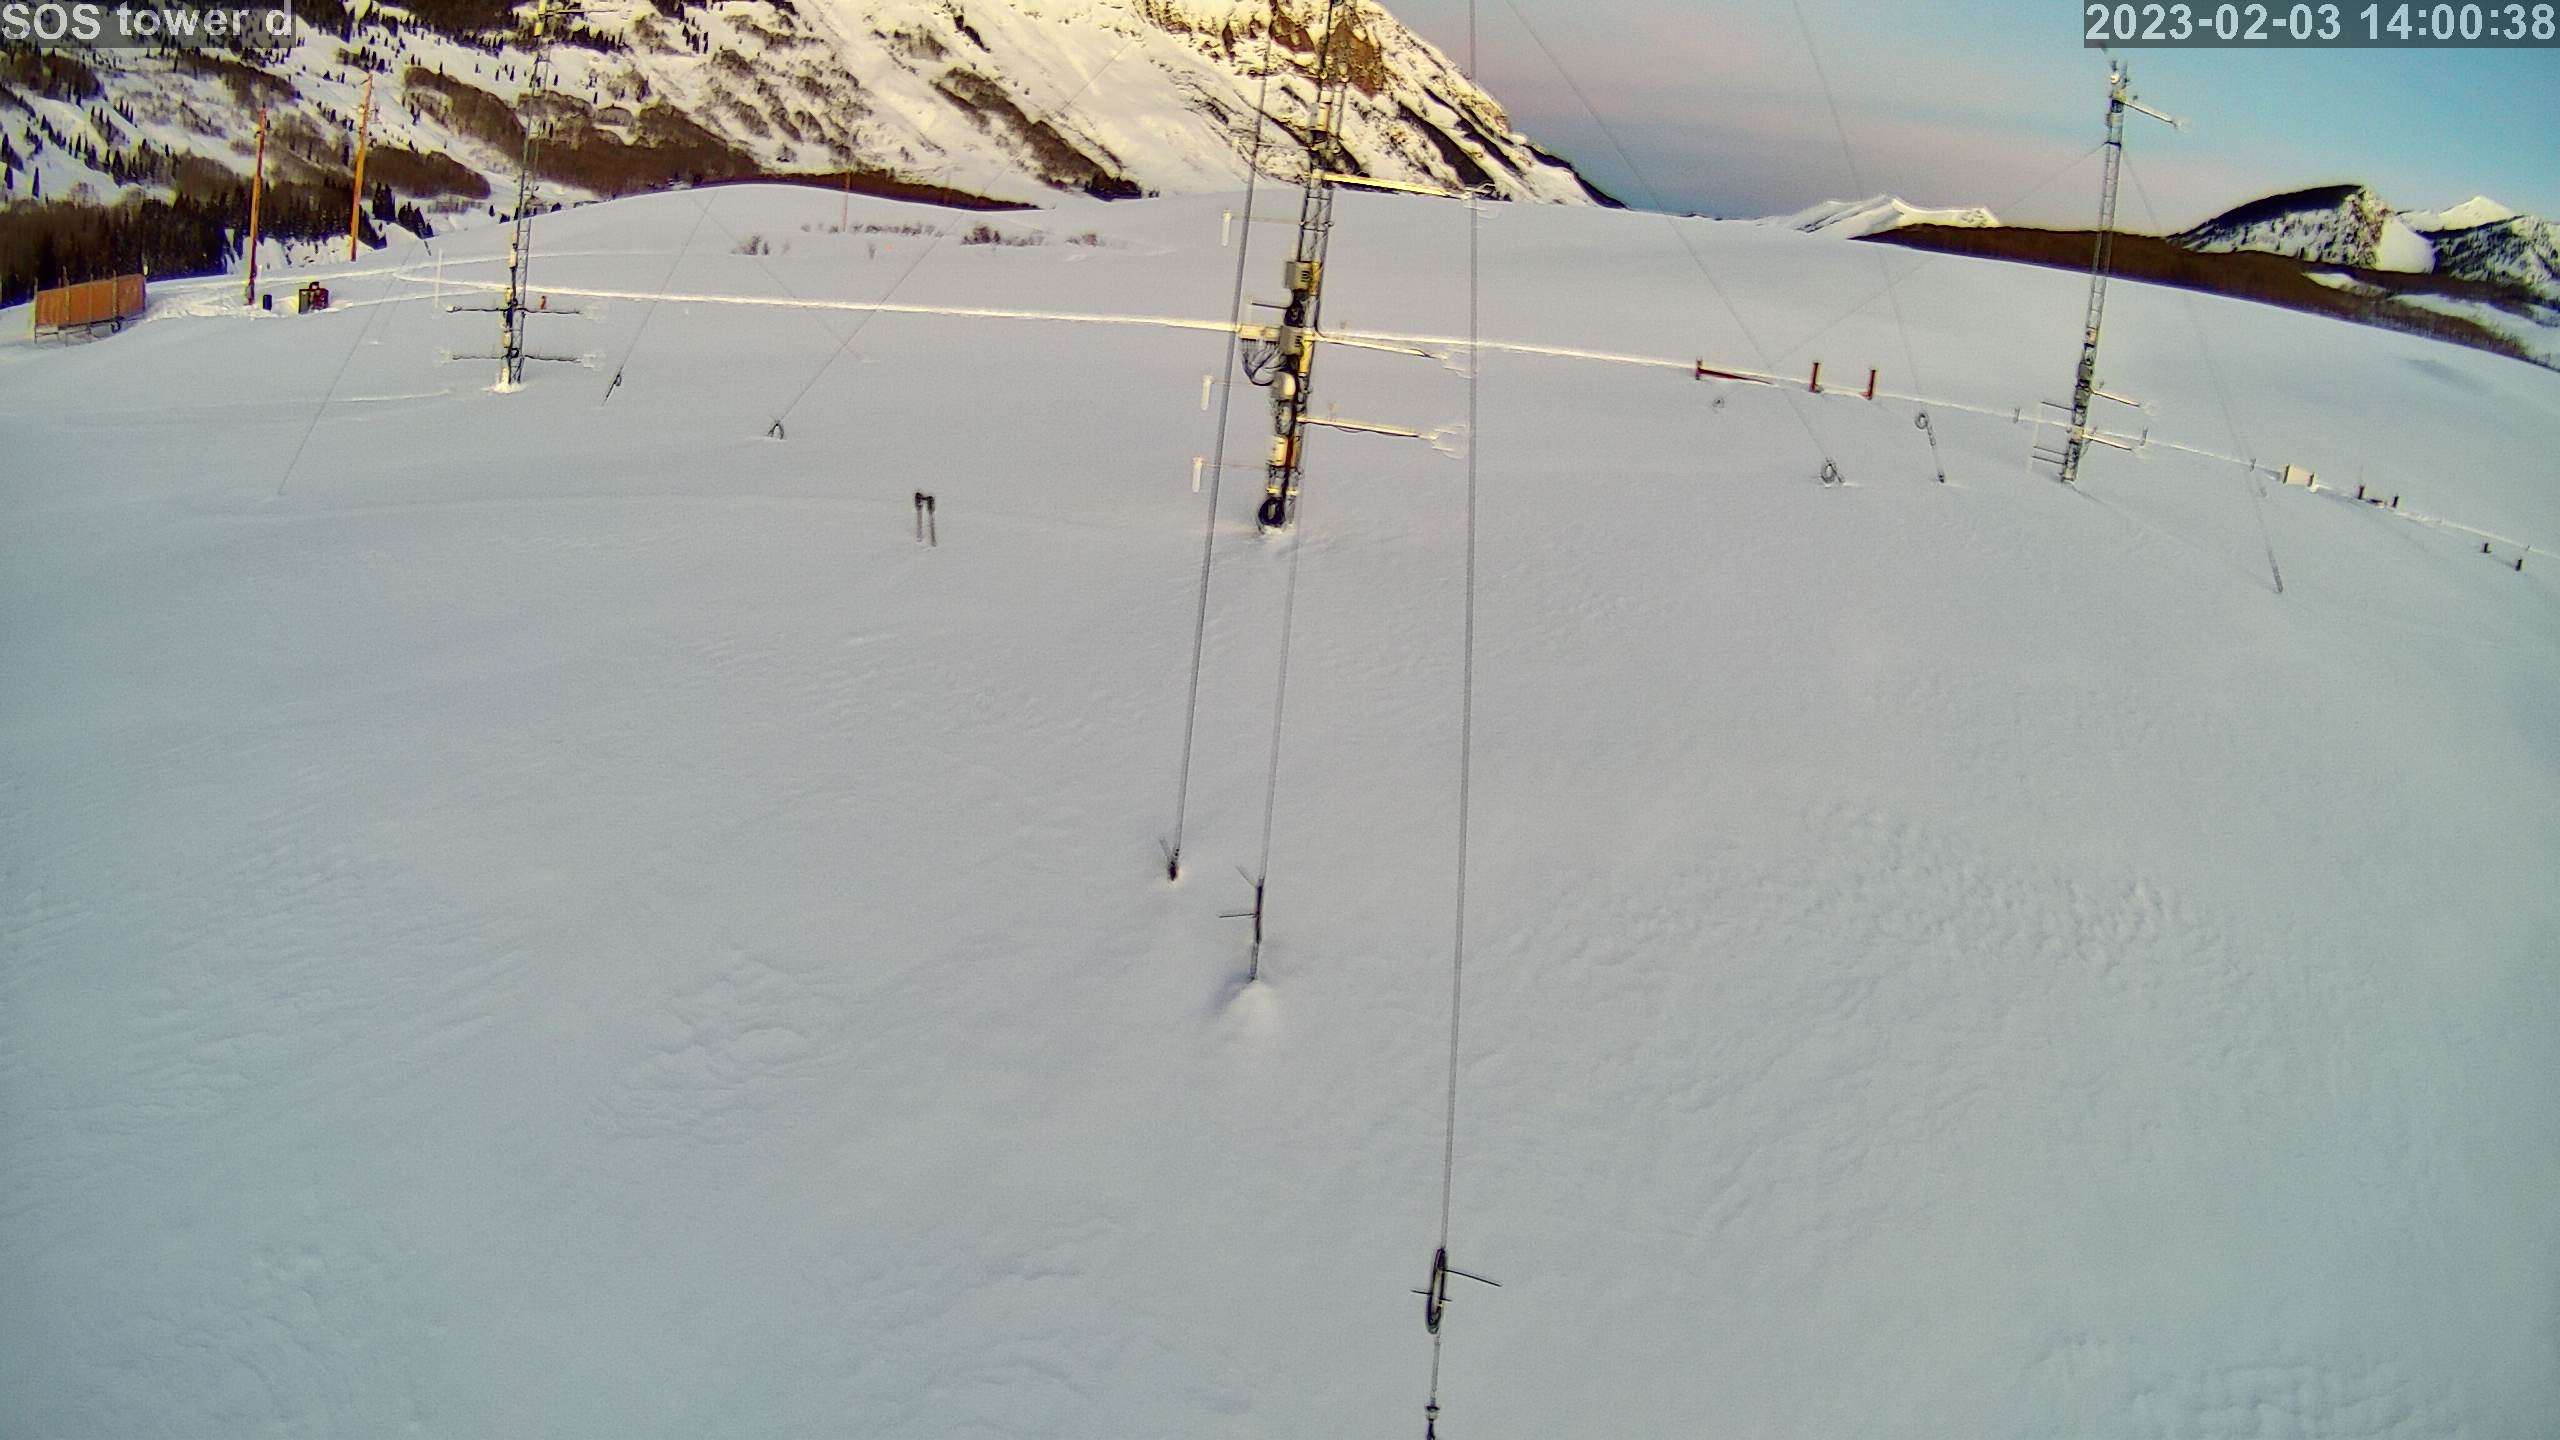
|
photo 2023020315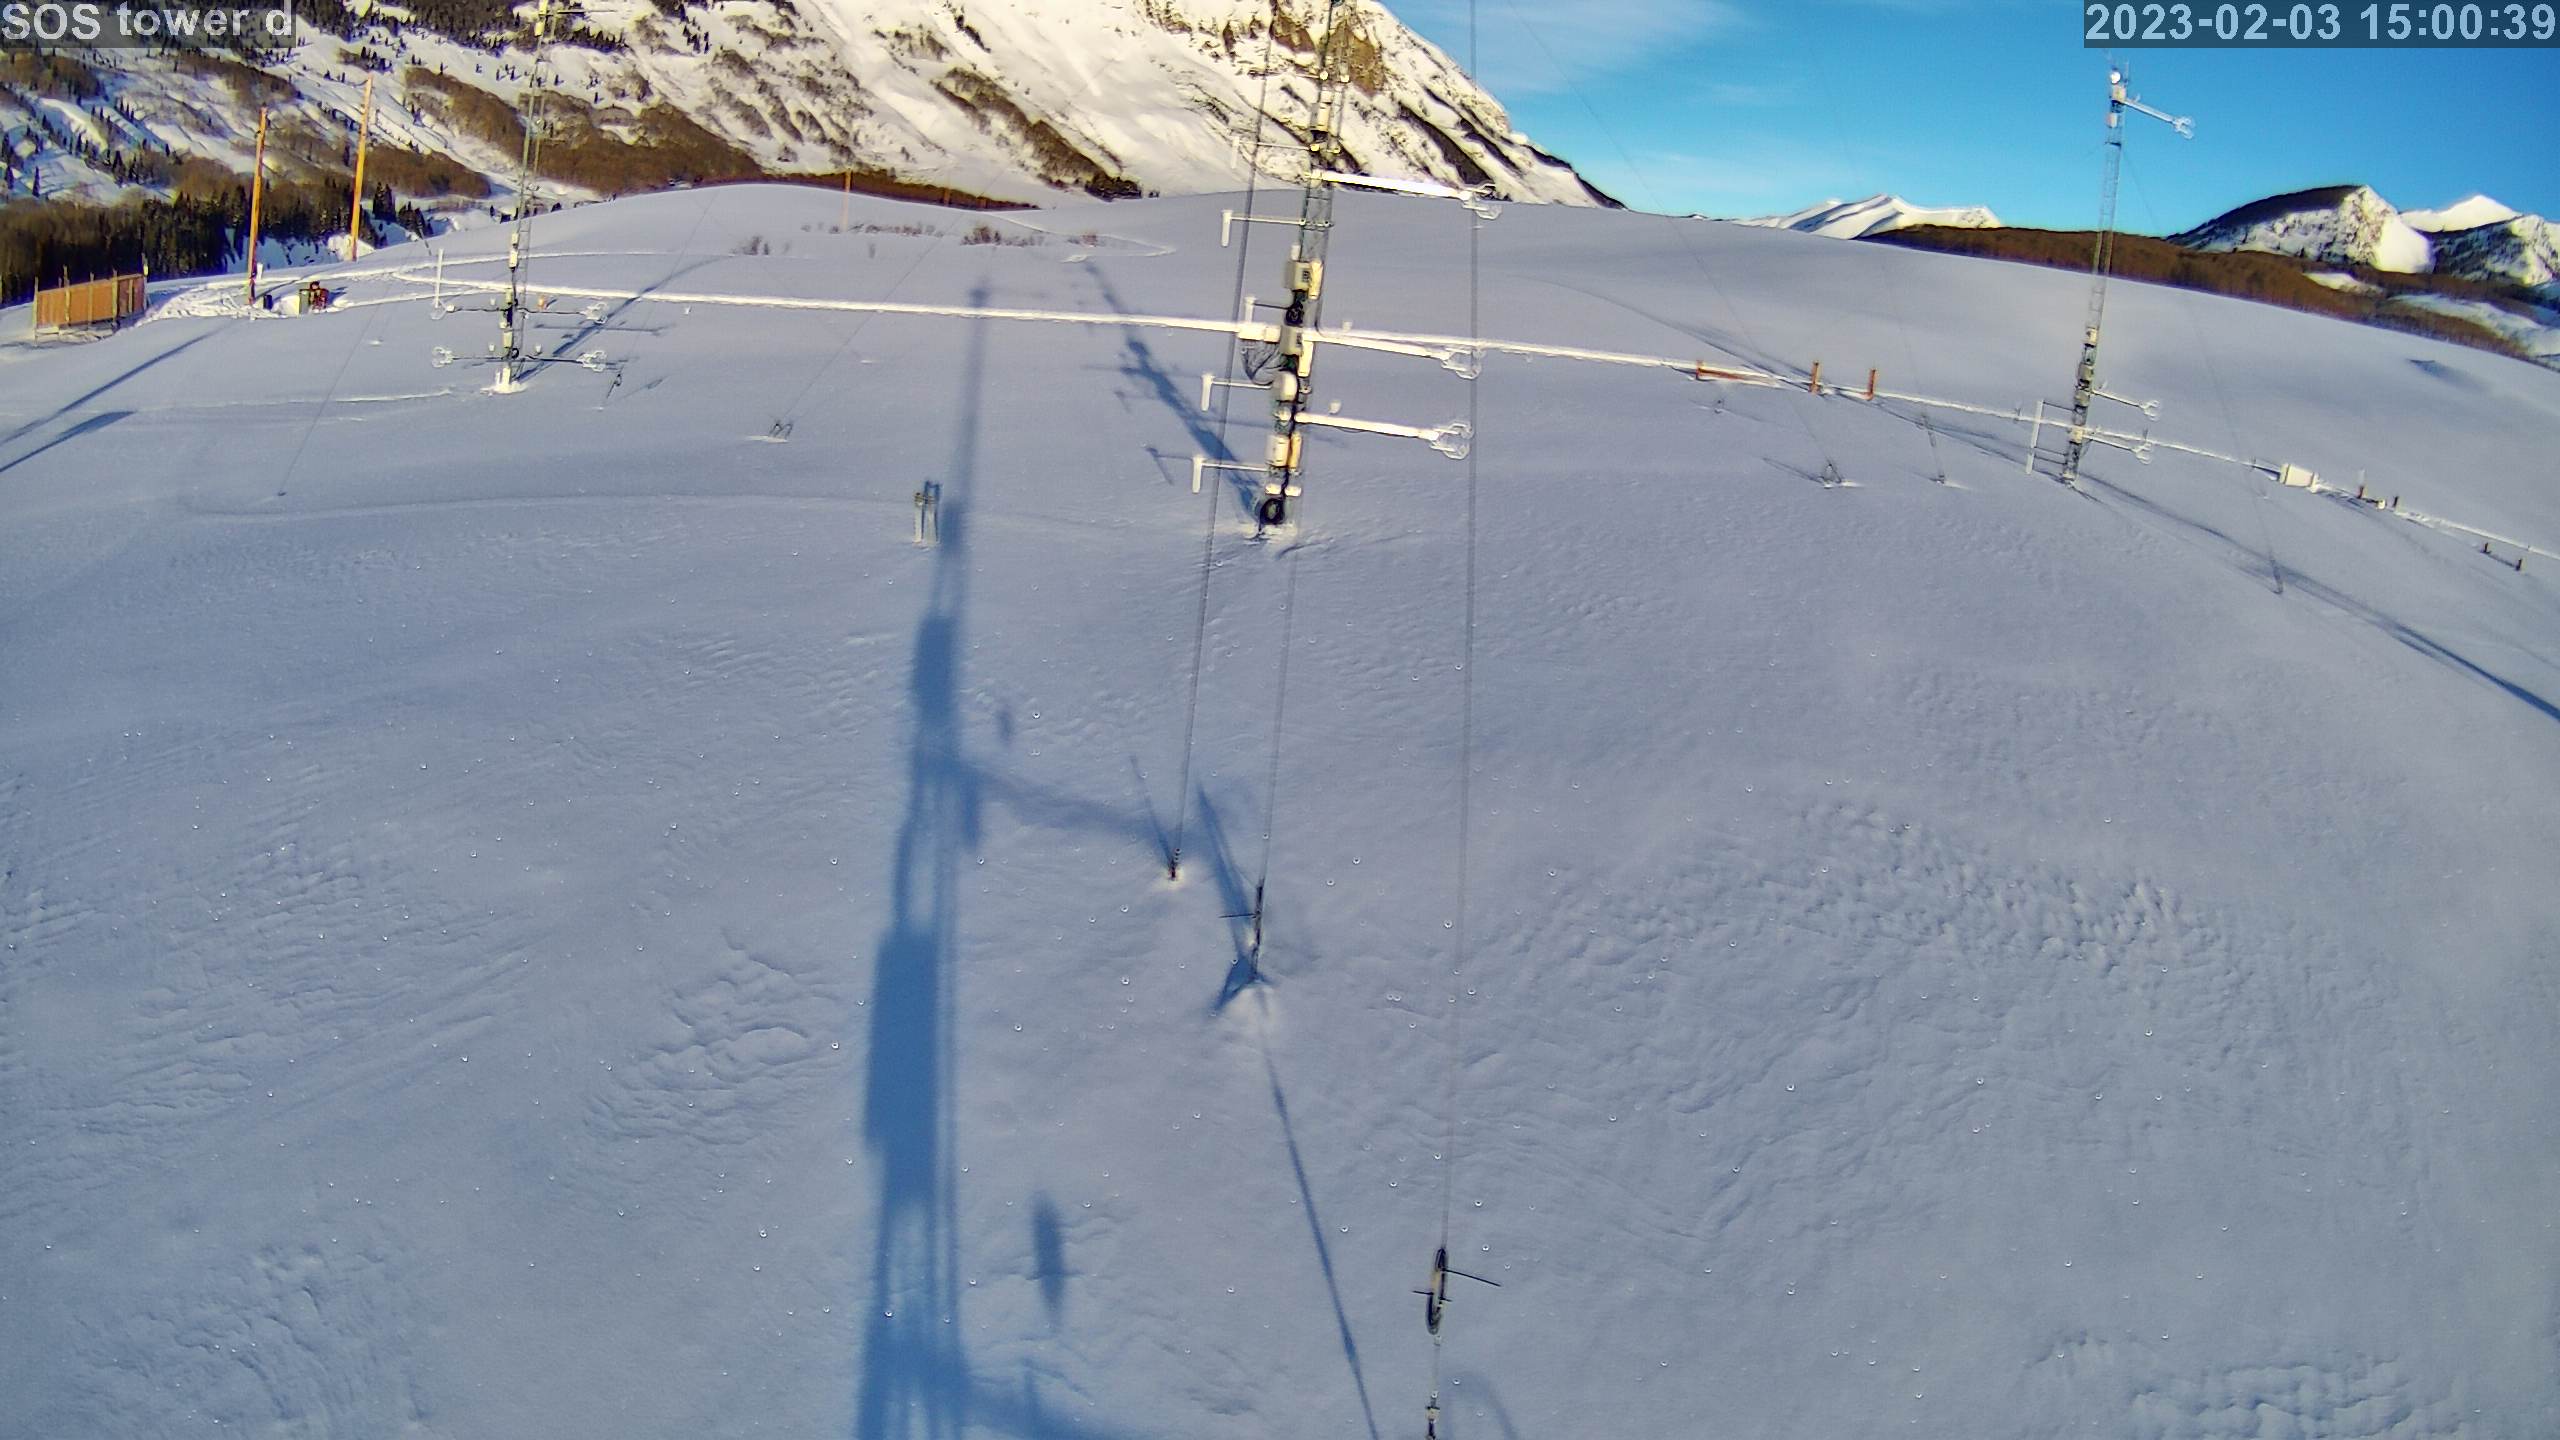
|
photo 2023020316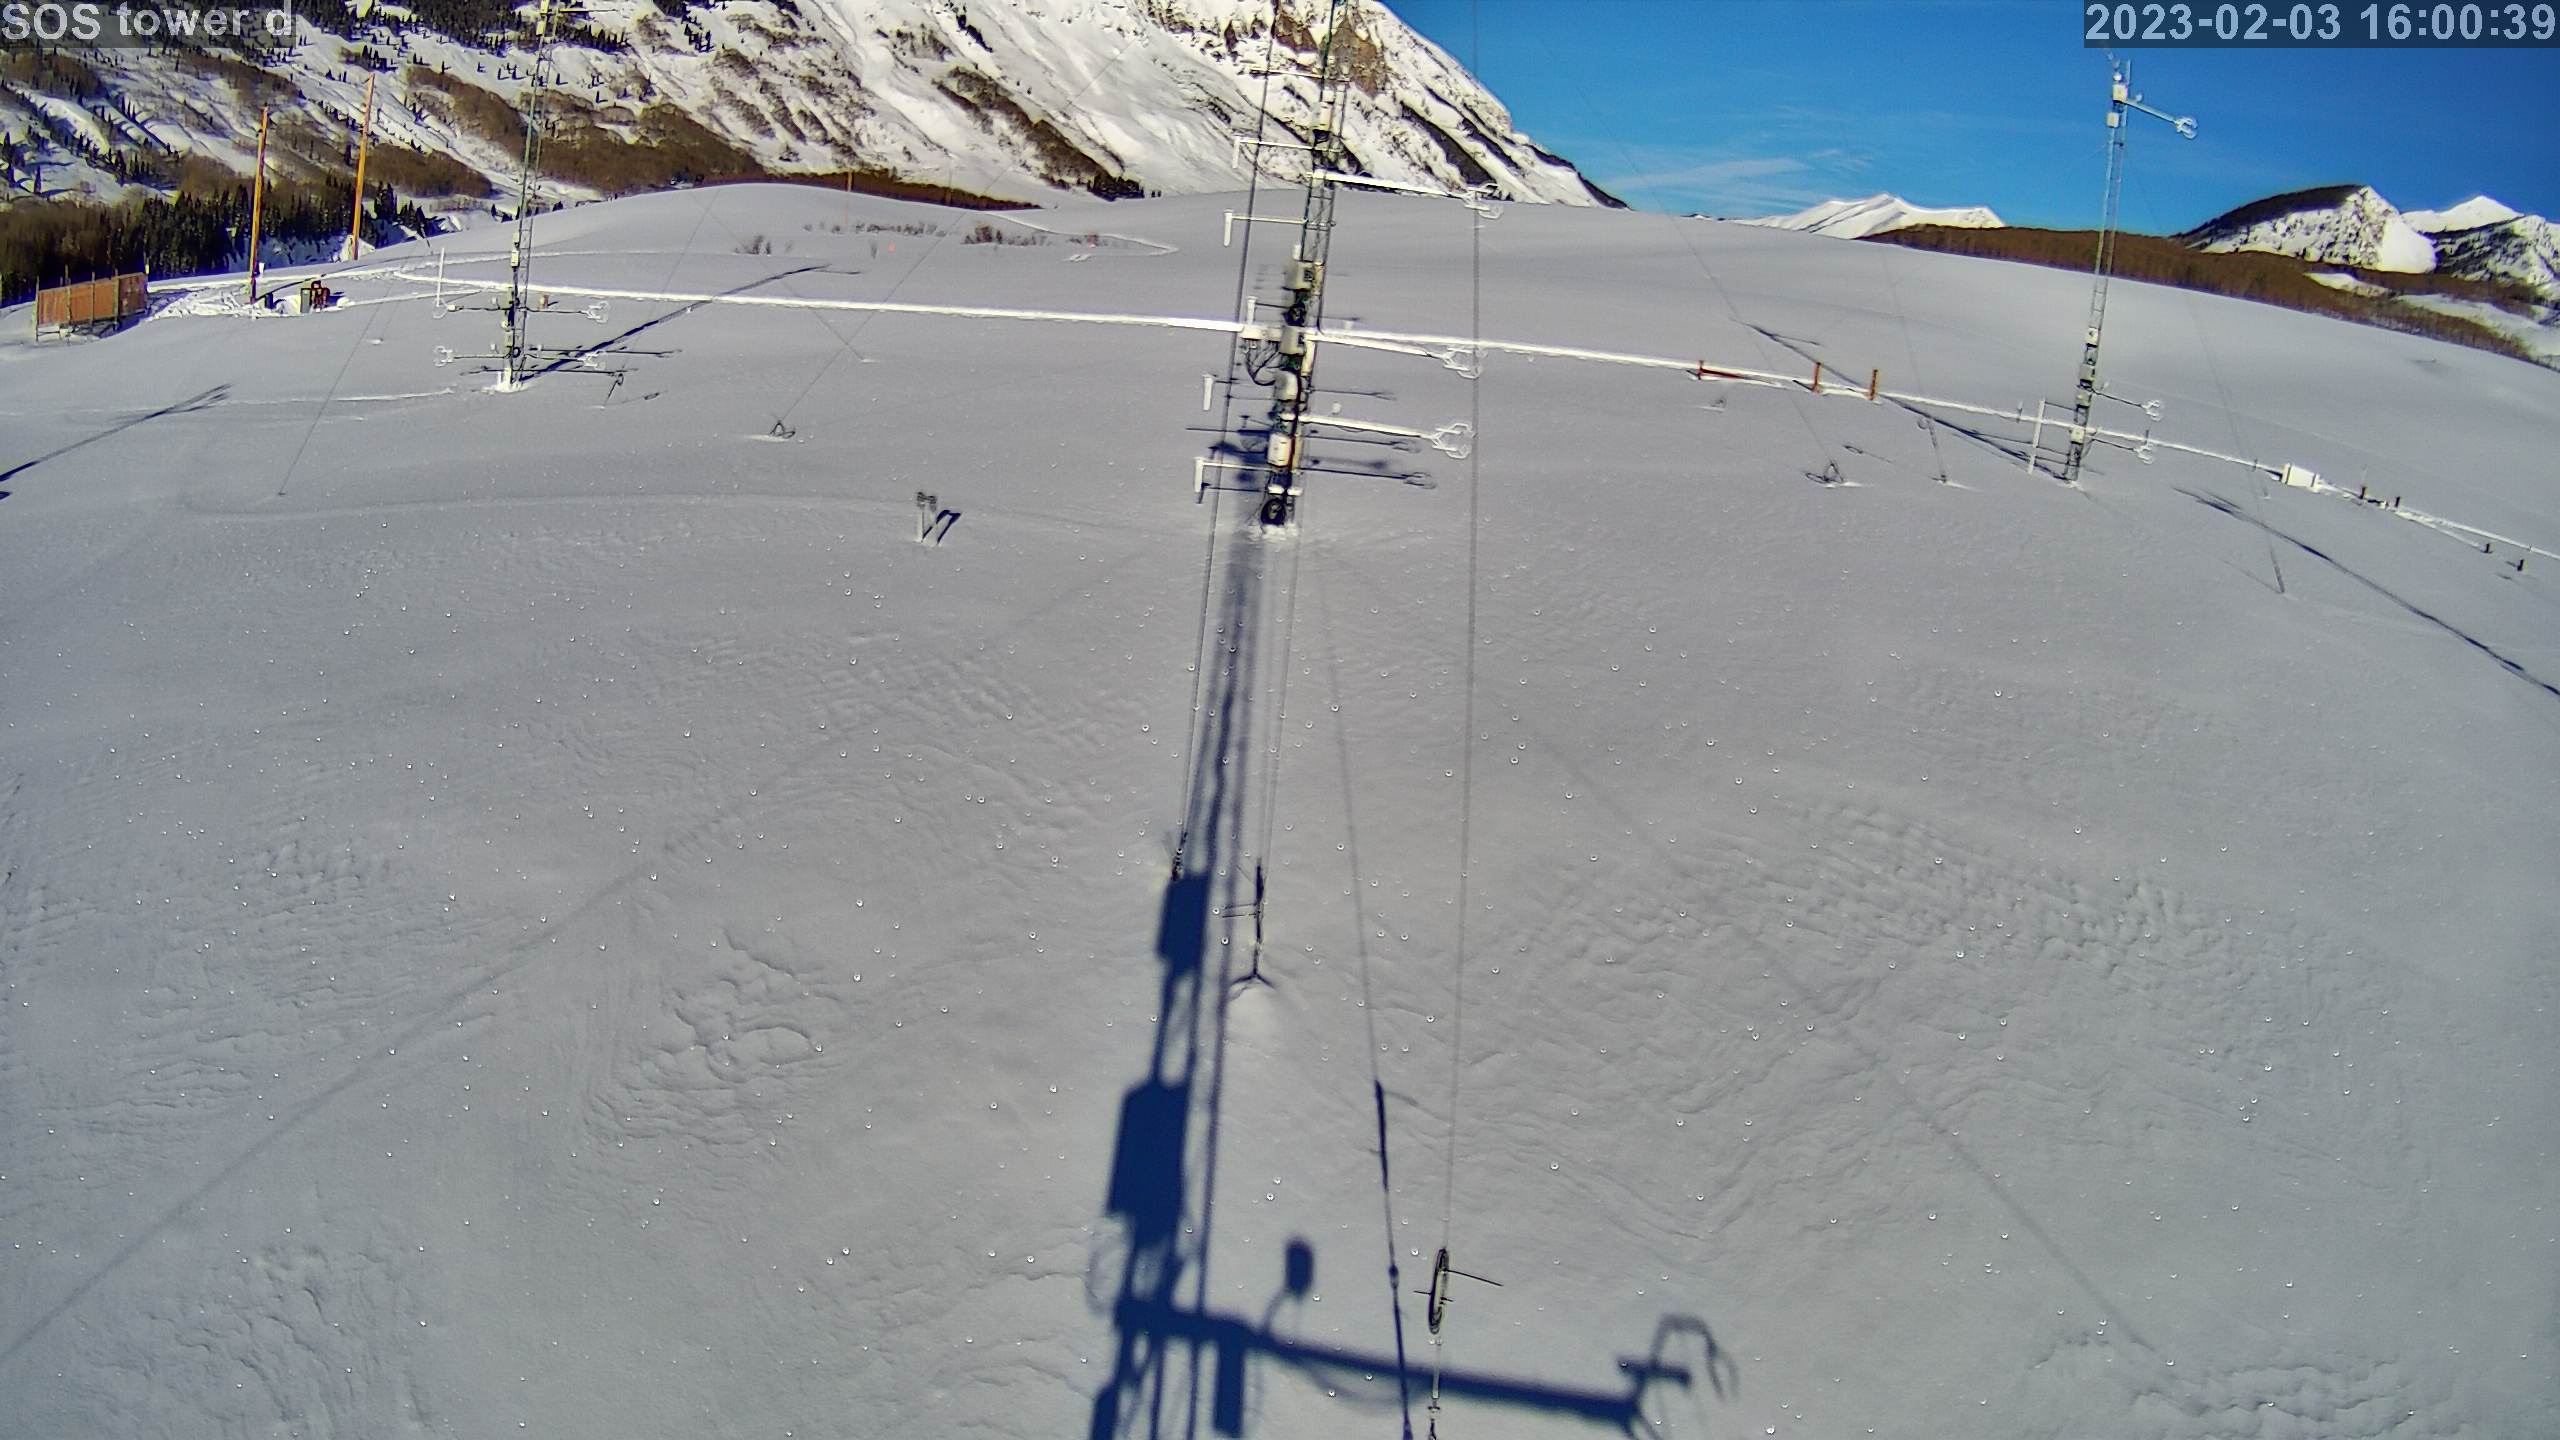
|
photo 2023020317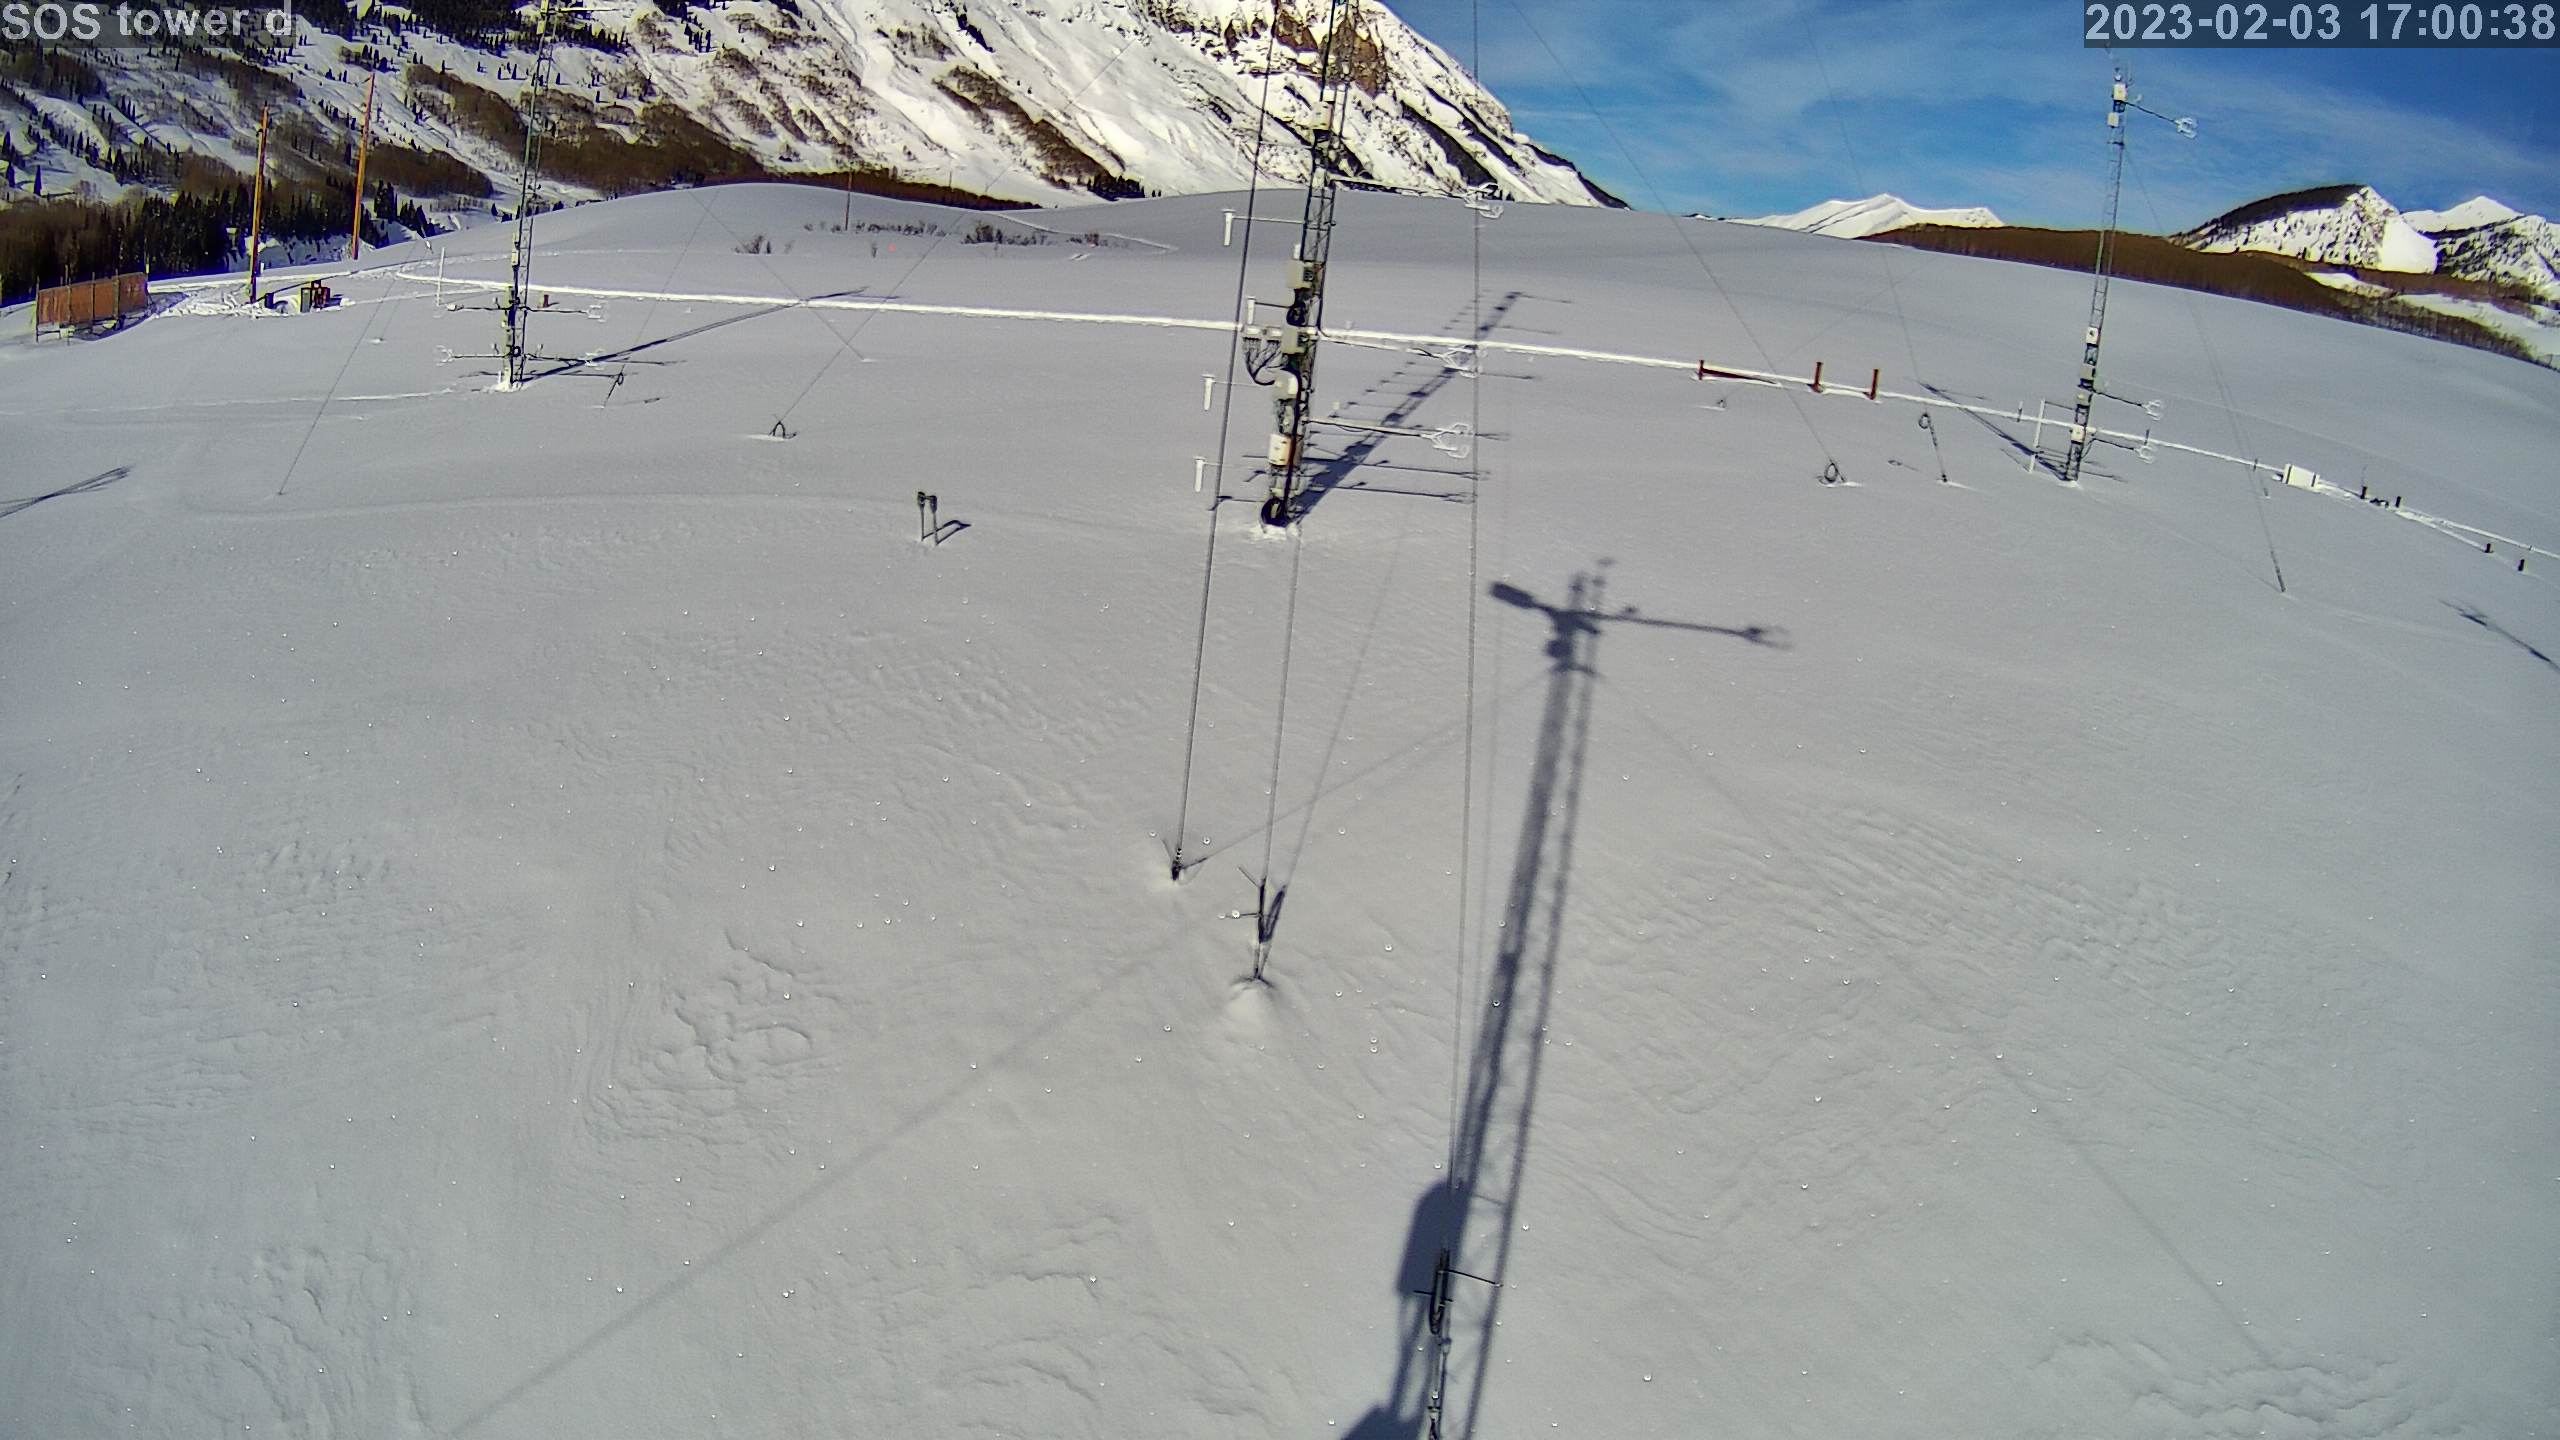
|
photo 2023020318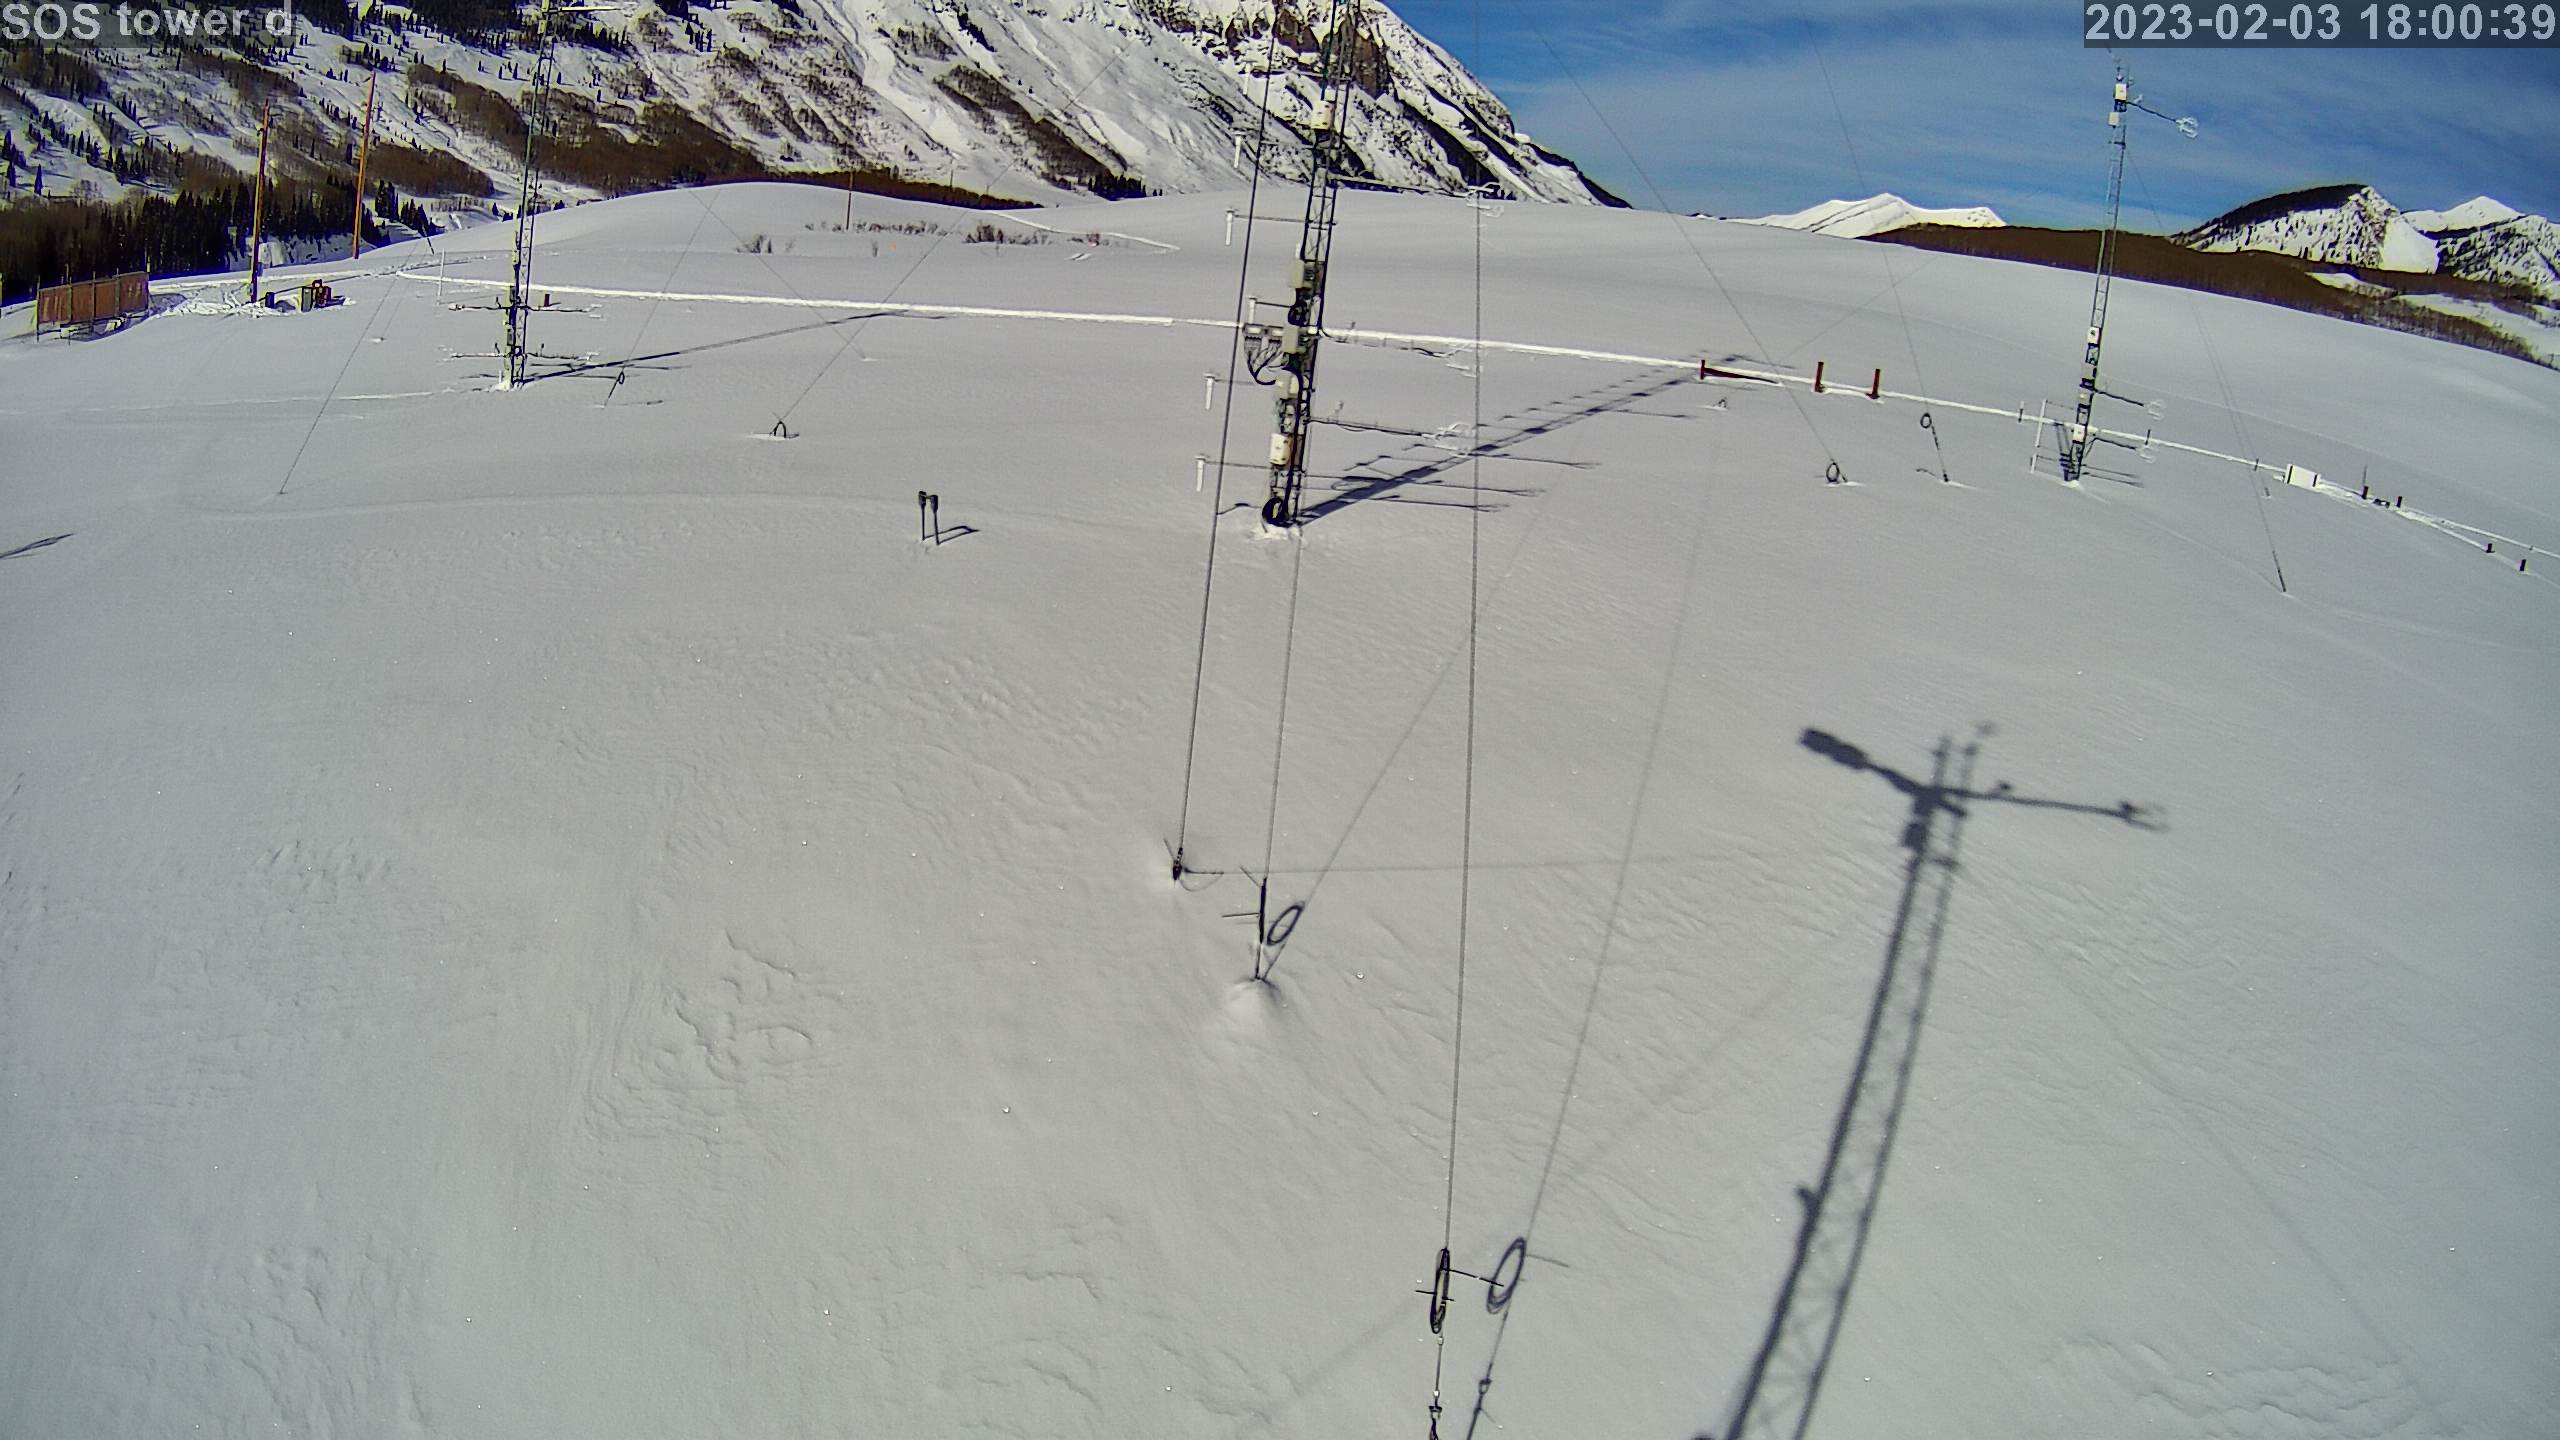
|
photo 2023020319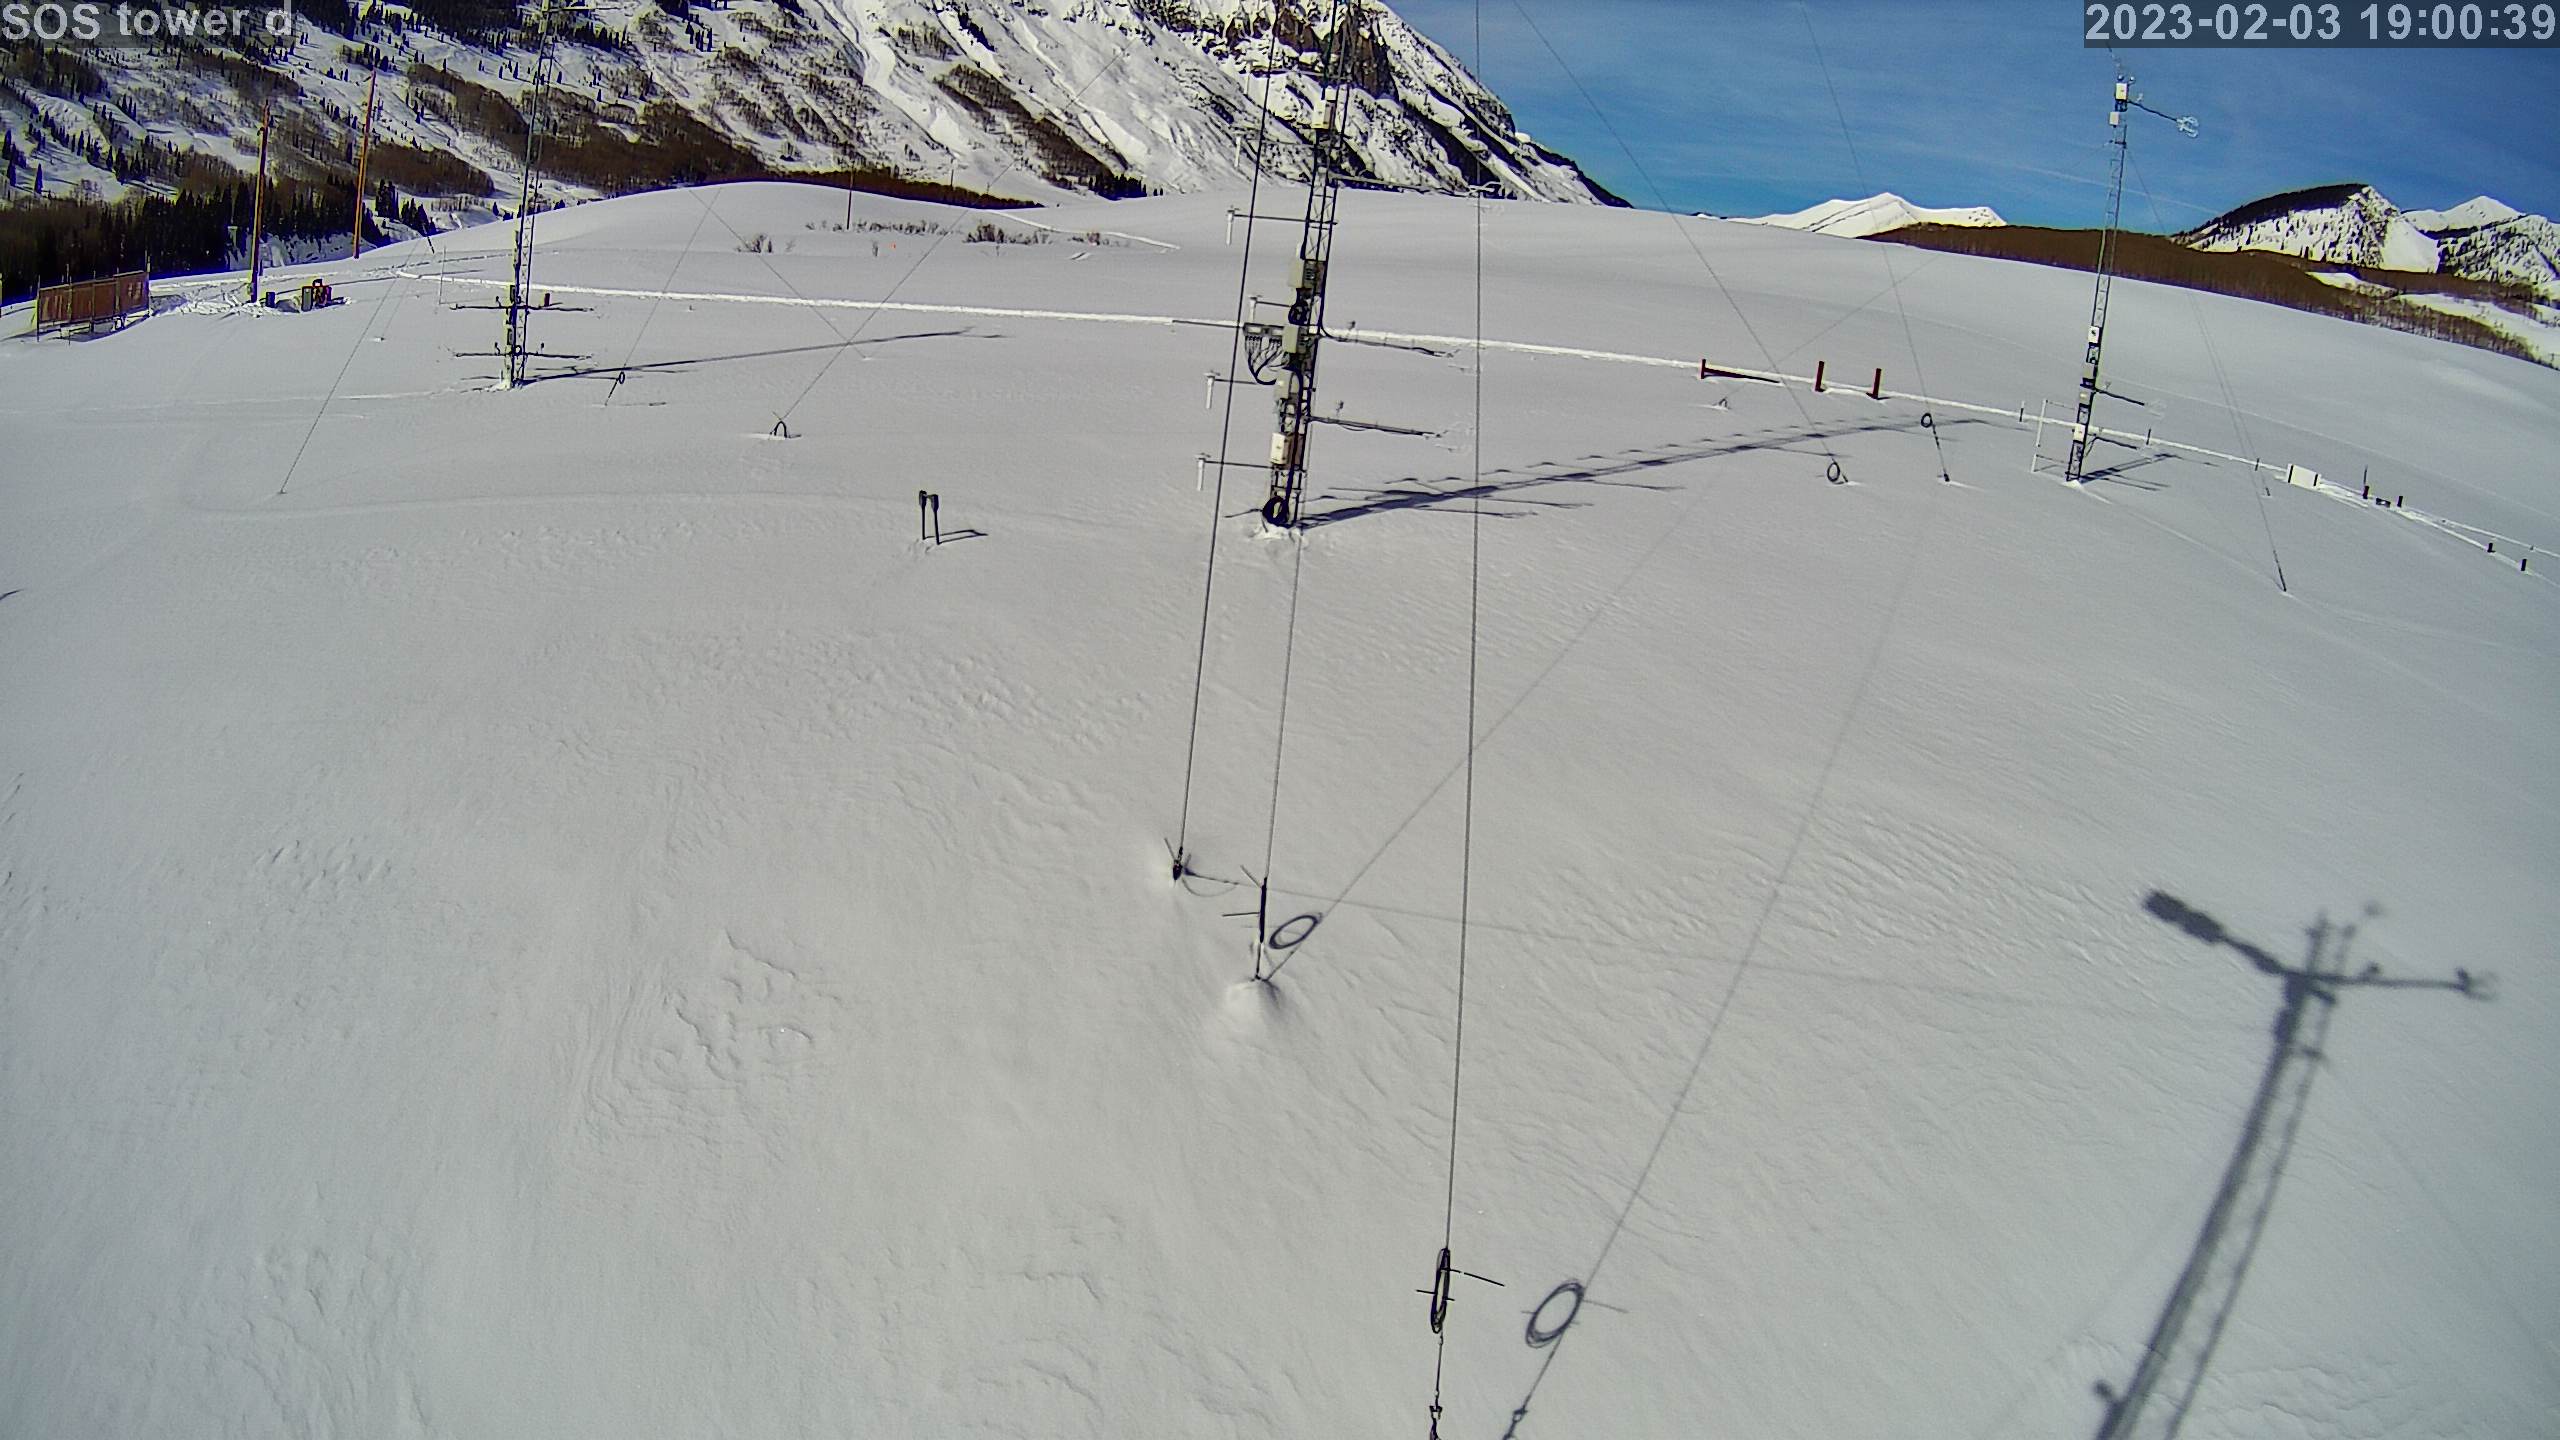
|
photo 2023020320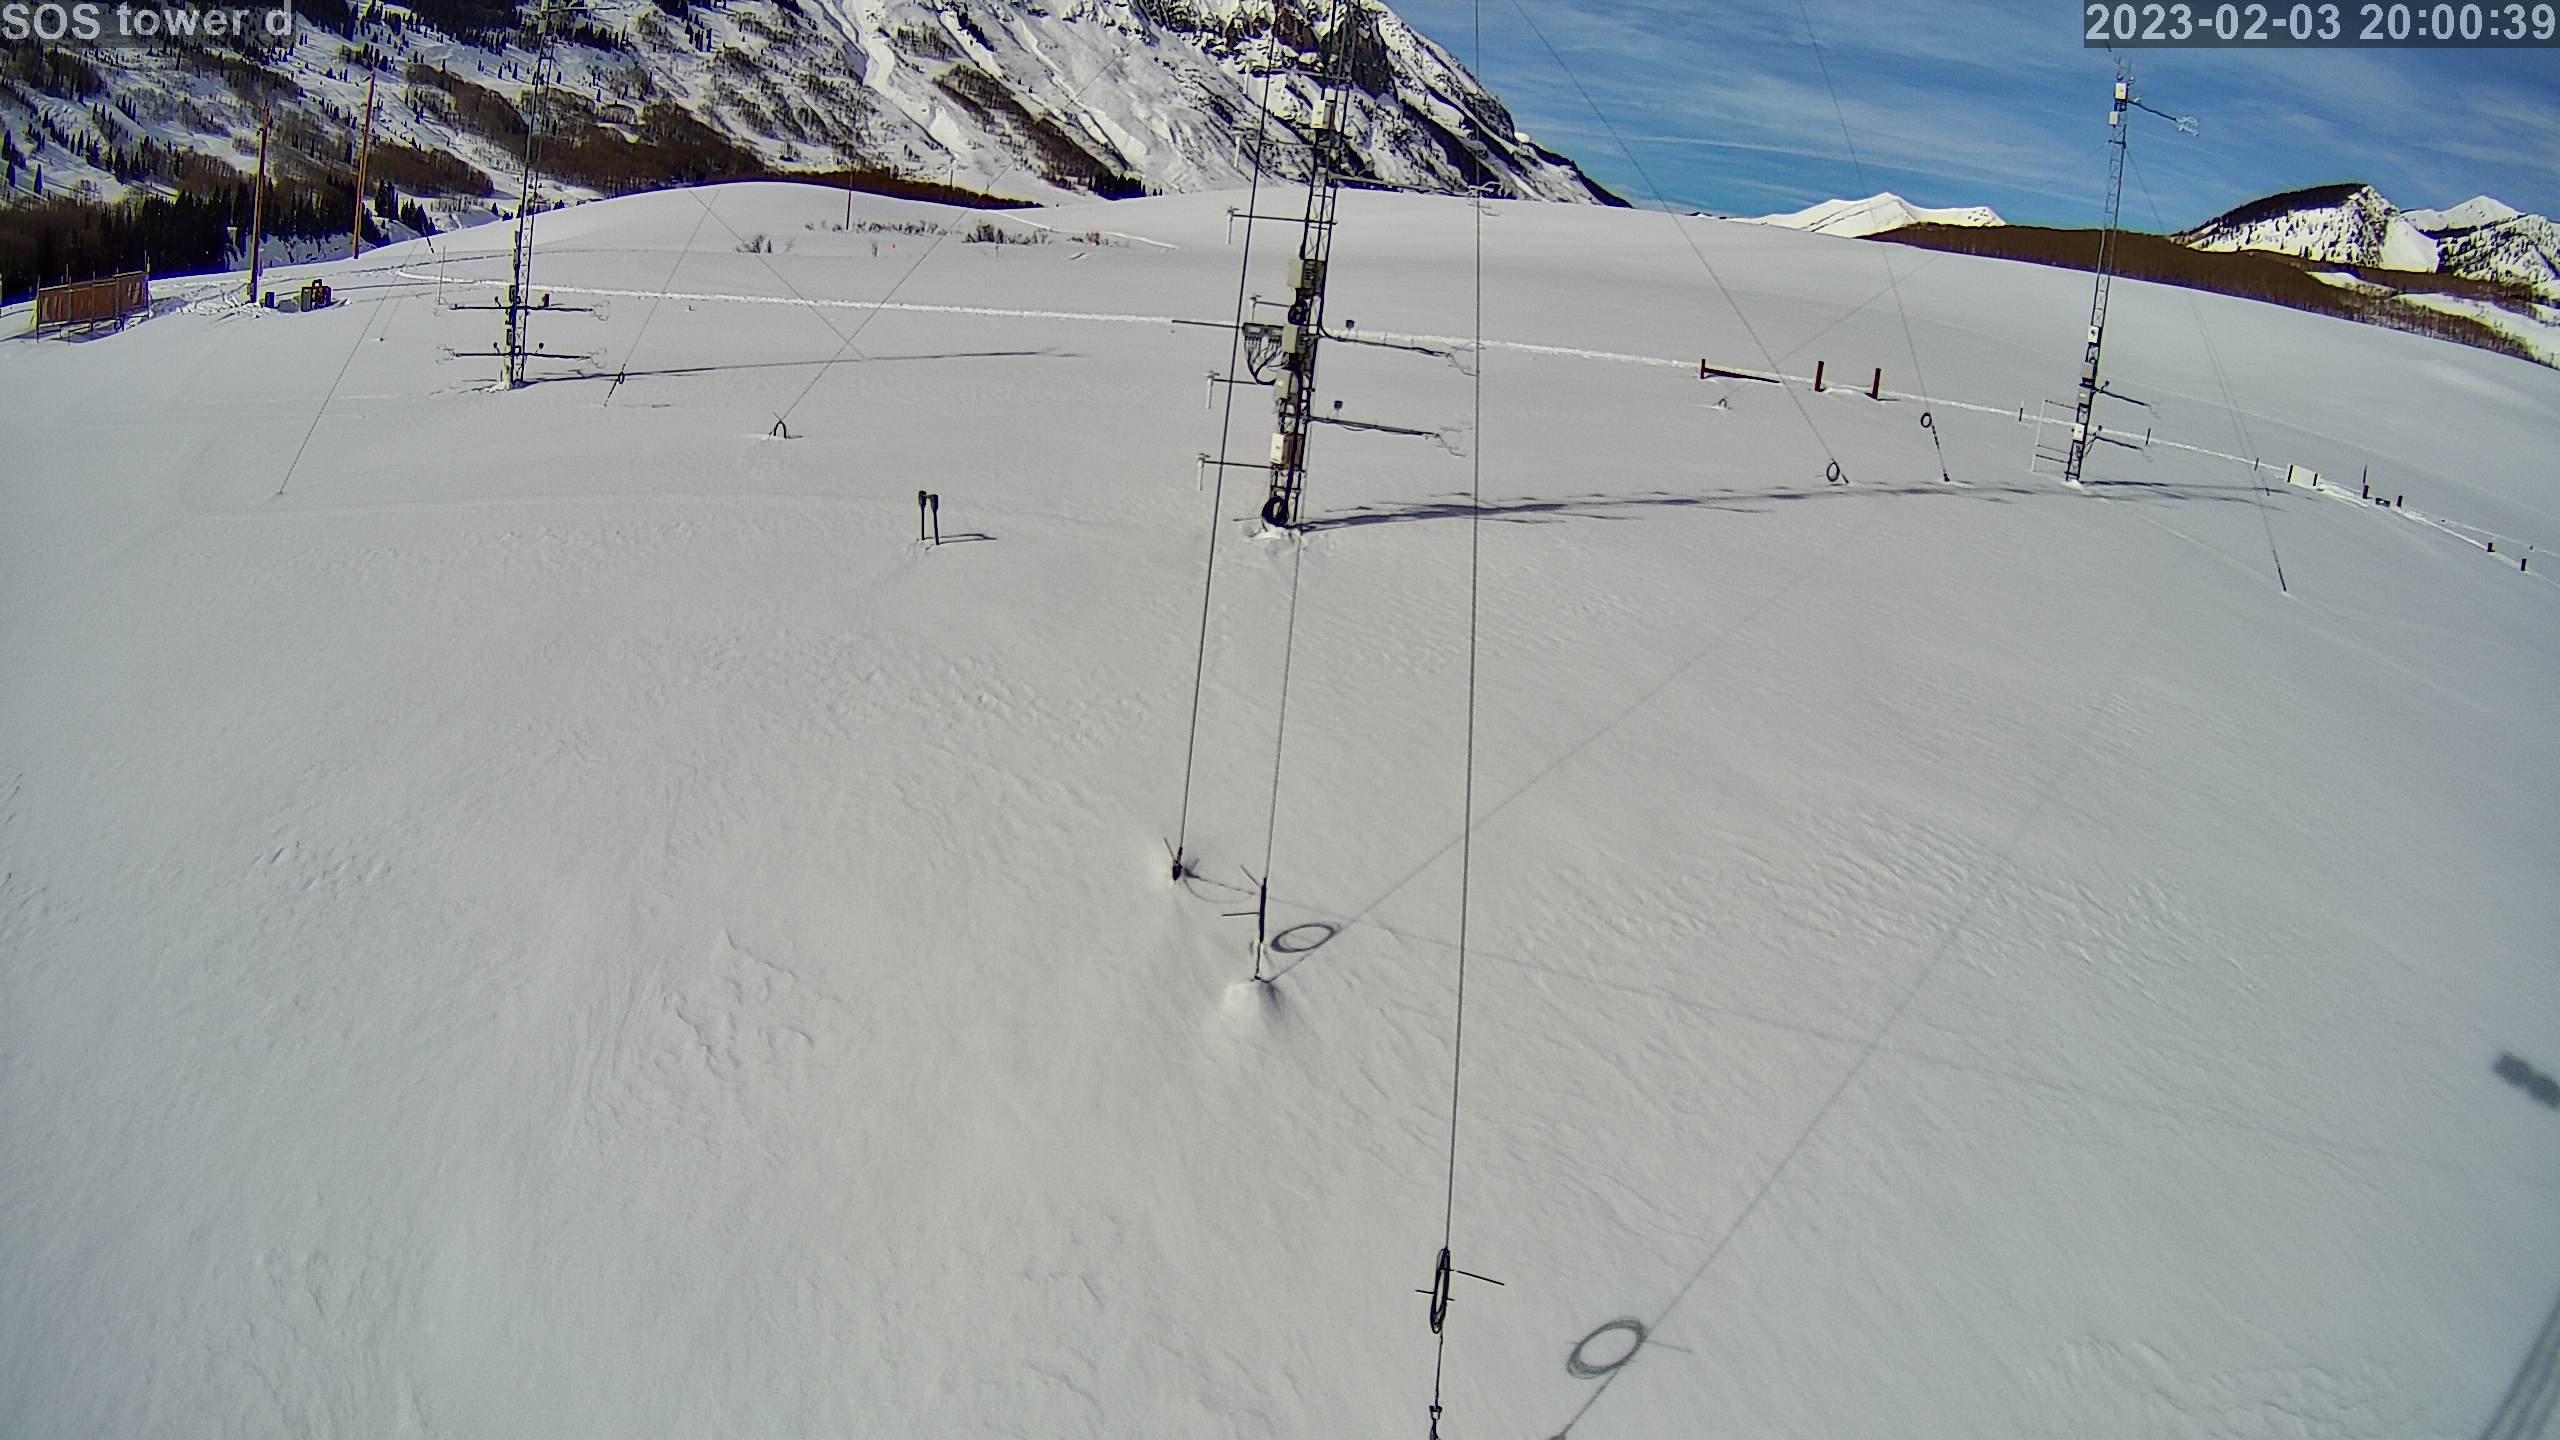
|
photo 2023020321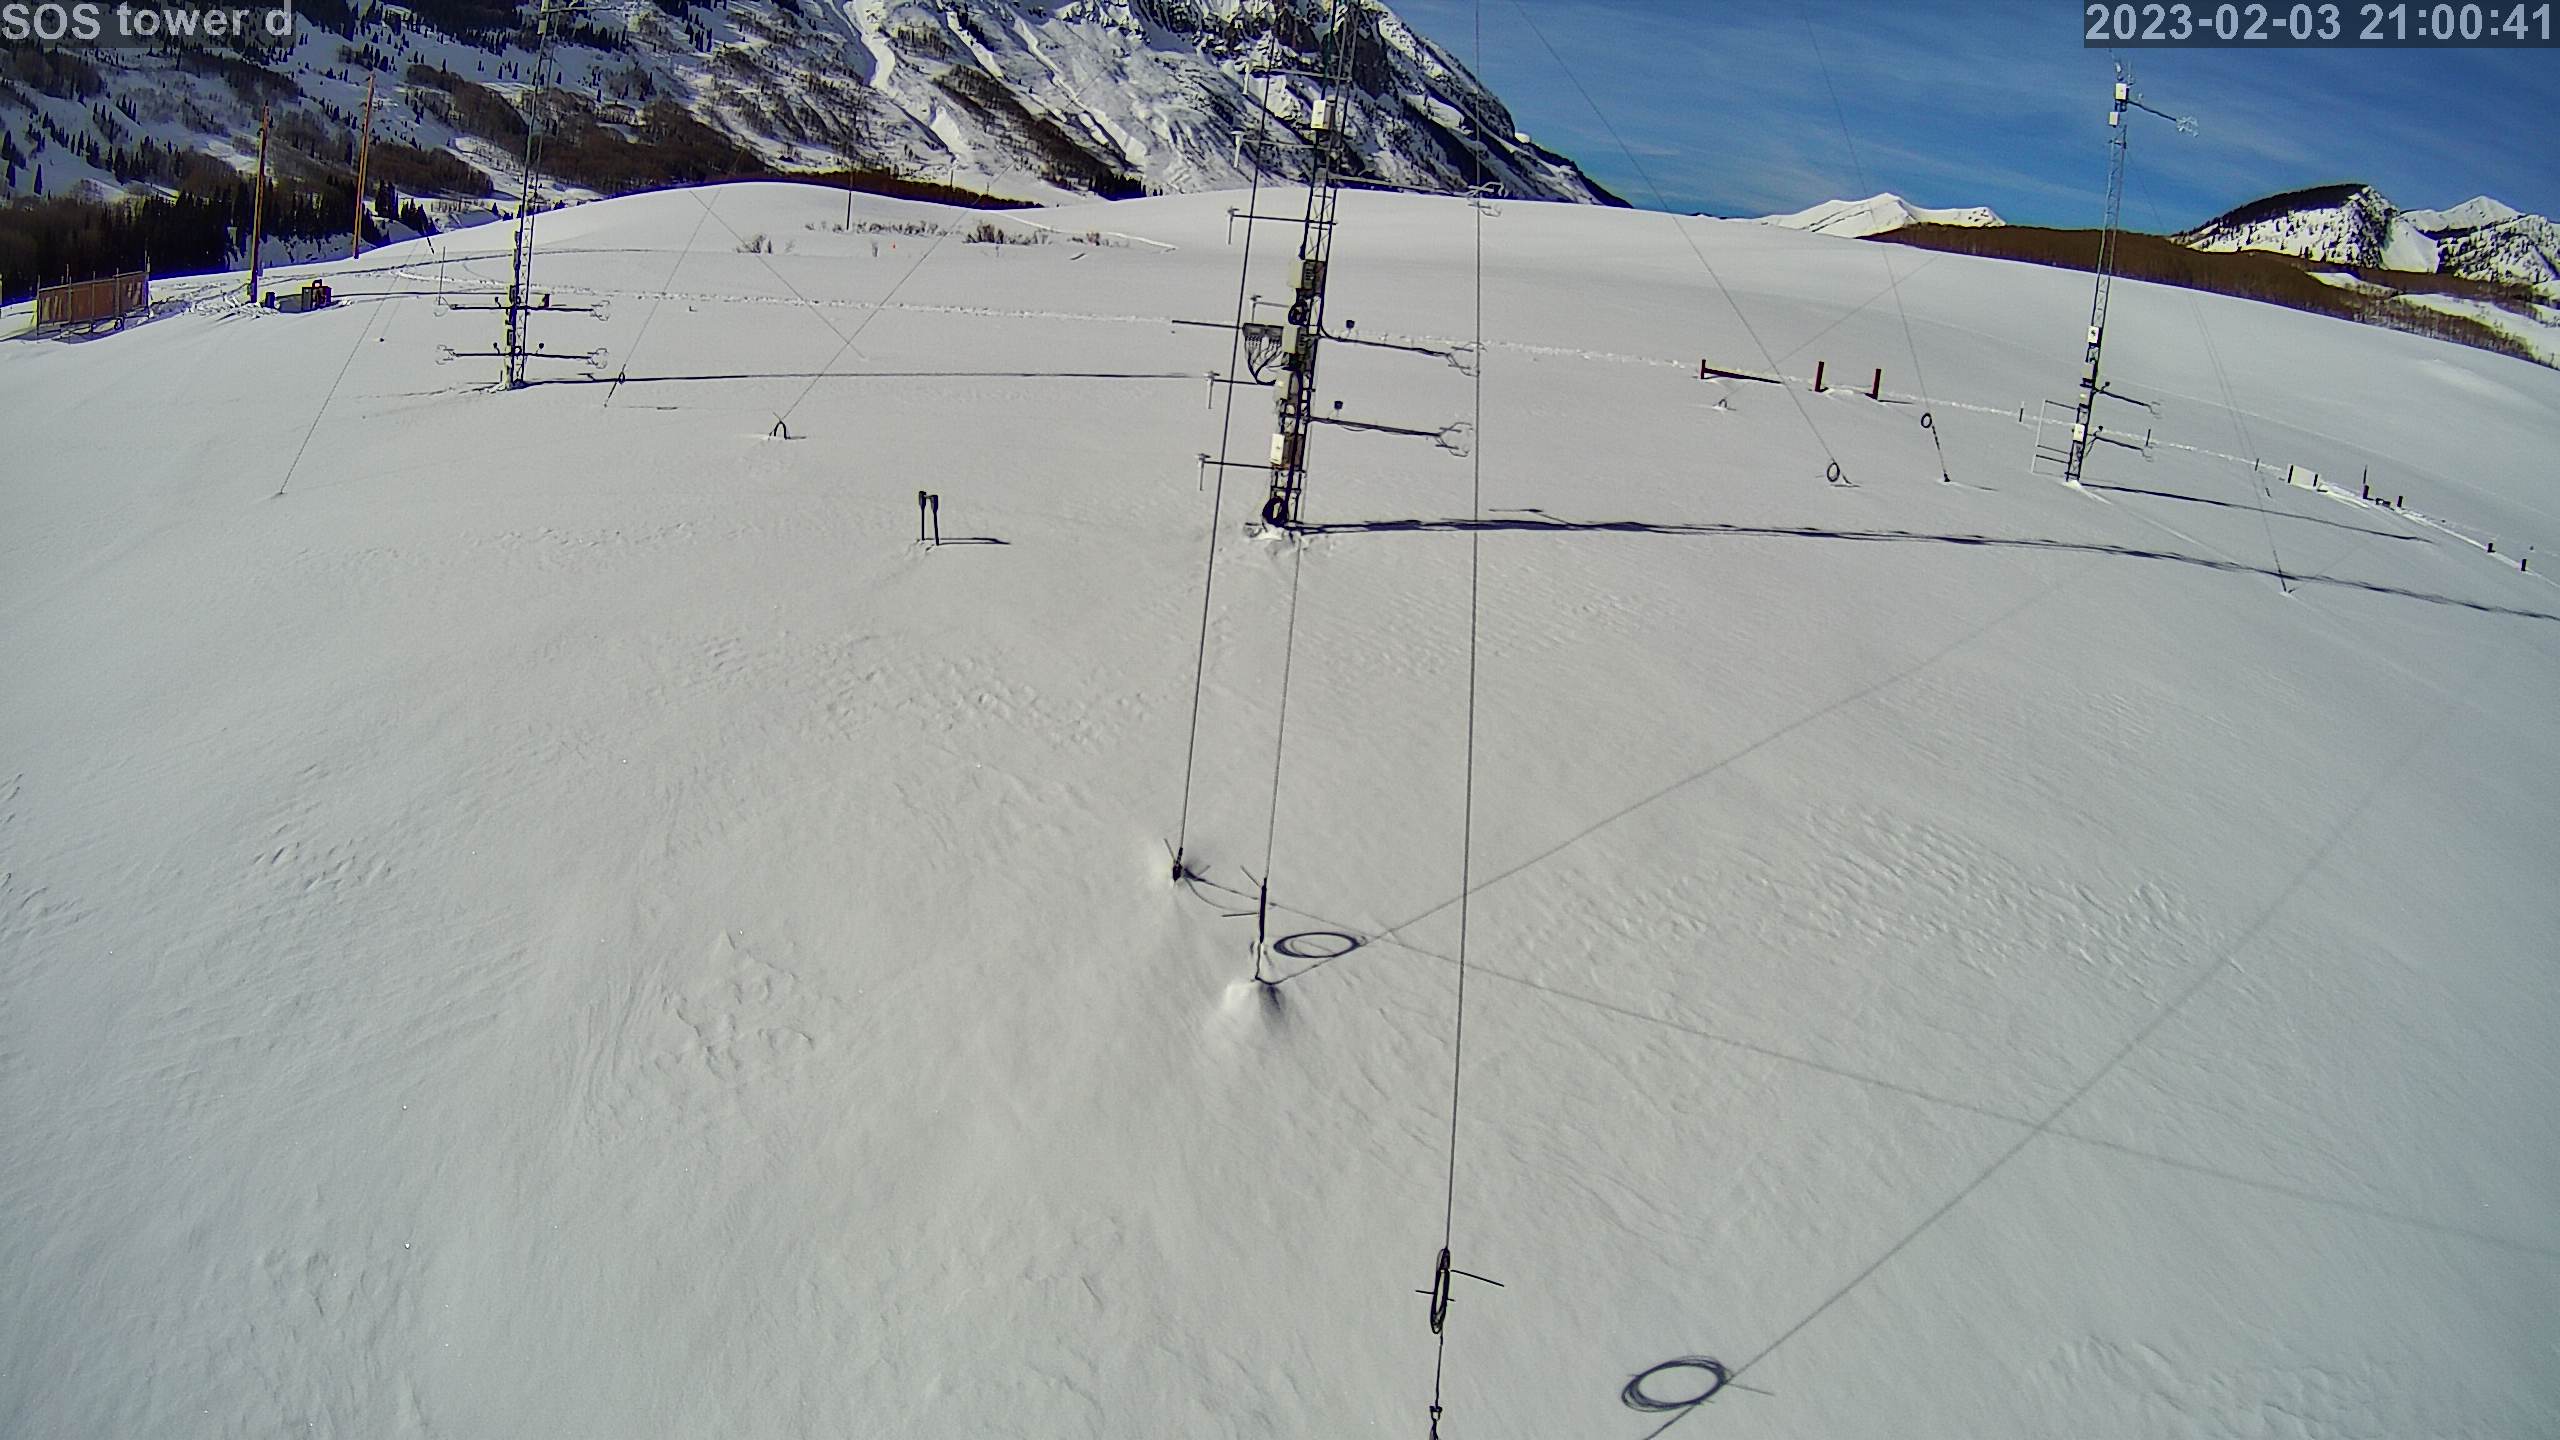
|
photo 2023020322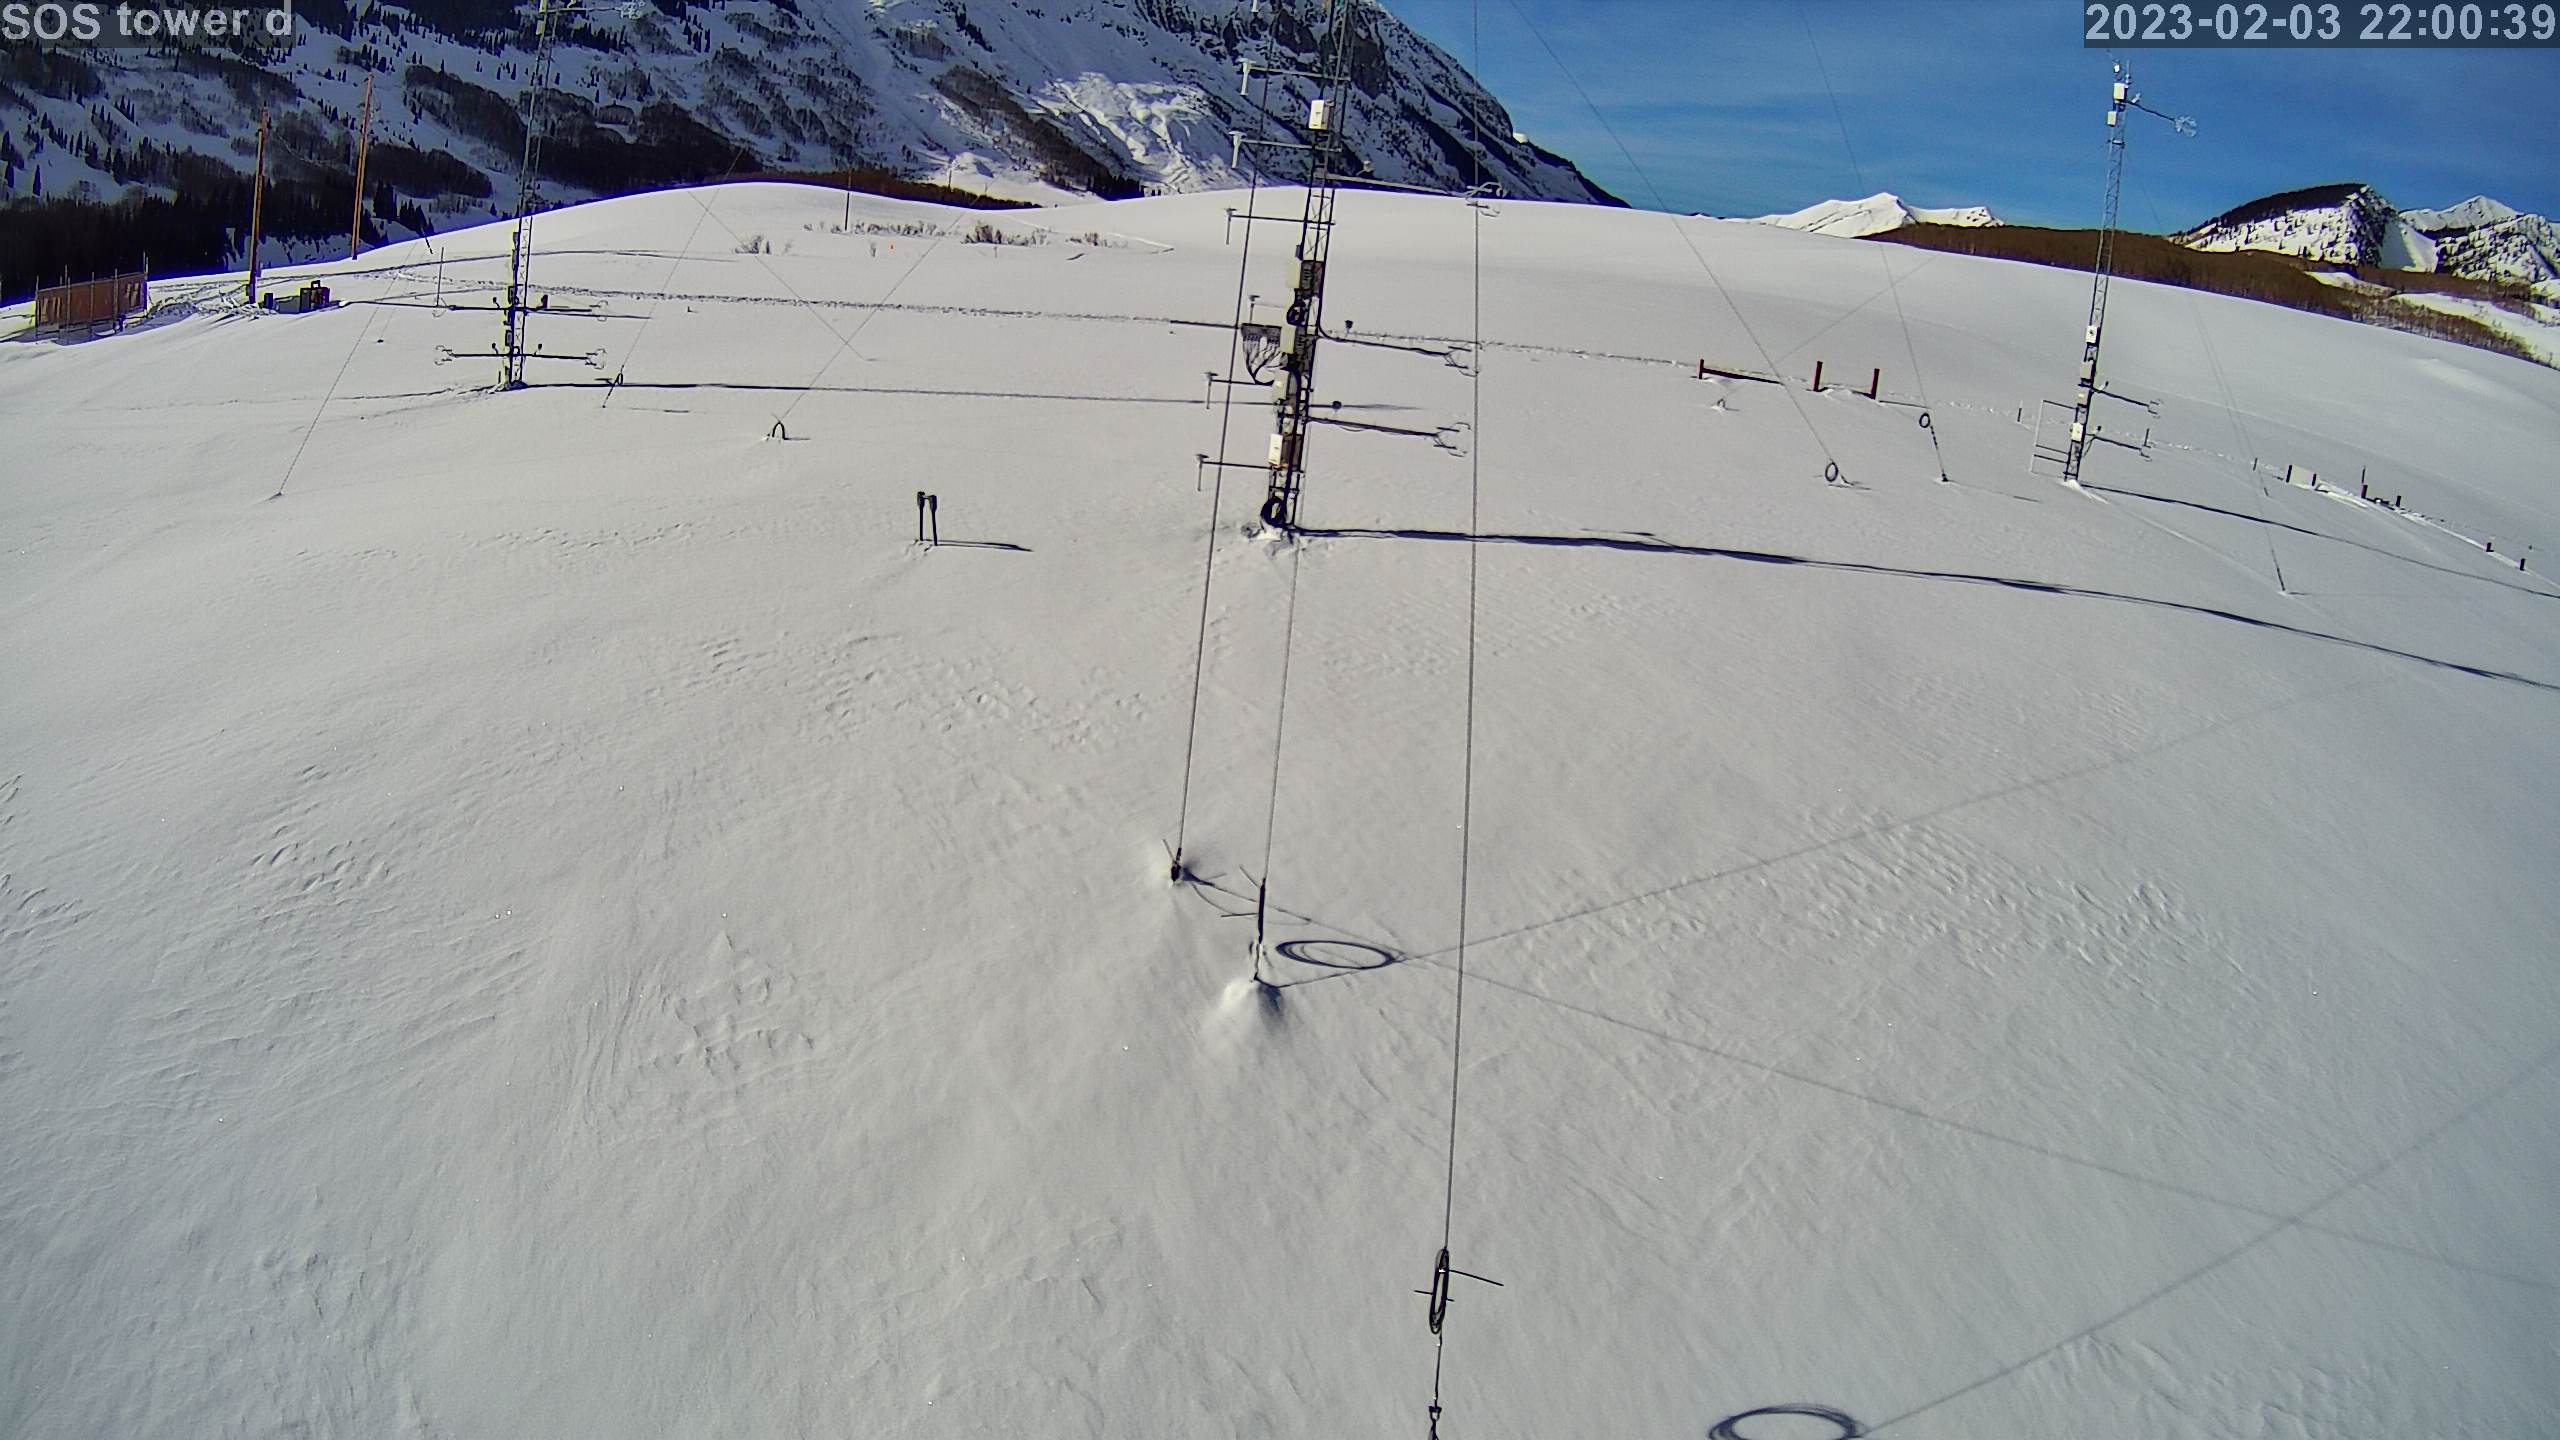
|
photo 2023020323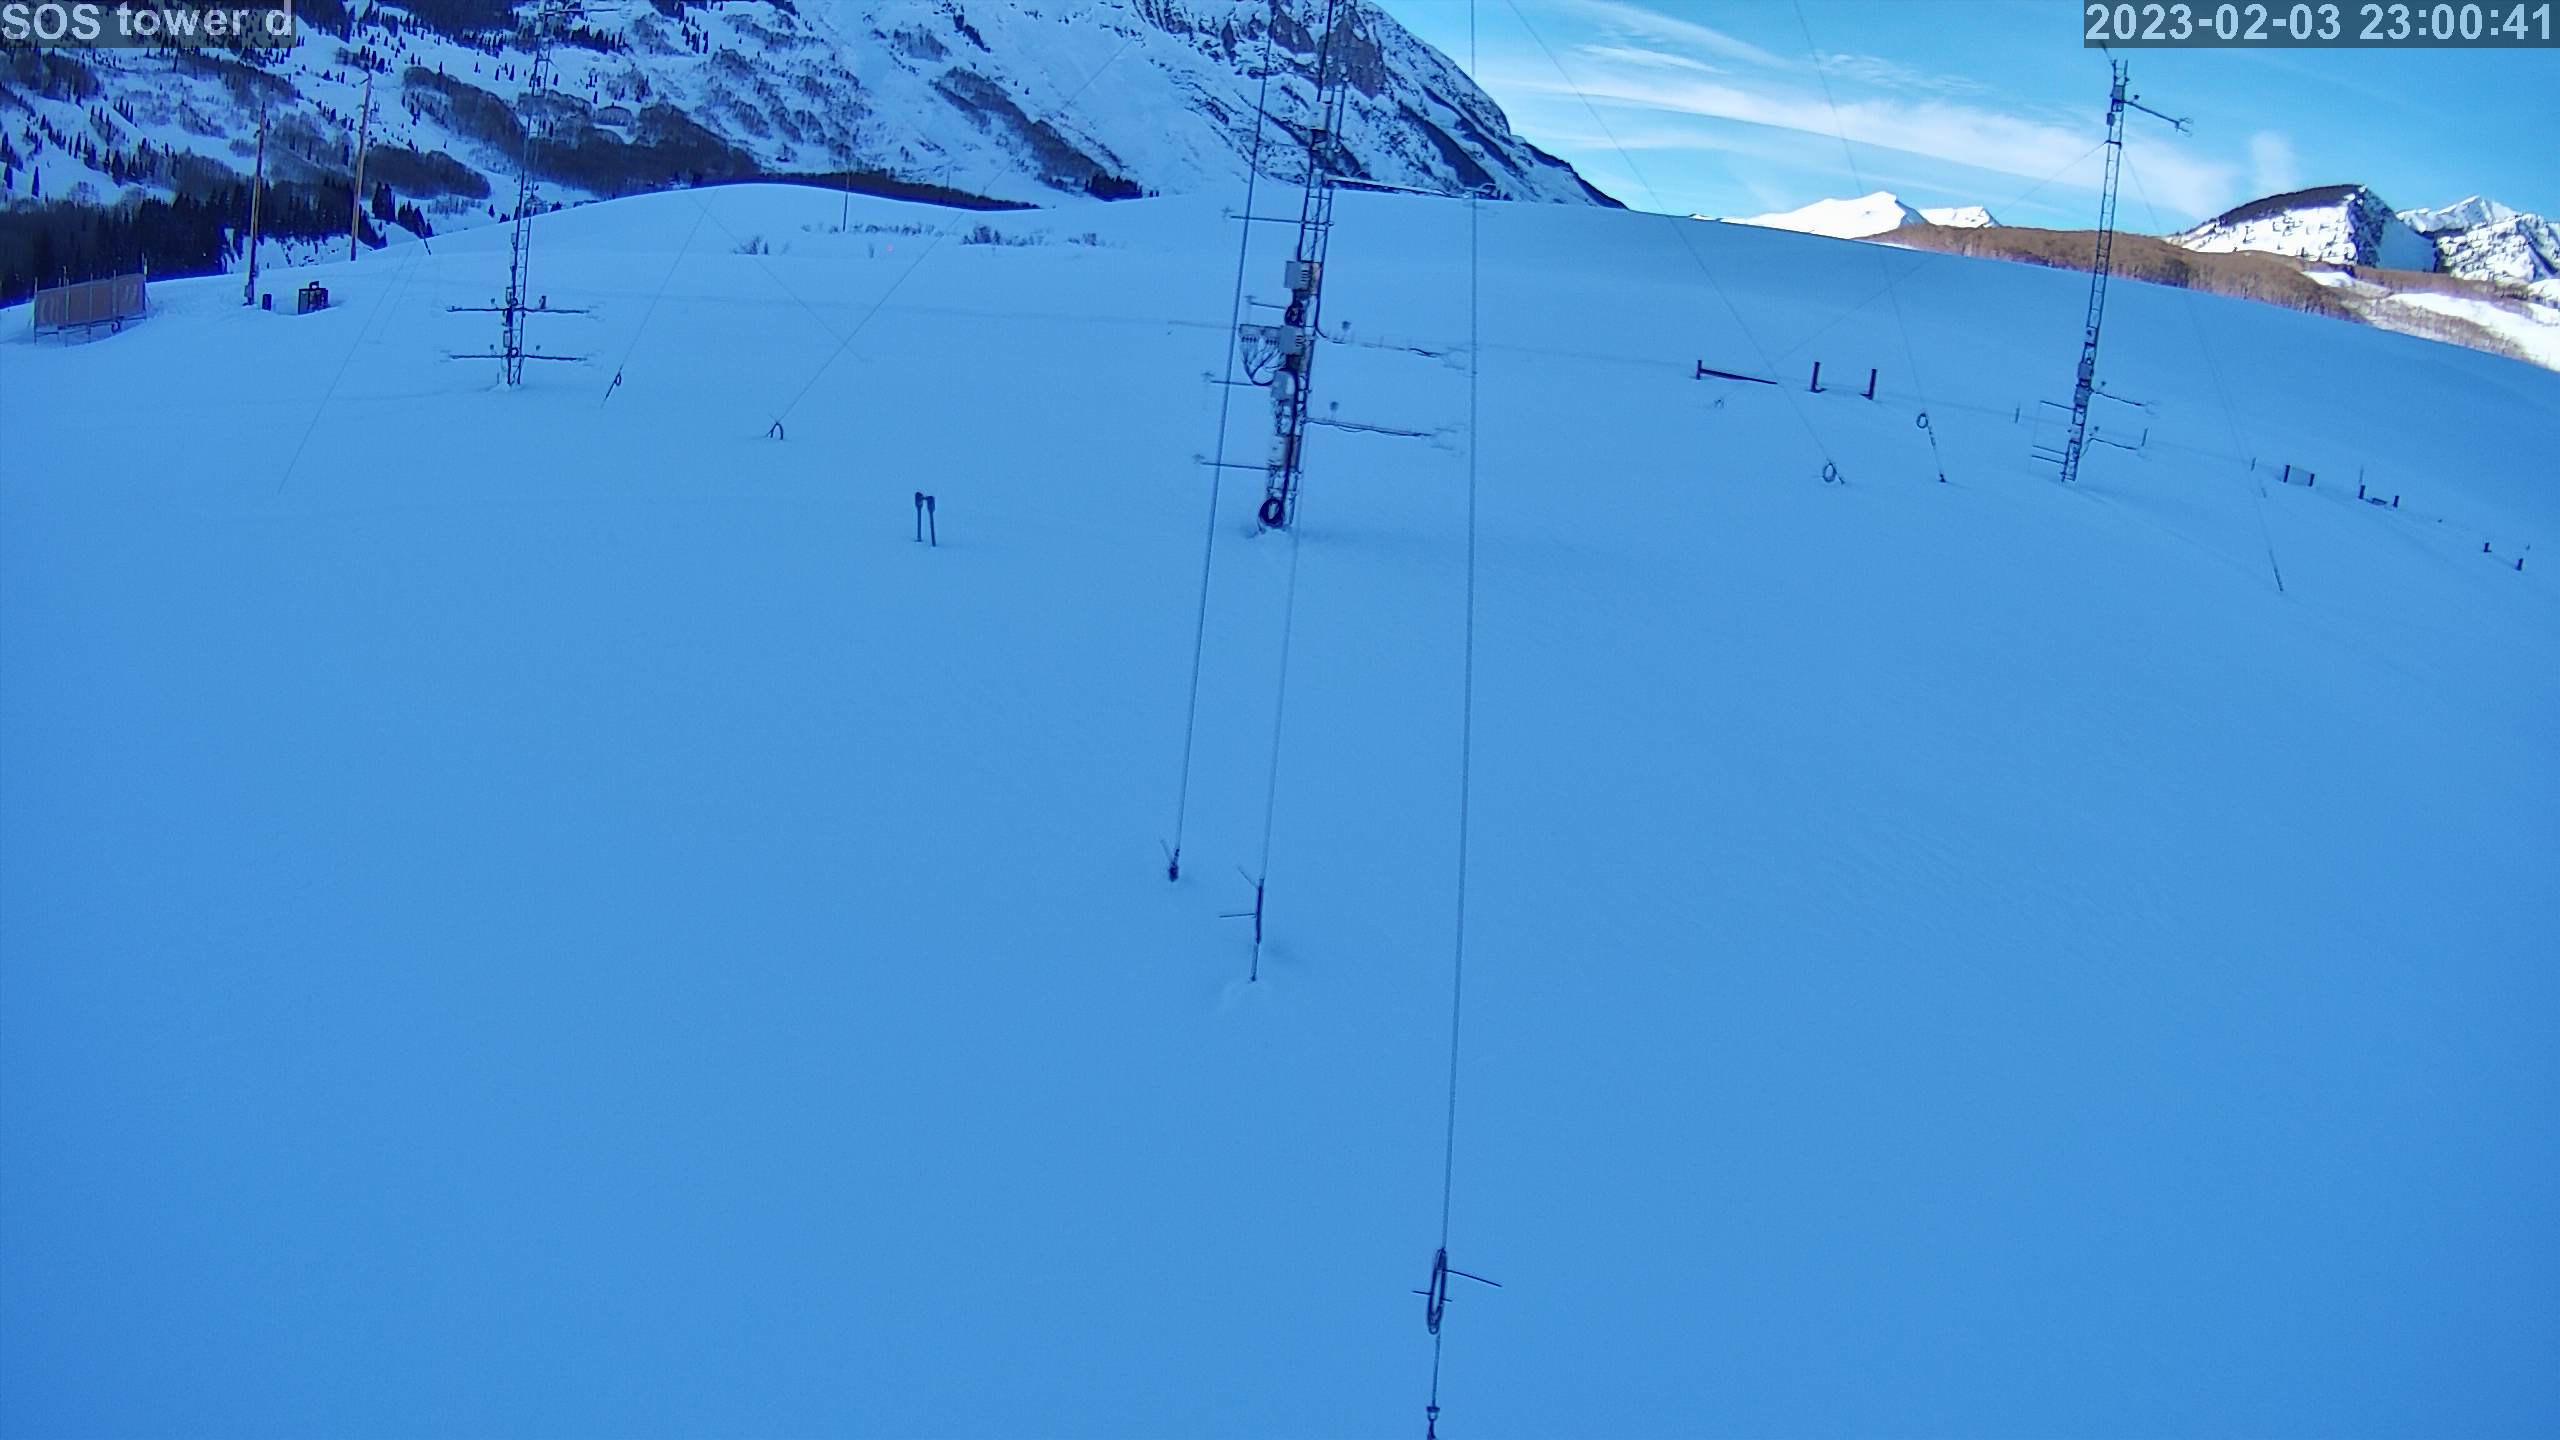
|