| Previous day | Select day | Next day |
The most recent plots are generally updated every 15 minutes. Use the browser reload button to make sure you are seeing the latest version of a plot.
In order to distinquish the traces on the vertical profile plots, a slight offset in X is added to some traces. This is indicated by a "(n)" in the legend for the trace.
If you right-click on an image, most browsers will provide a menu to download or display the plot in another window.
photo 20230131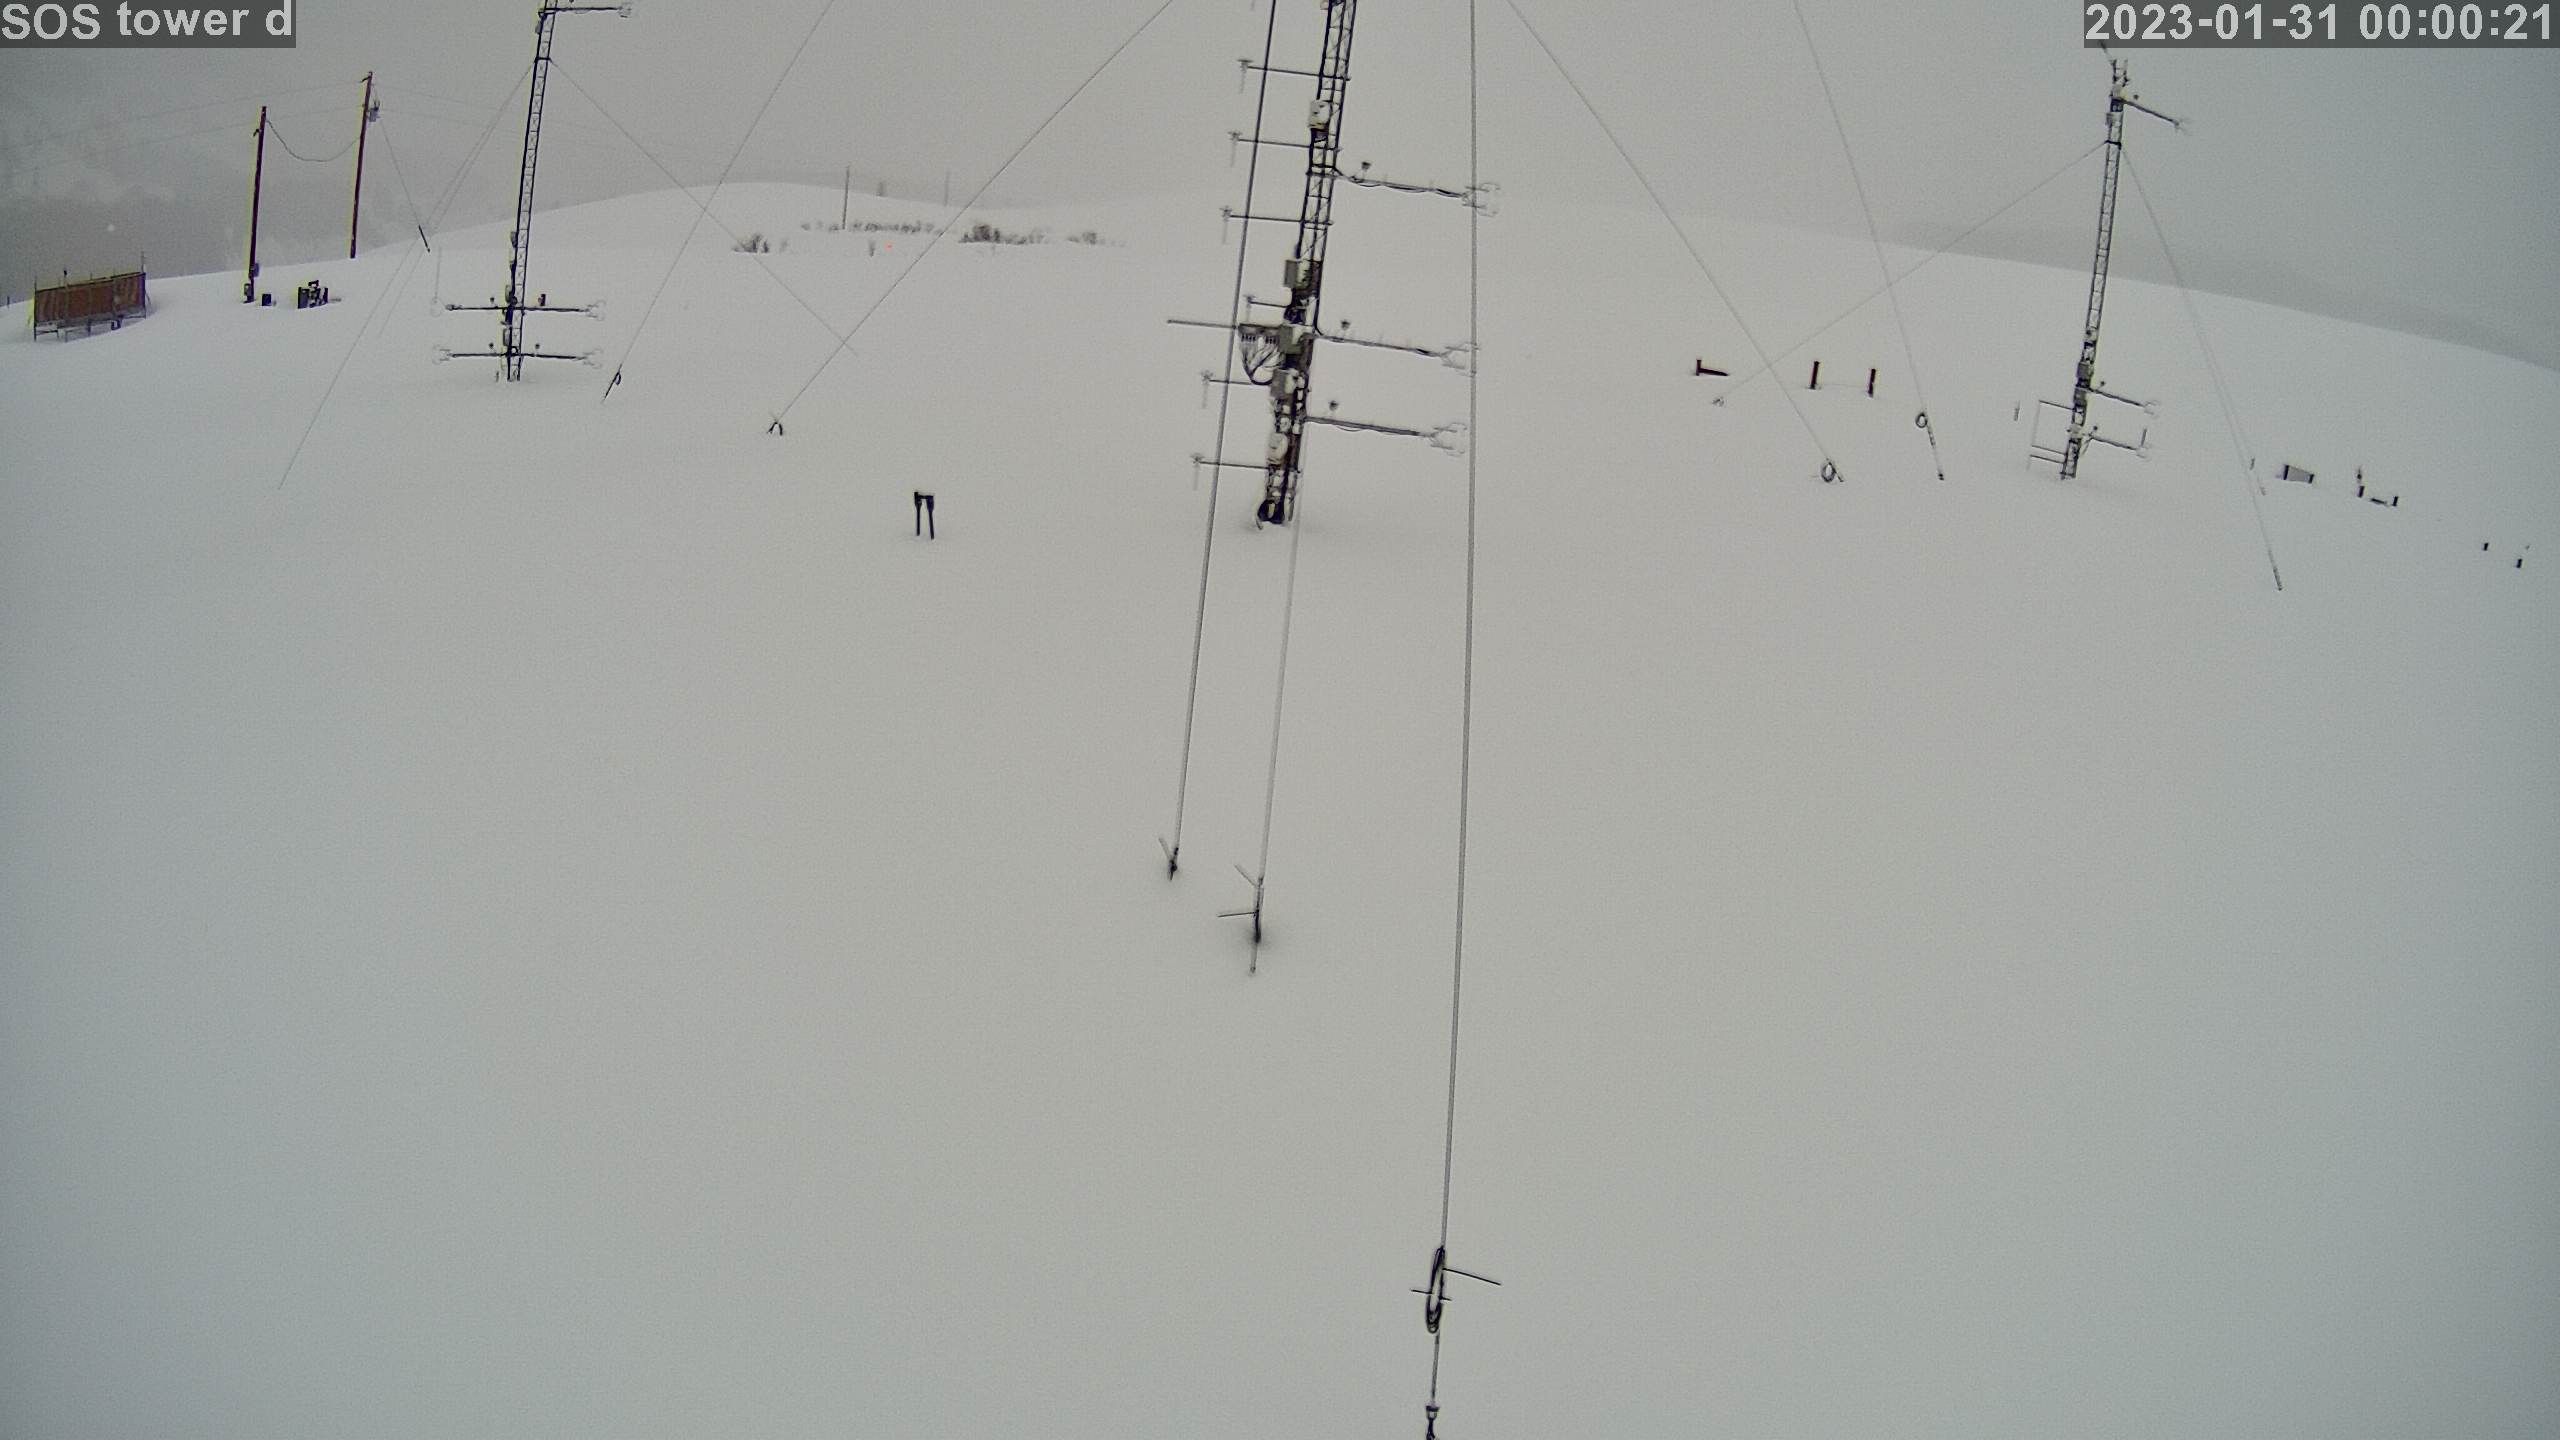
|
photo 2023013101
|
photo 2023013102
|
photo 2023013103
|
photo 2023013104
|
photo 2023013105
|
photo 2023013106
|
photo 2023013107
|
photo 2023013108
|
photo 2023013109
|
photo 2023013110
|
photo 2023013111
|
photo 2023013112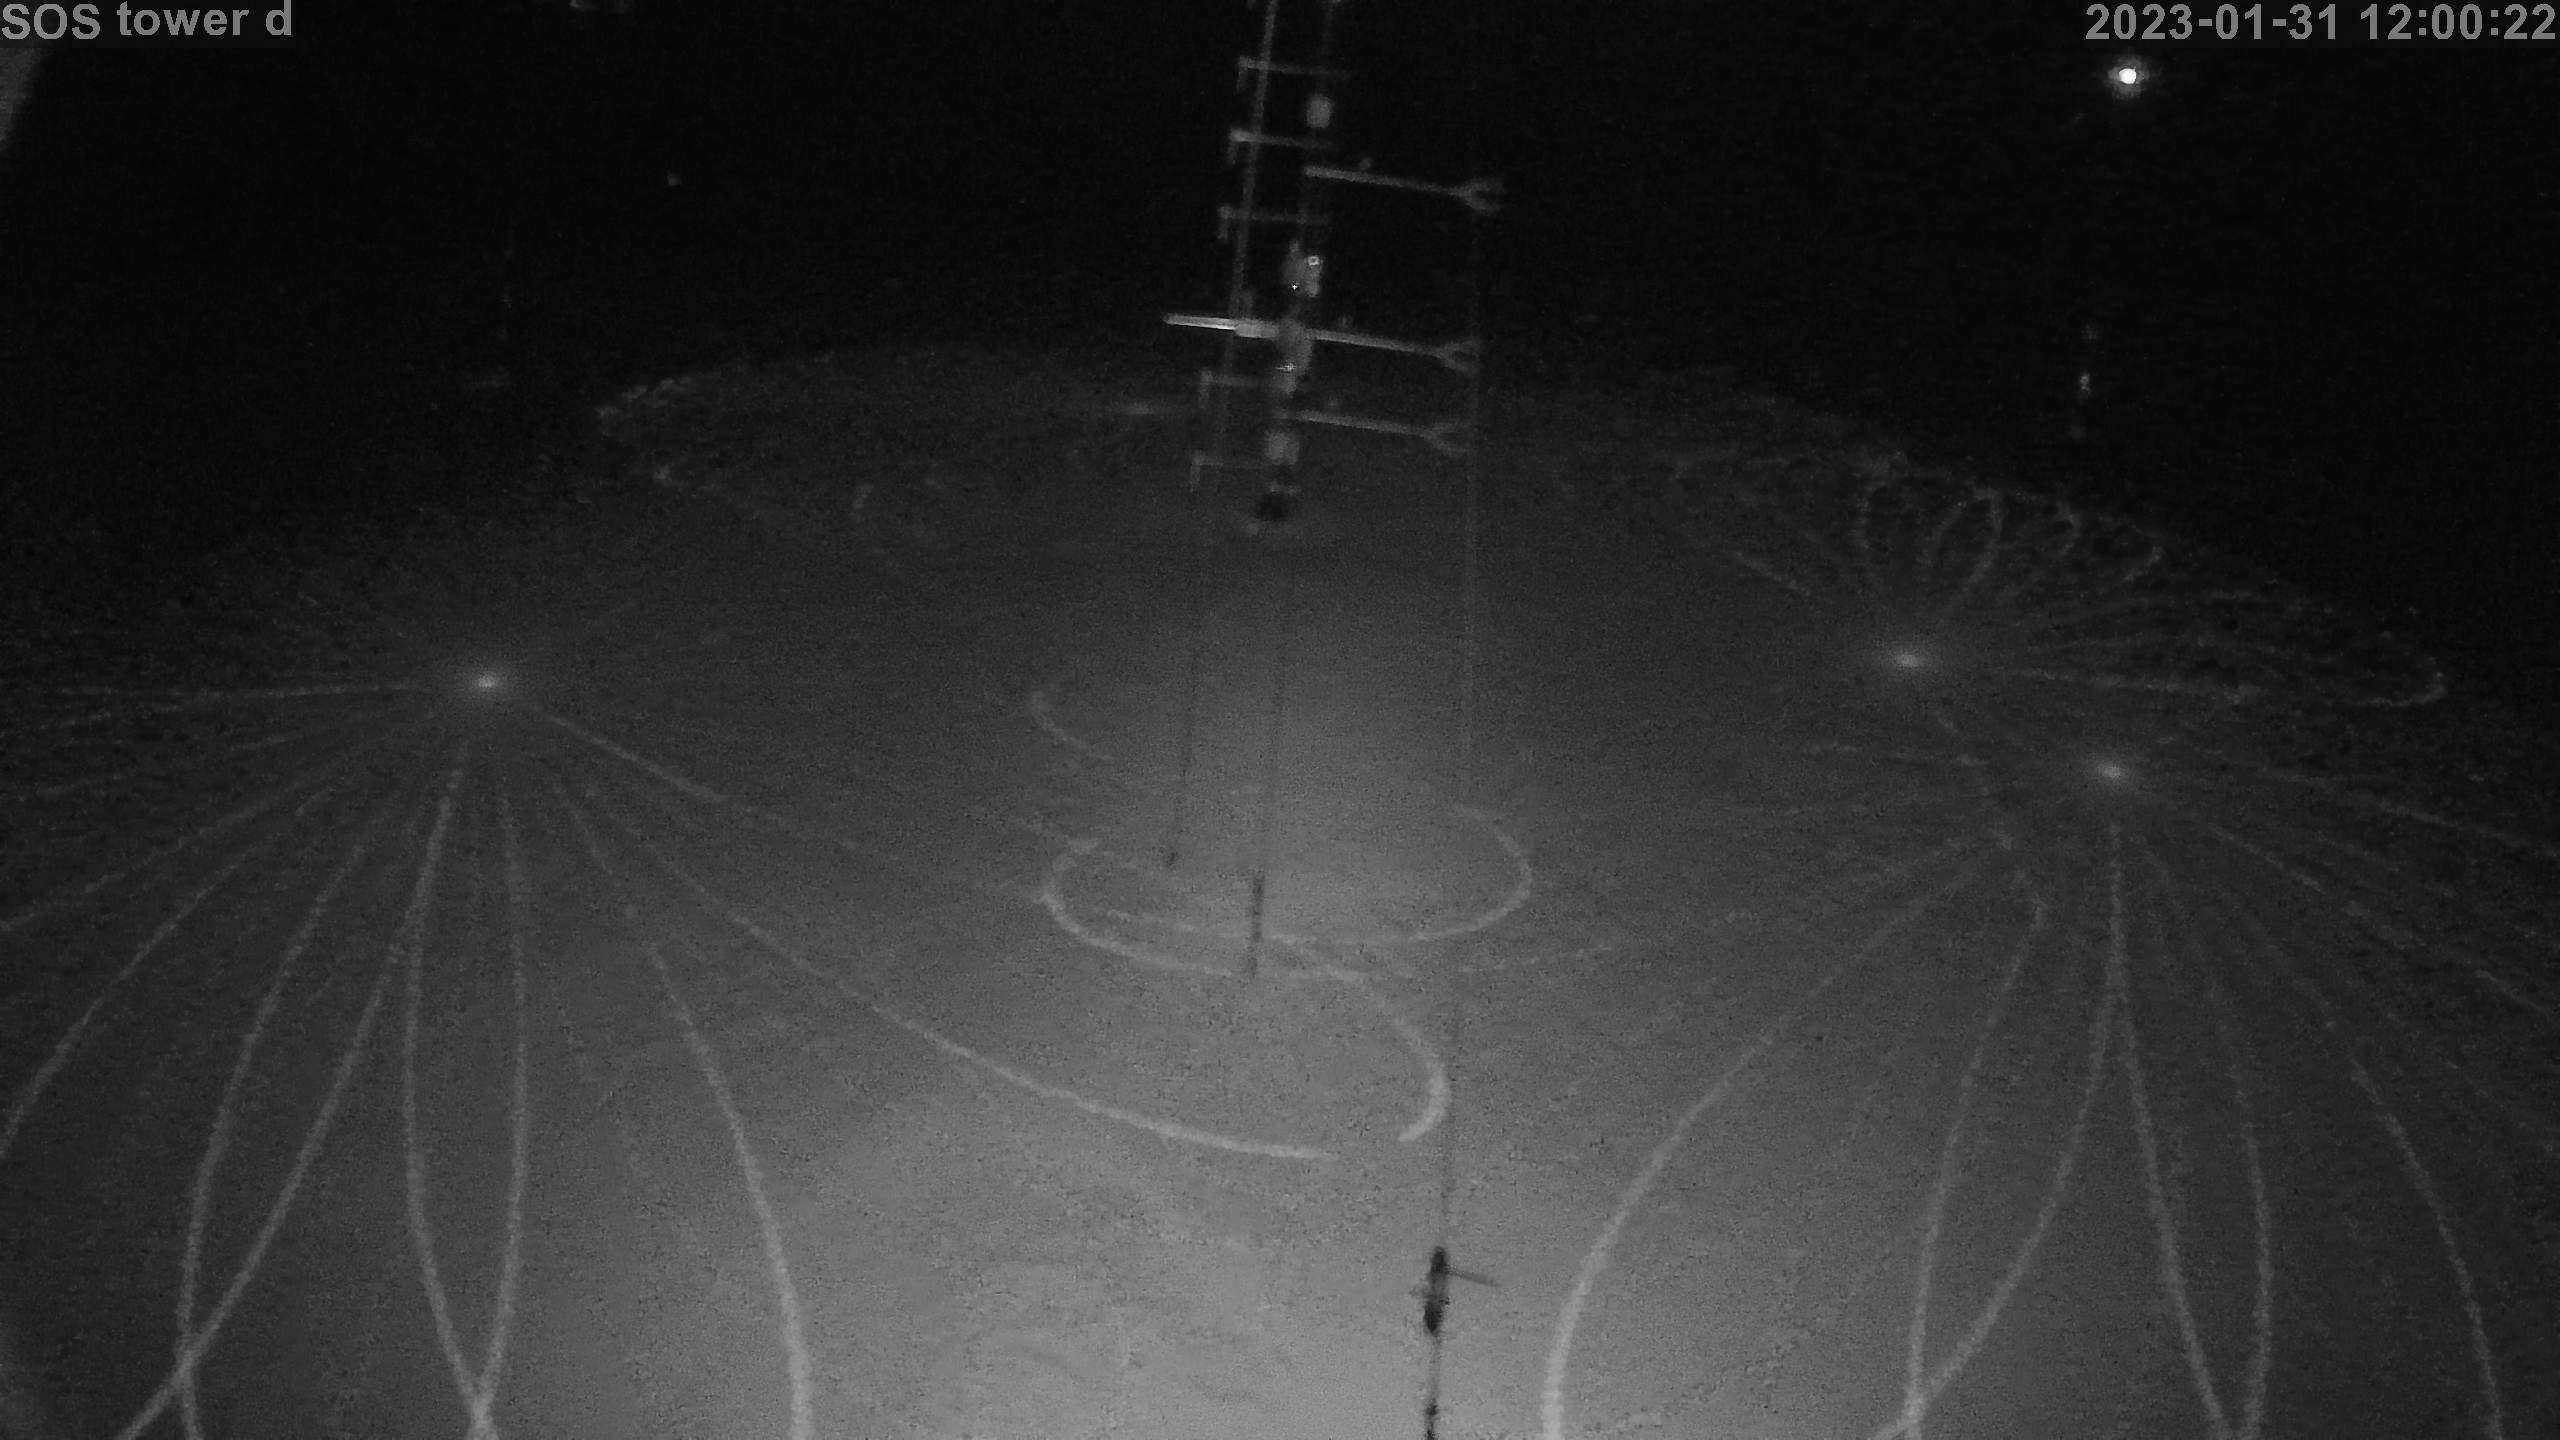
|
photo 2023013113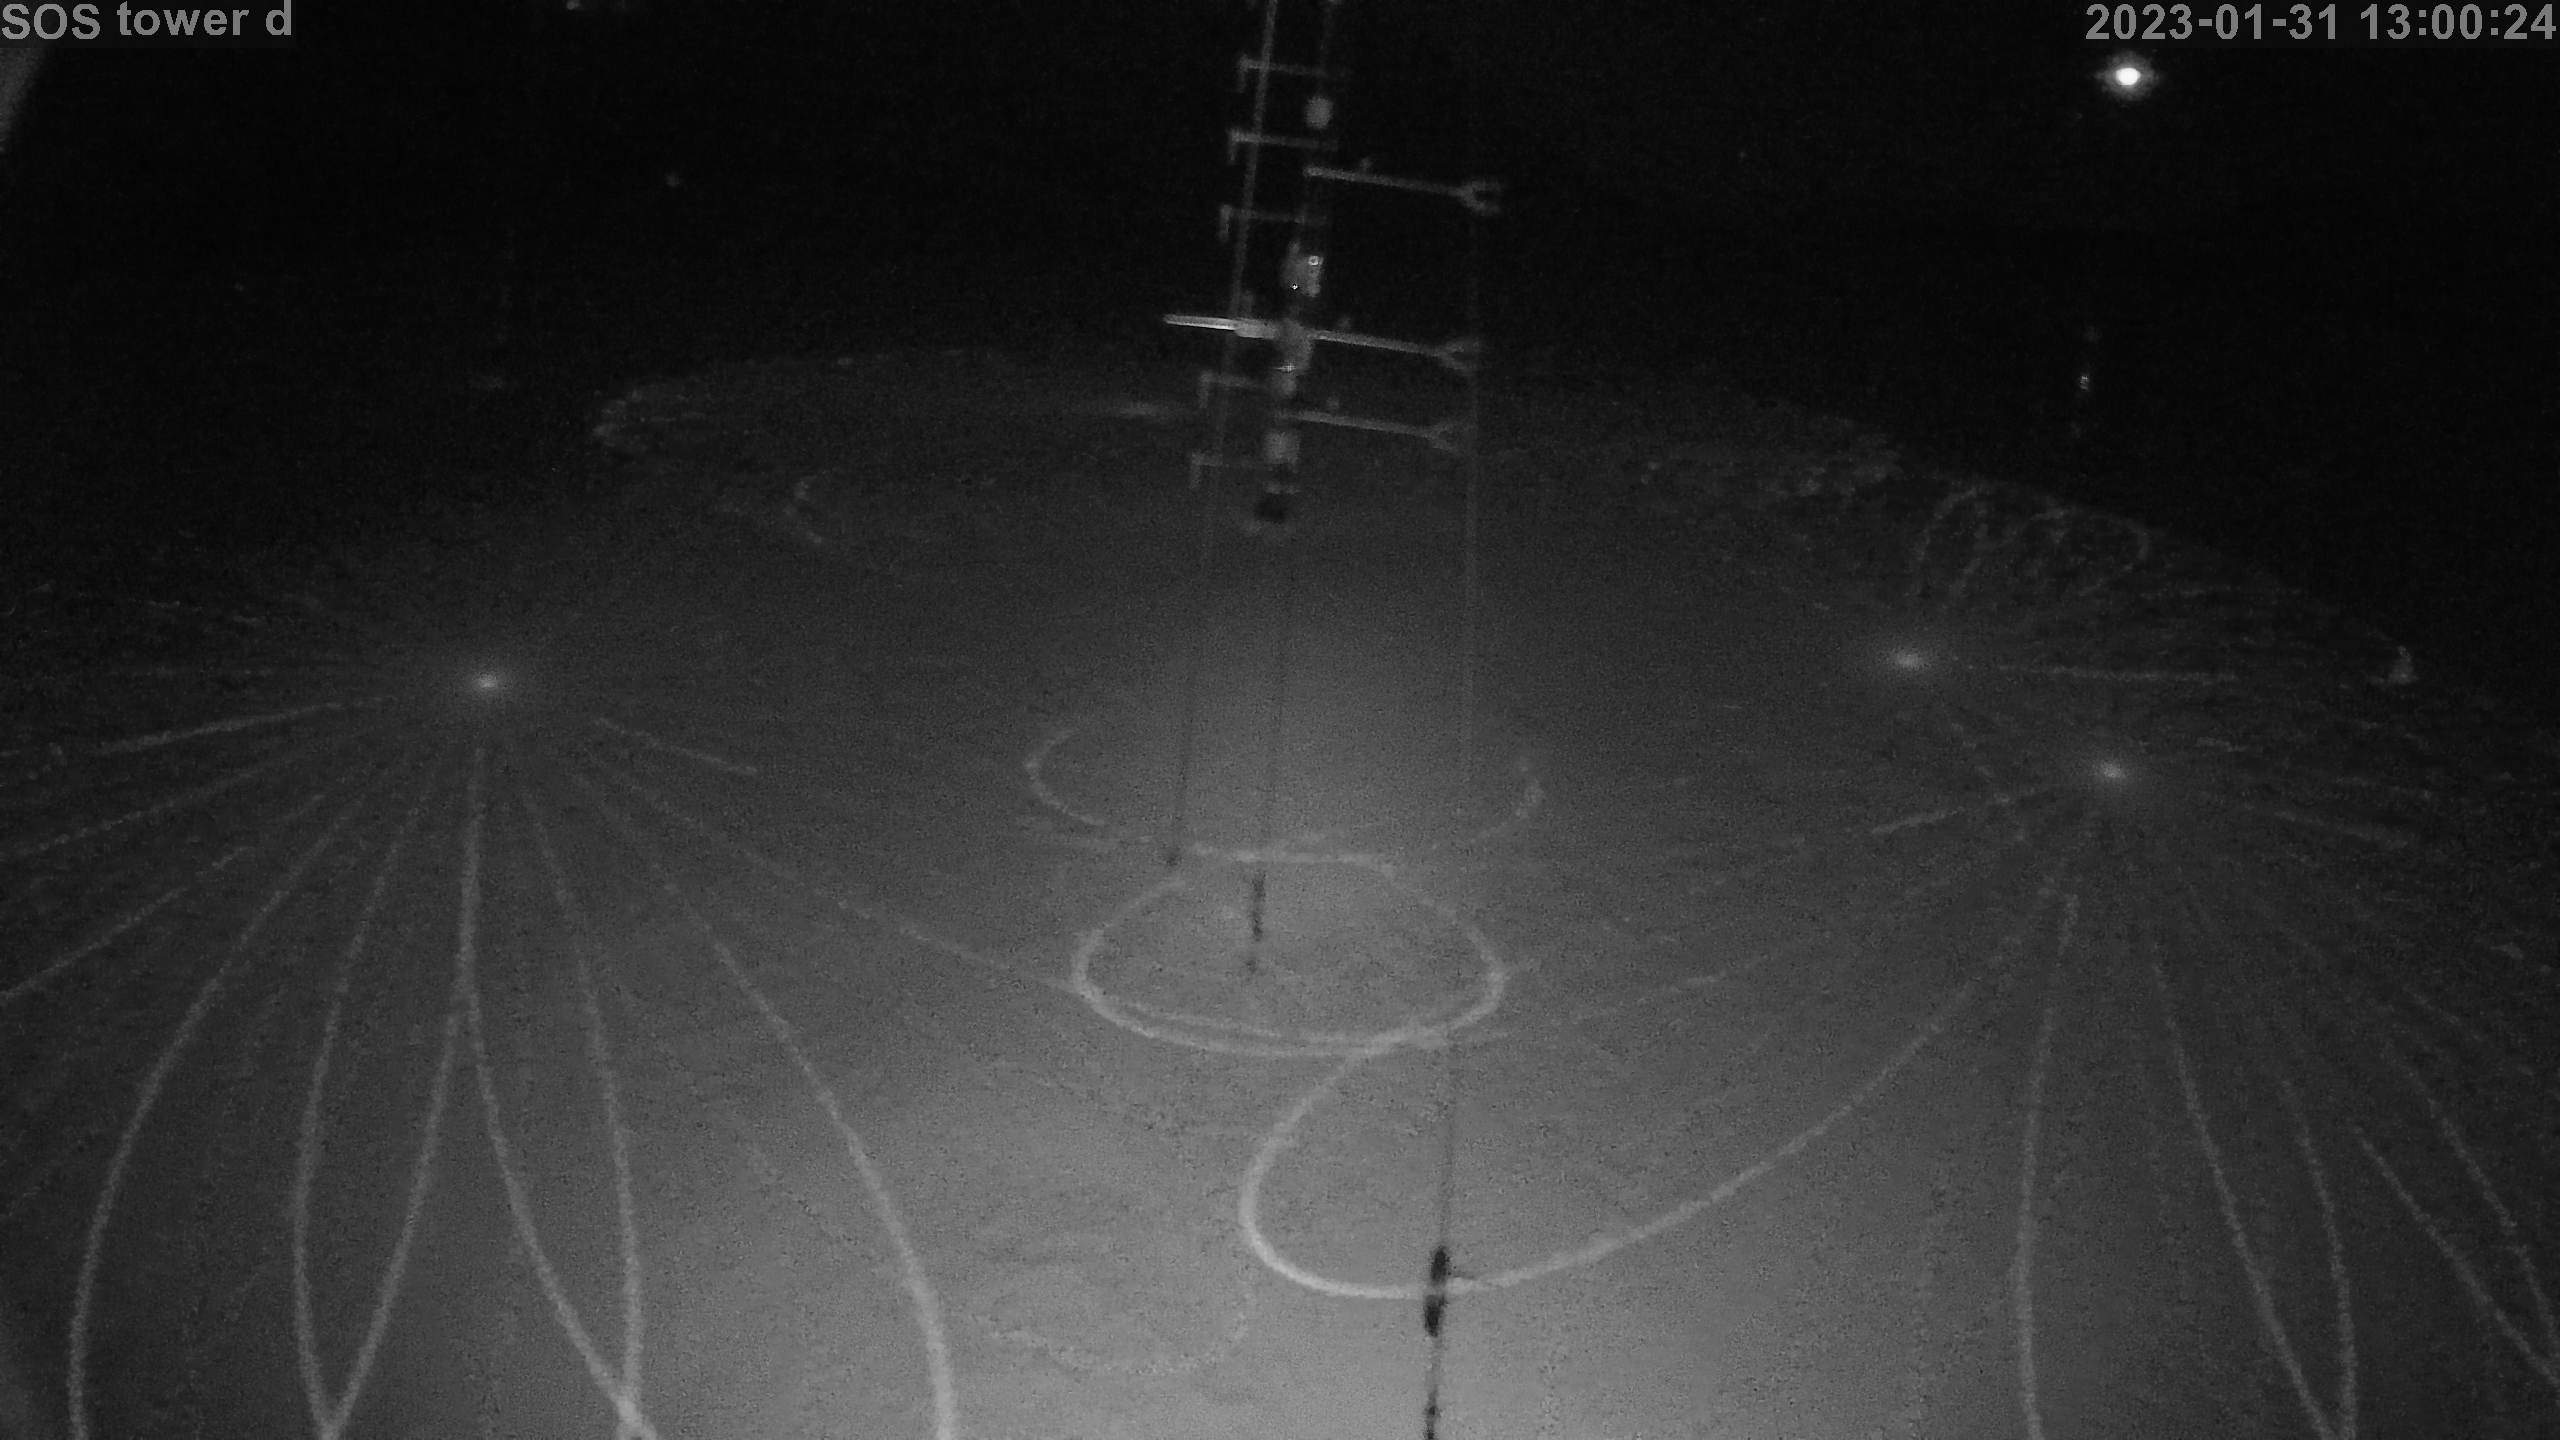
|
photo 2023013114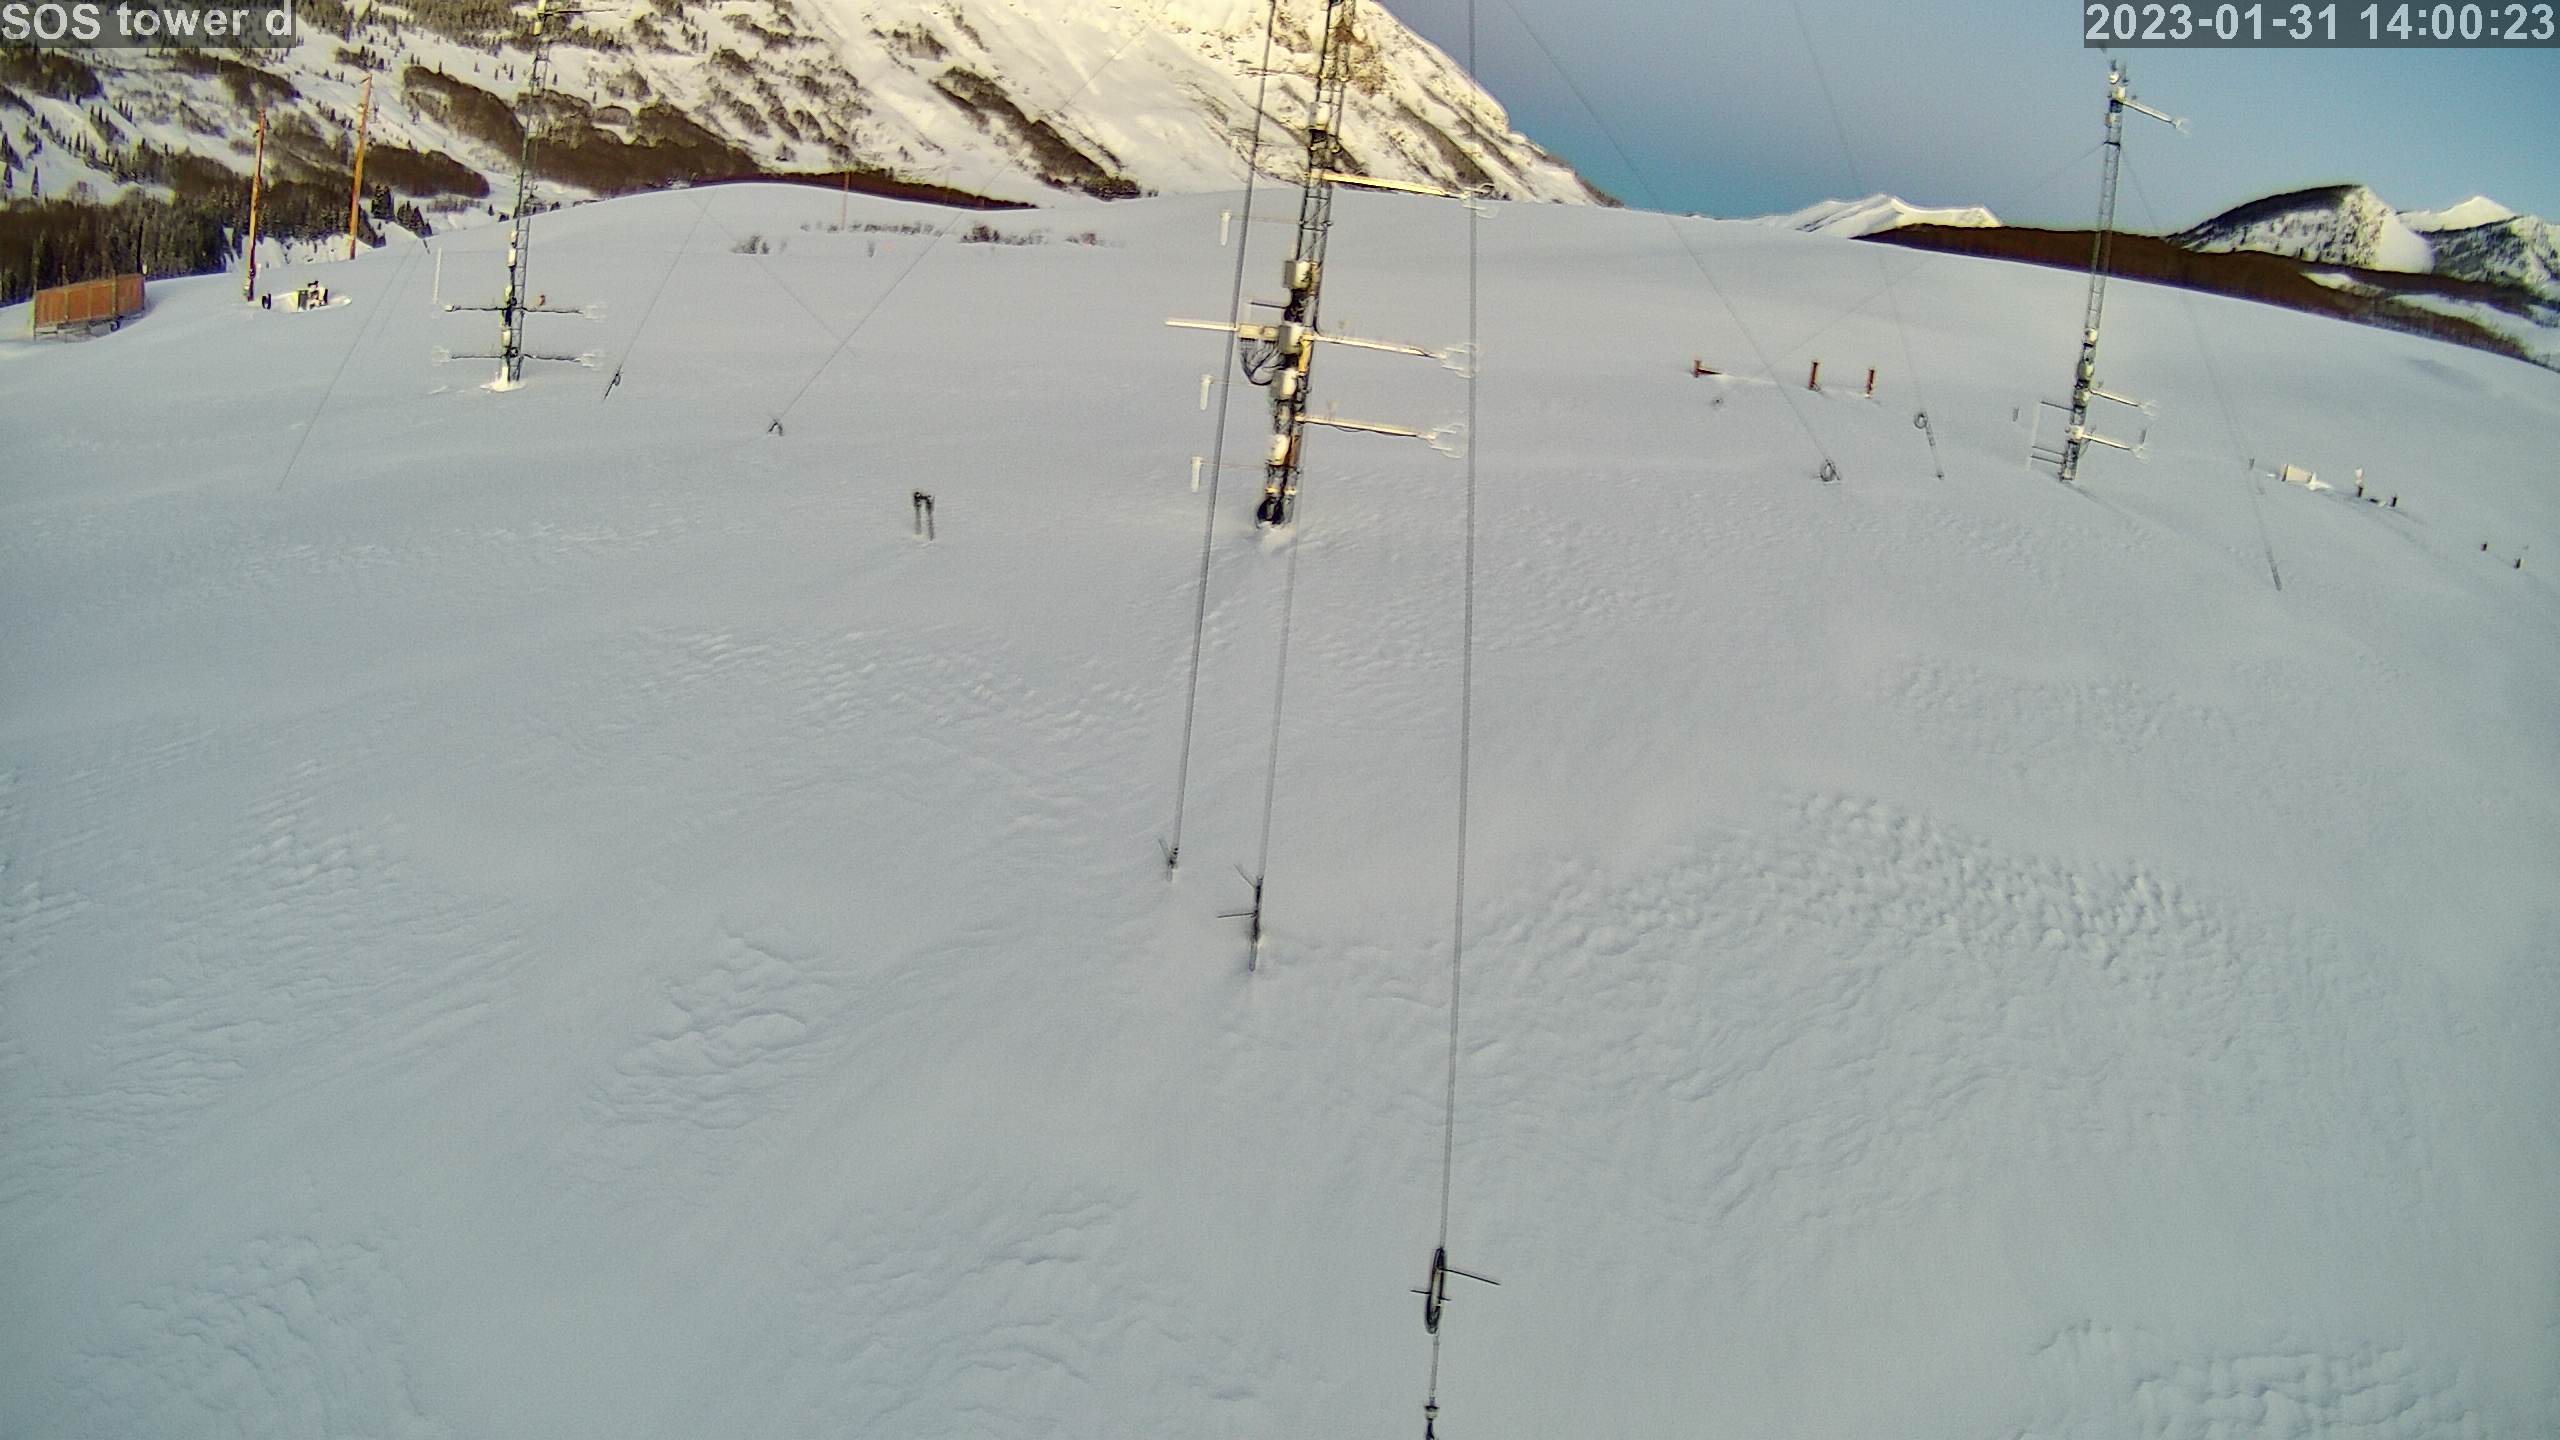
|
photo 2023013115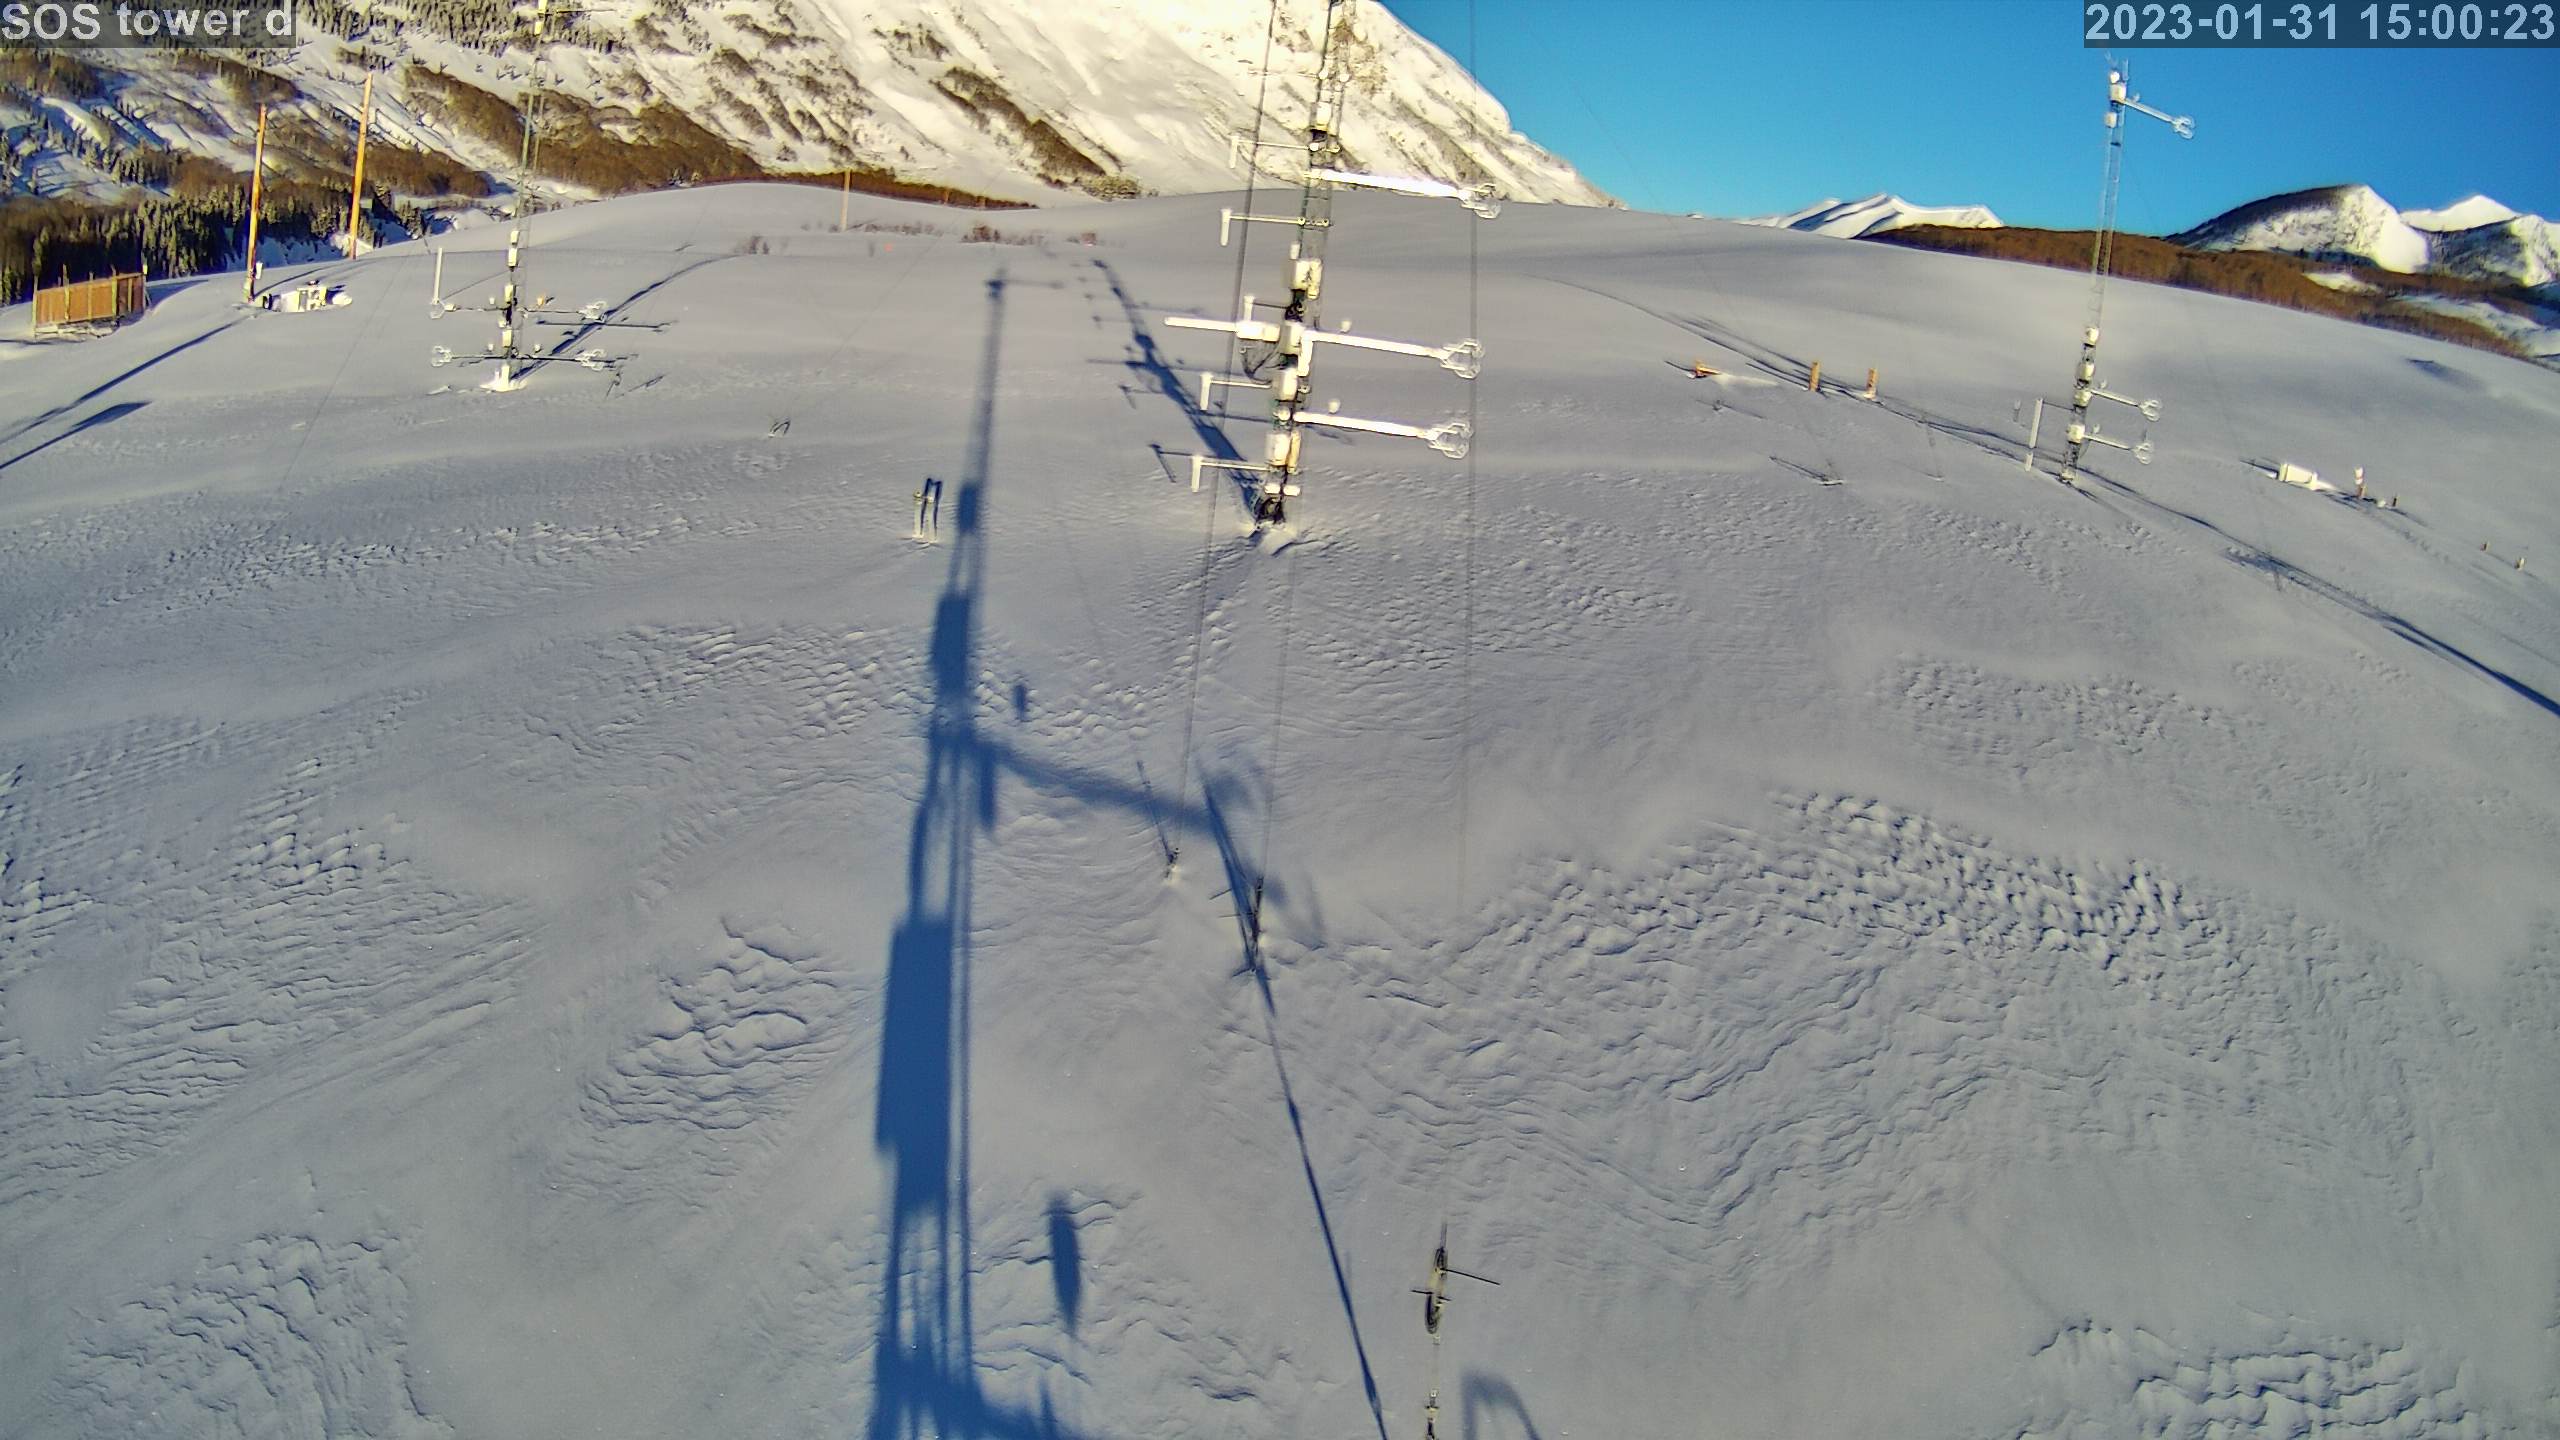
|
photo 2023013116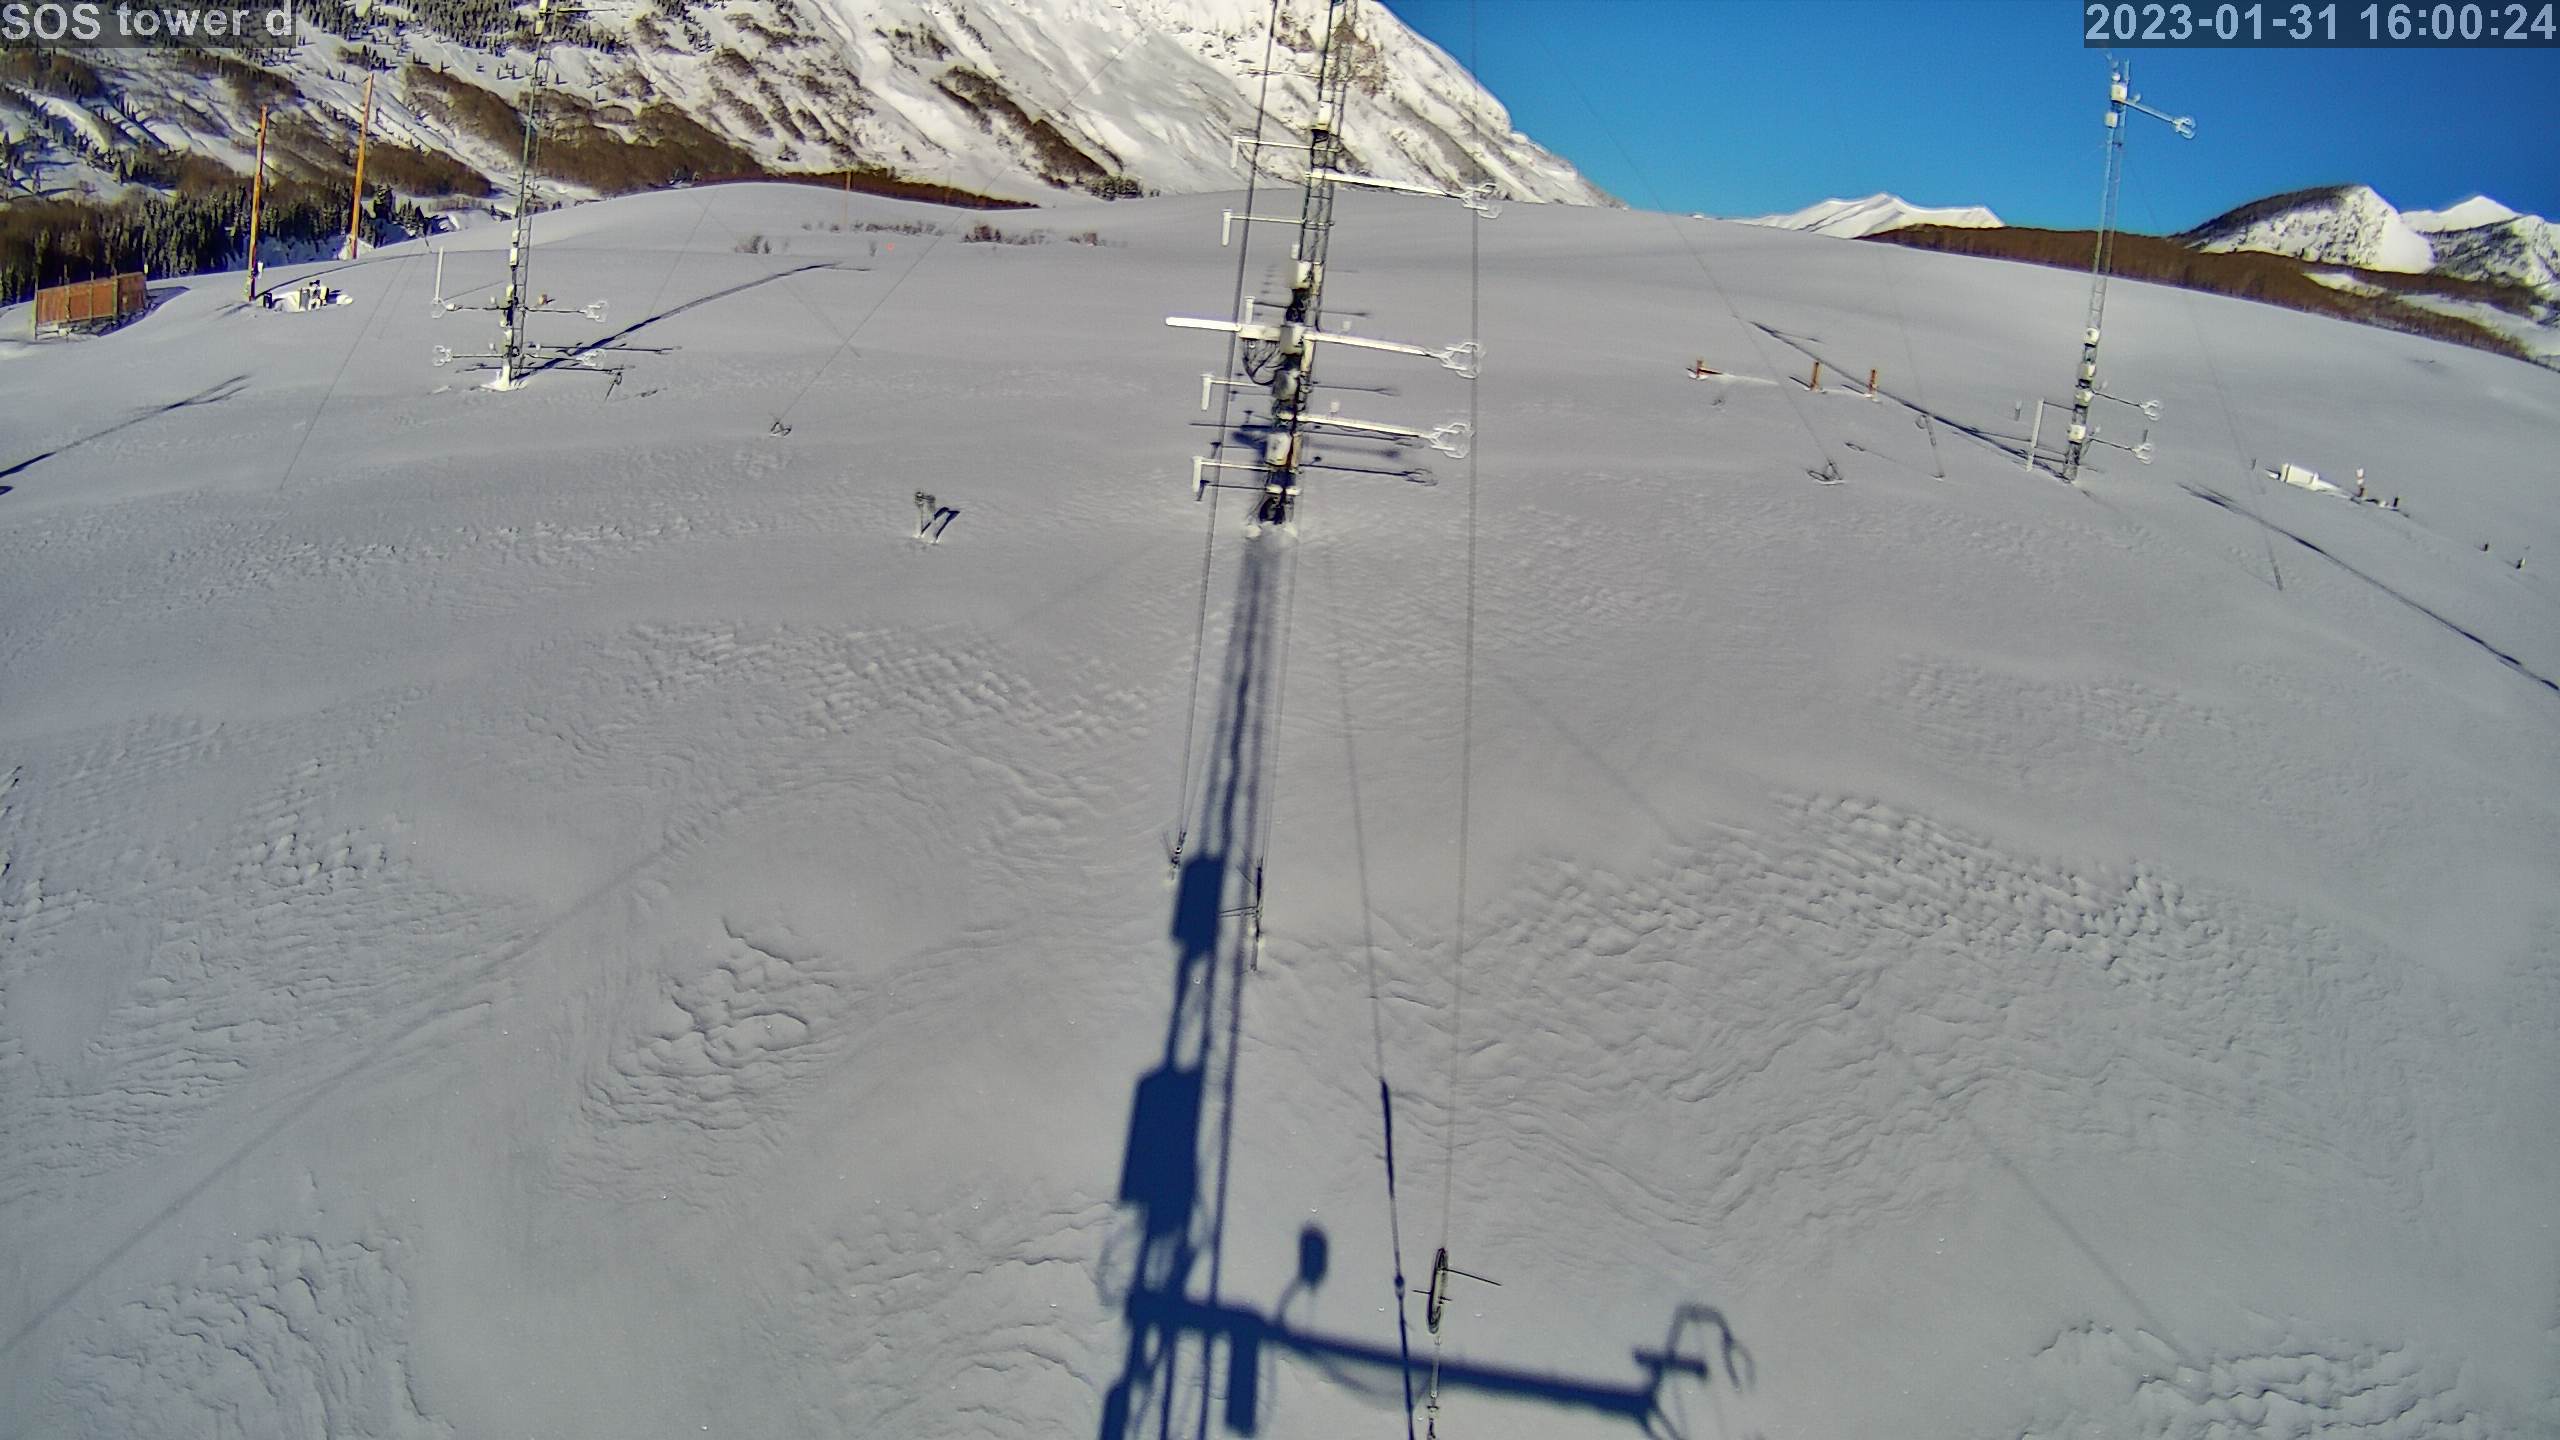
|
photo 2023013117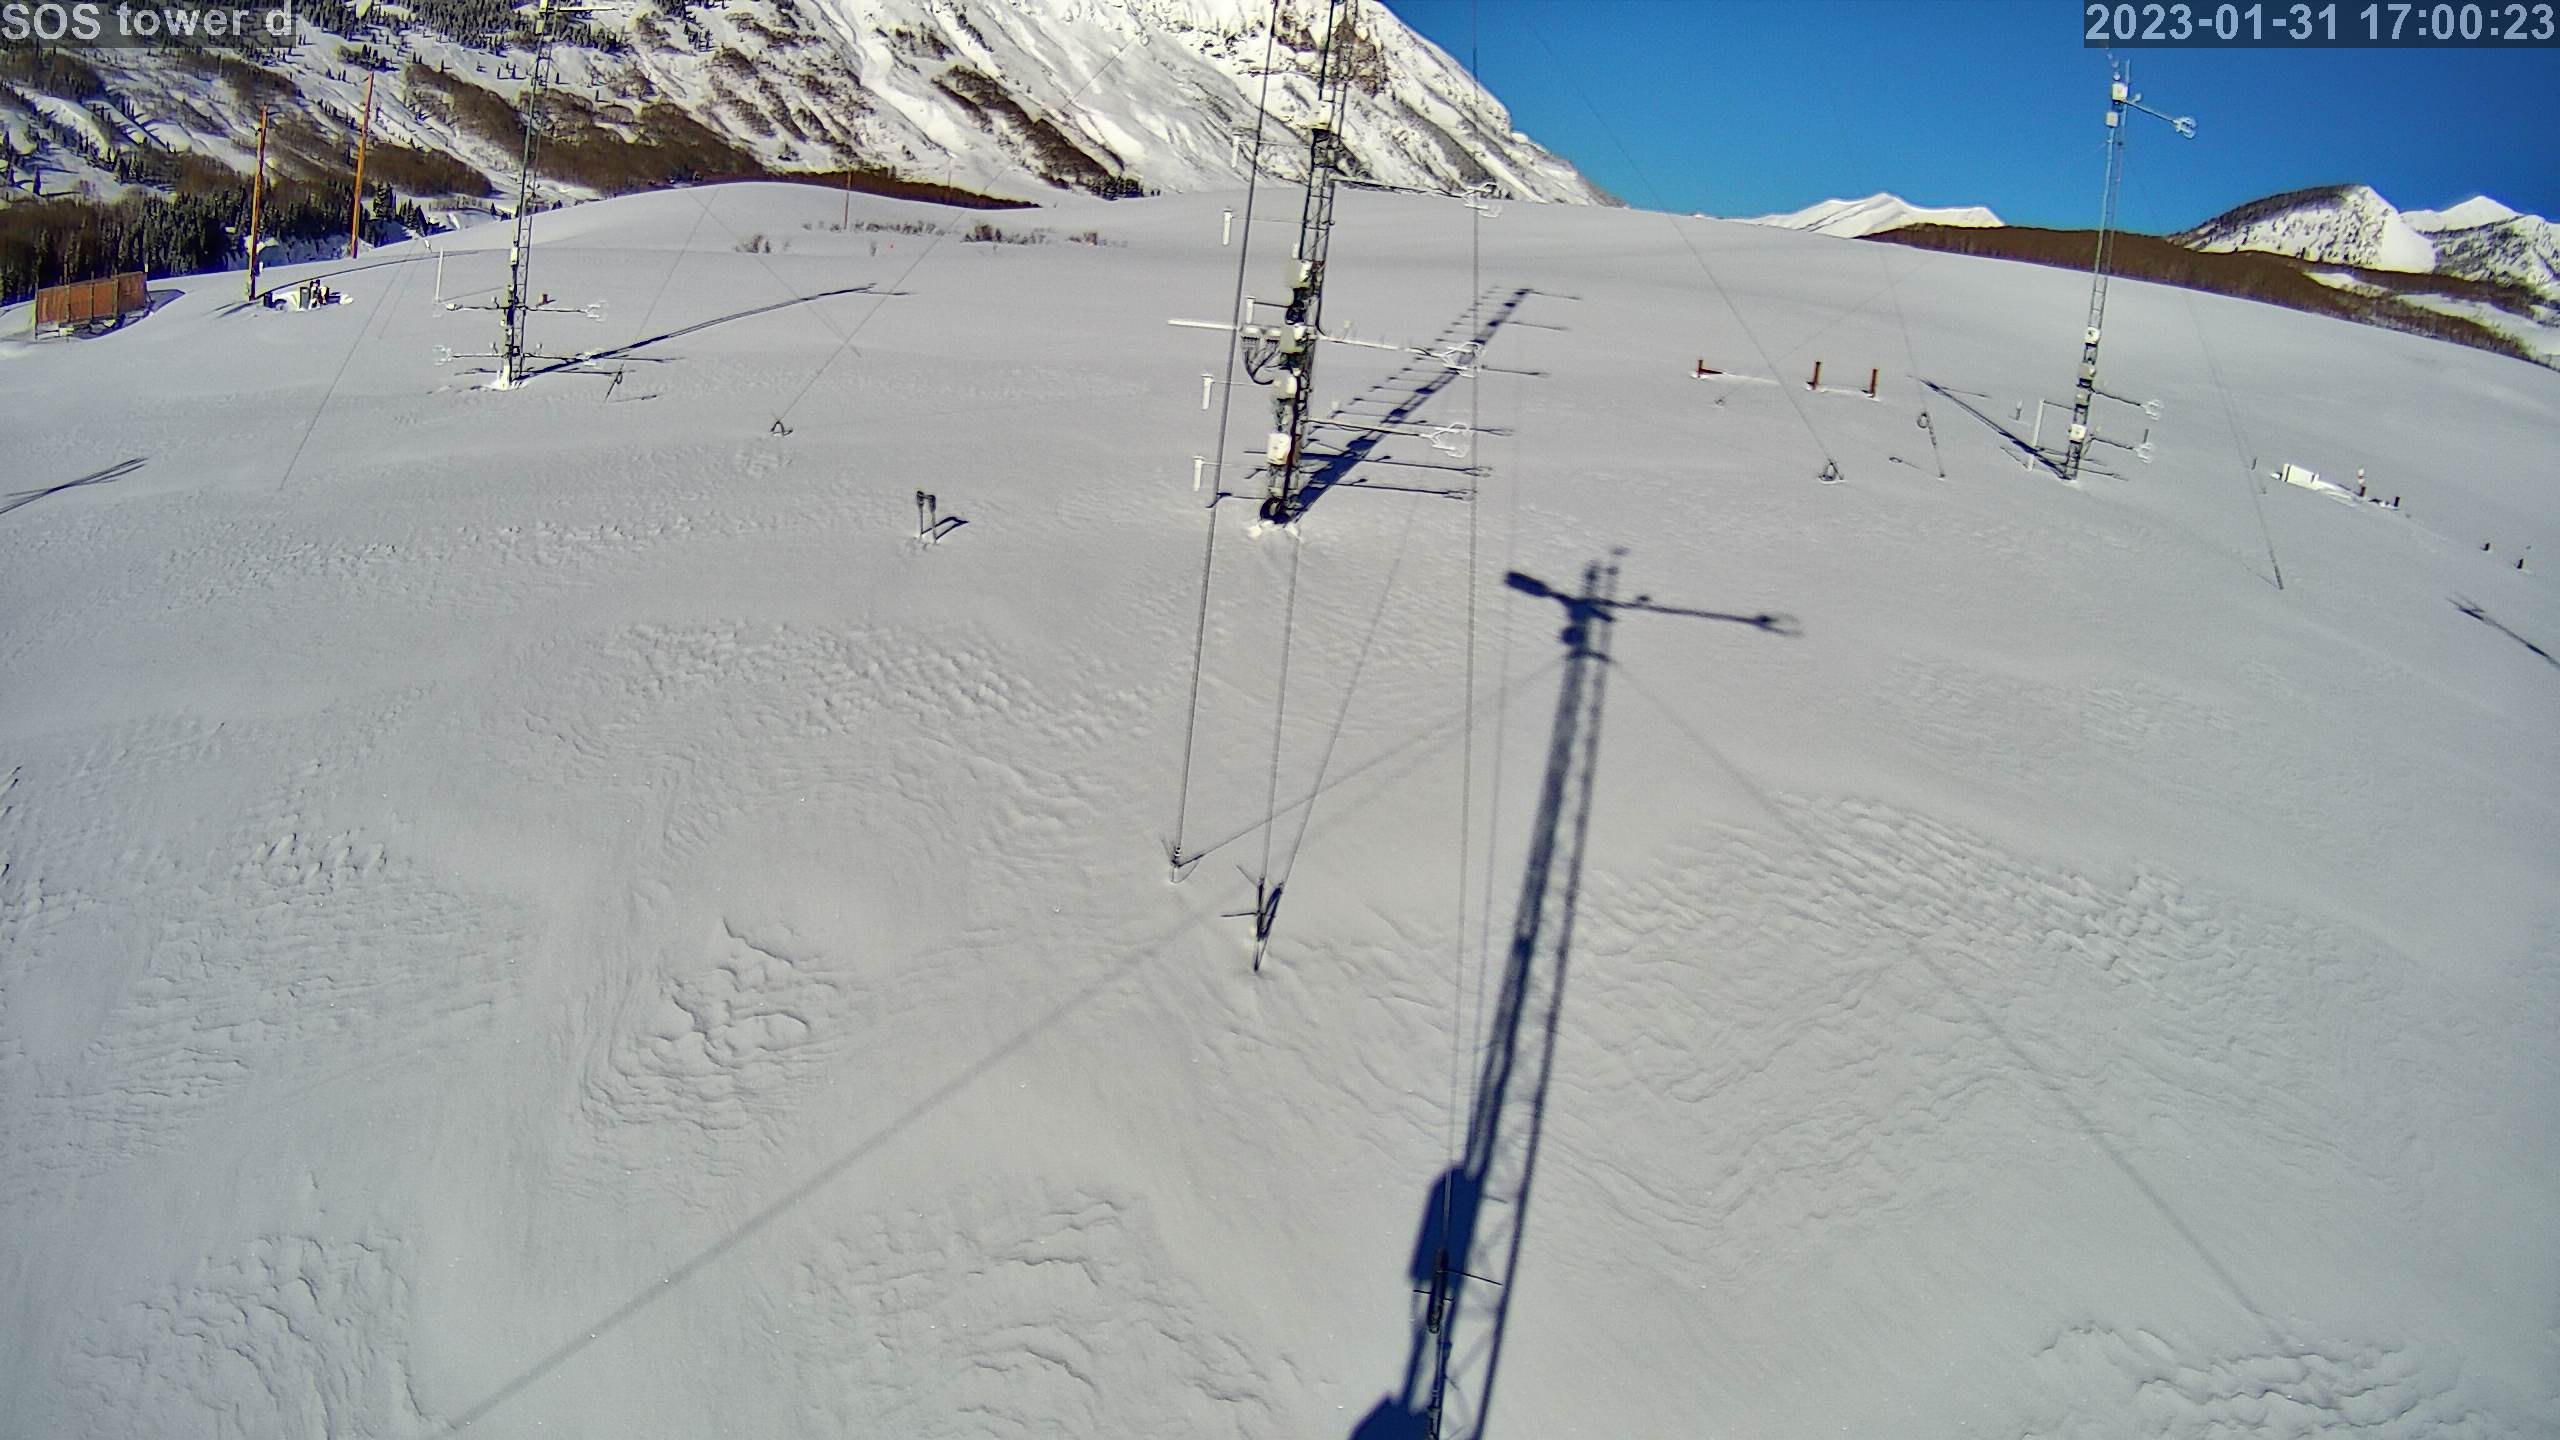
|
photo 2023013118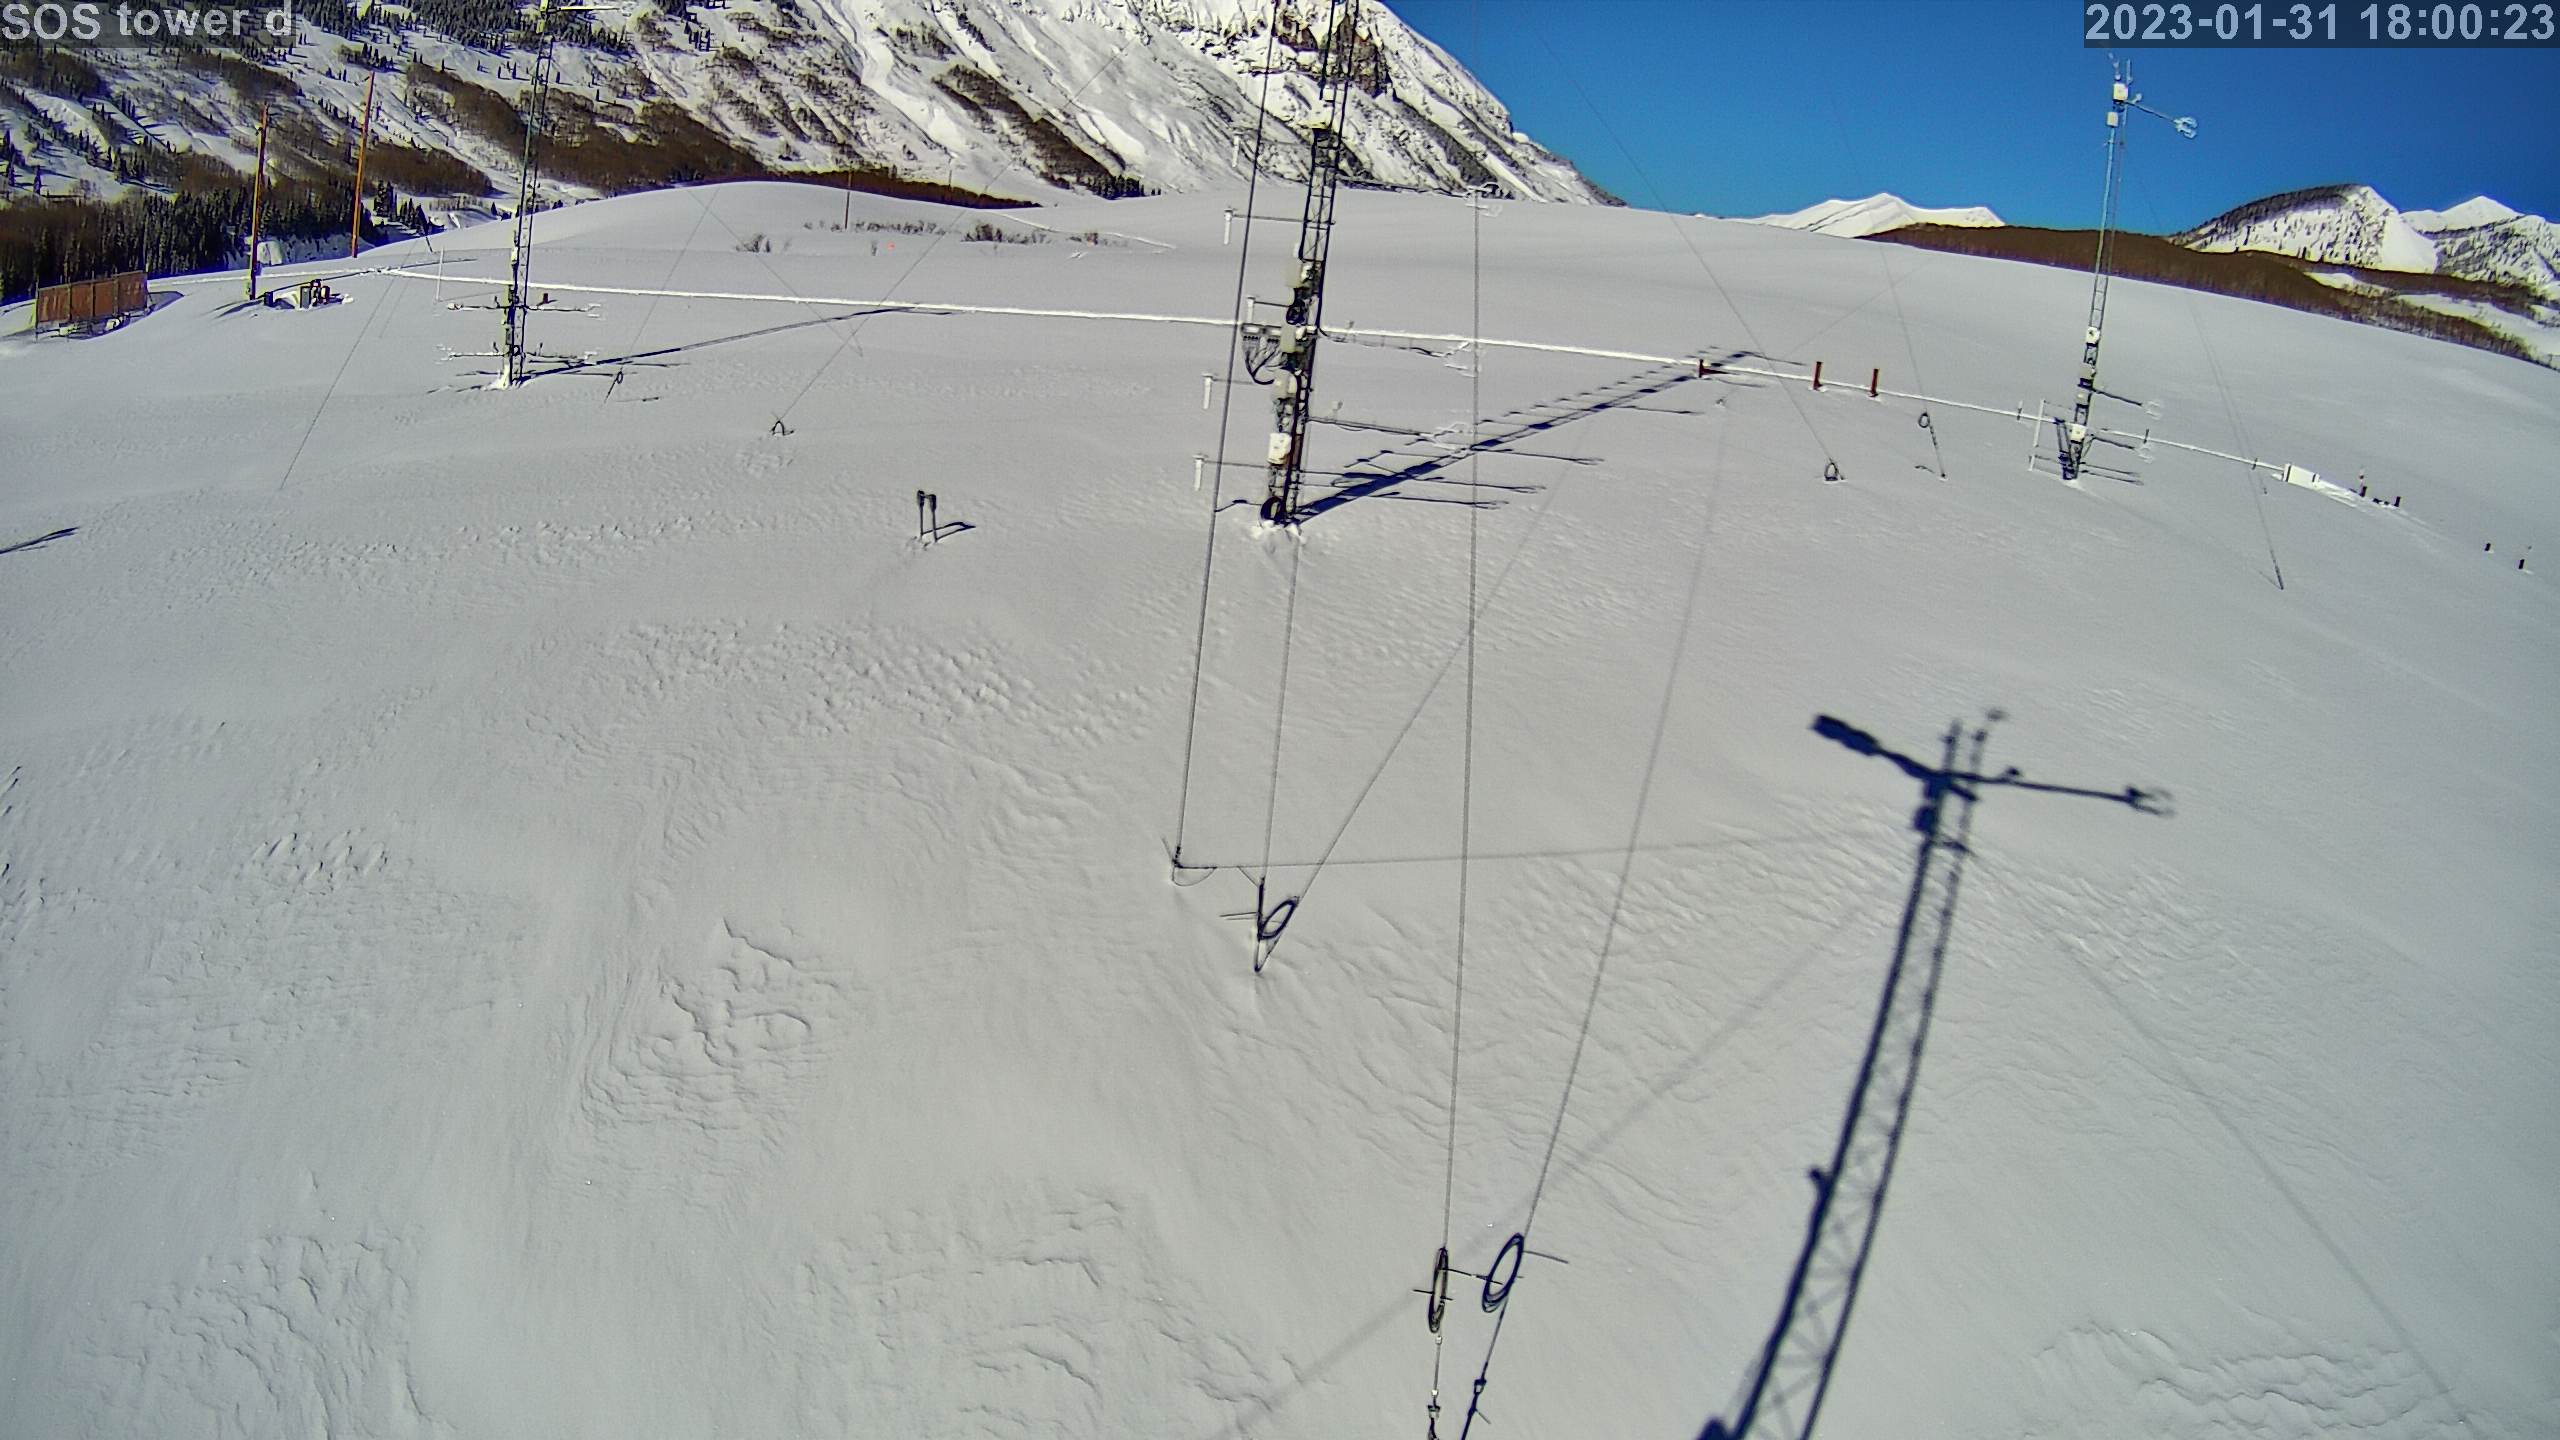
|
photo 2023013119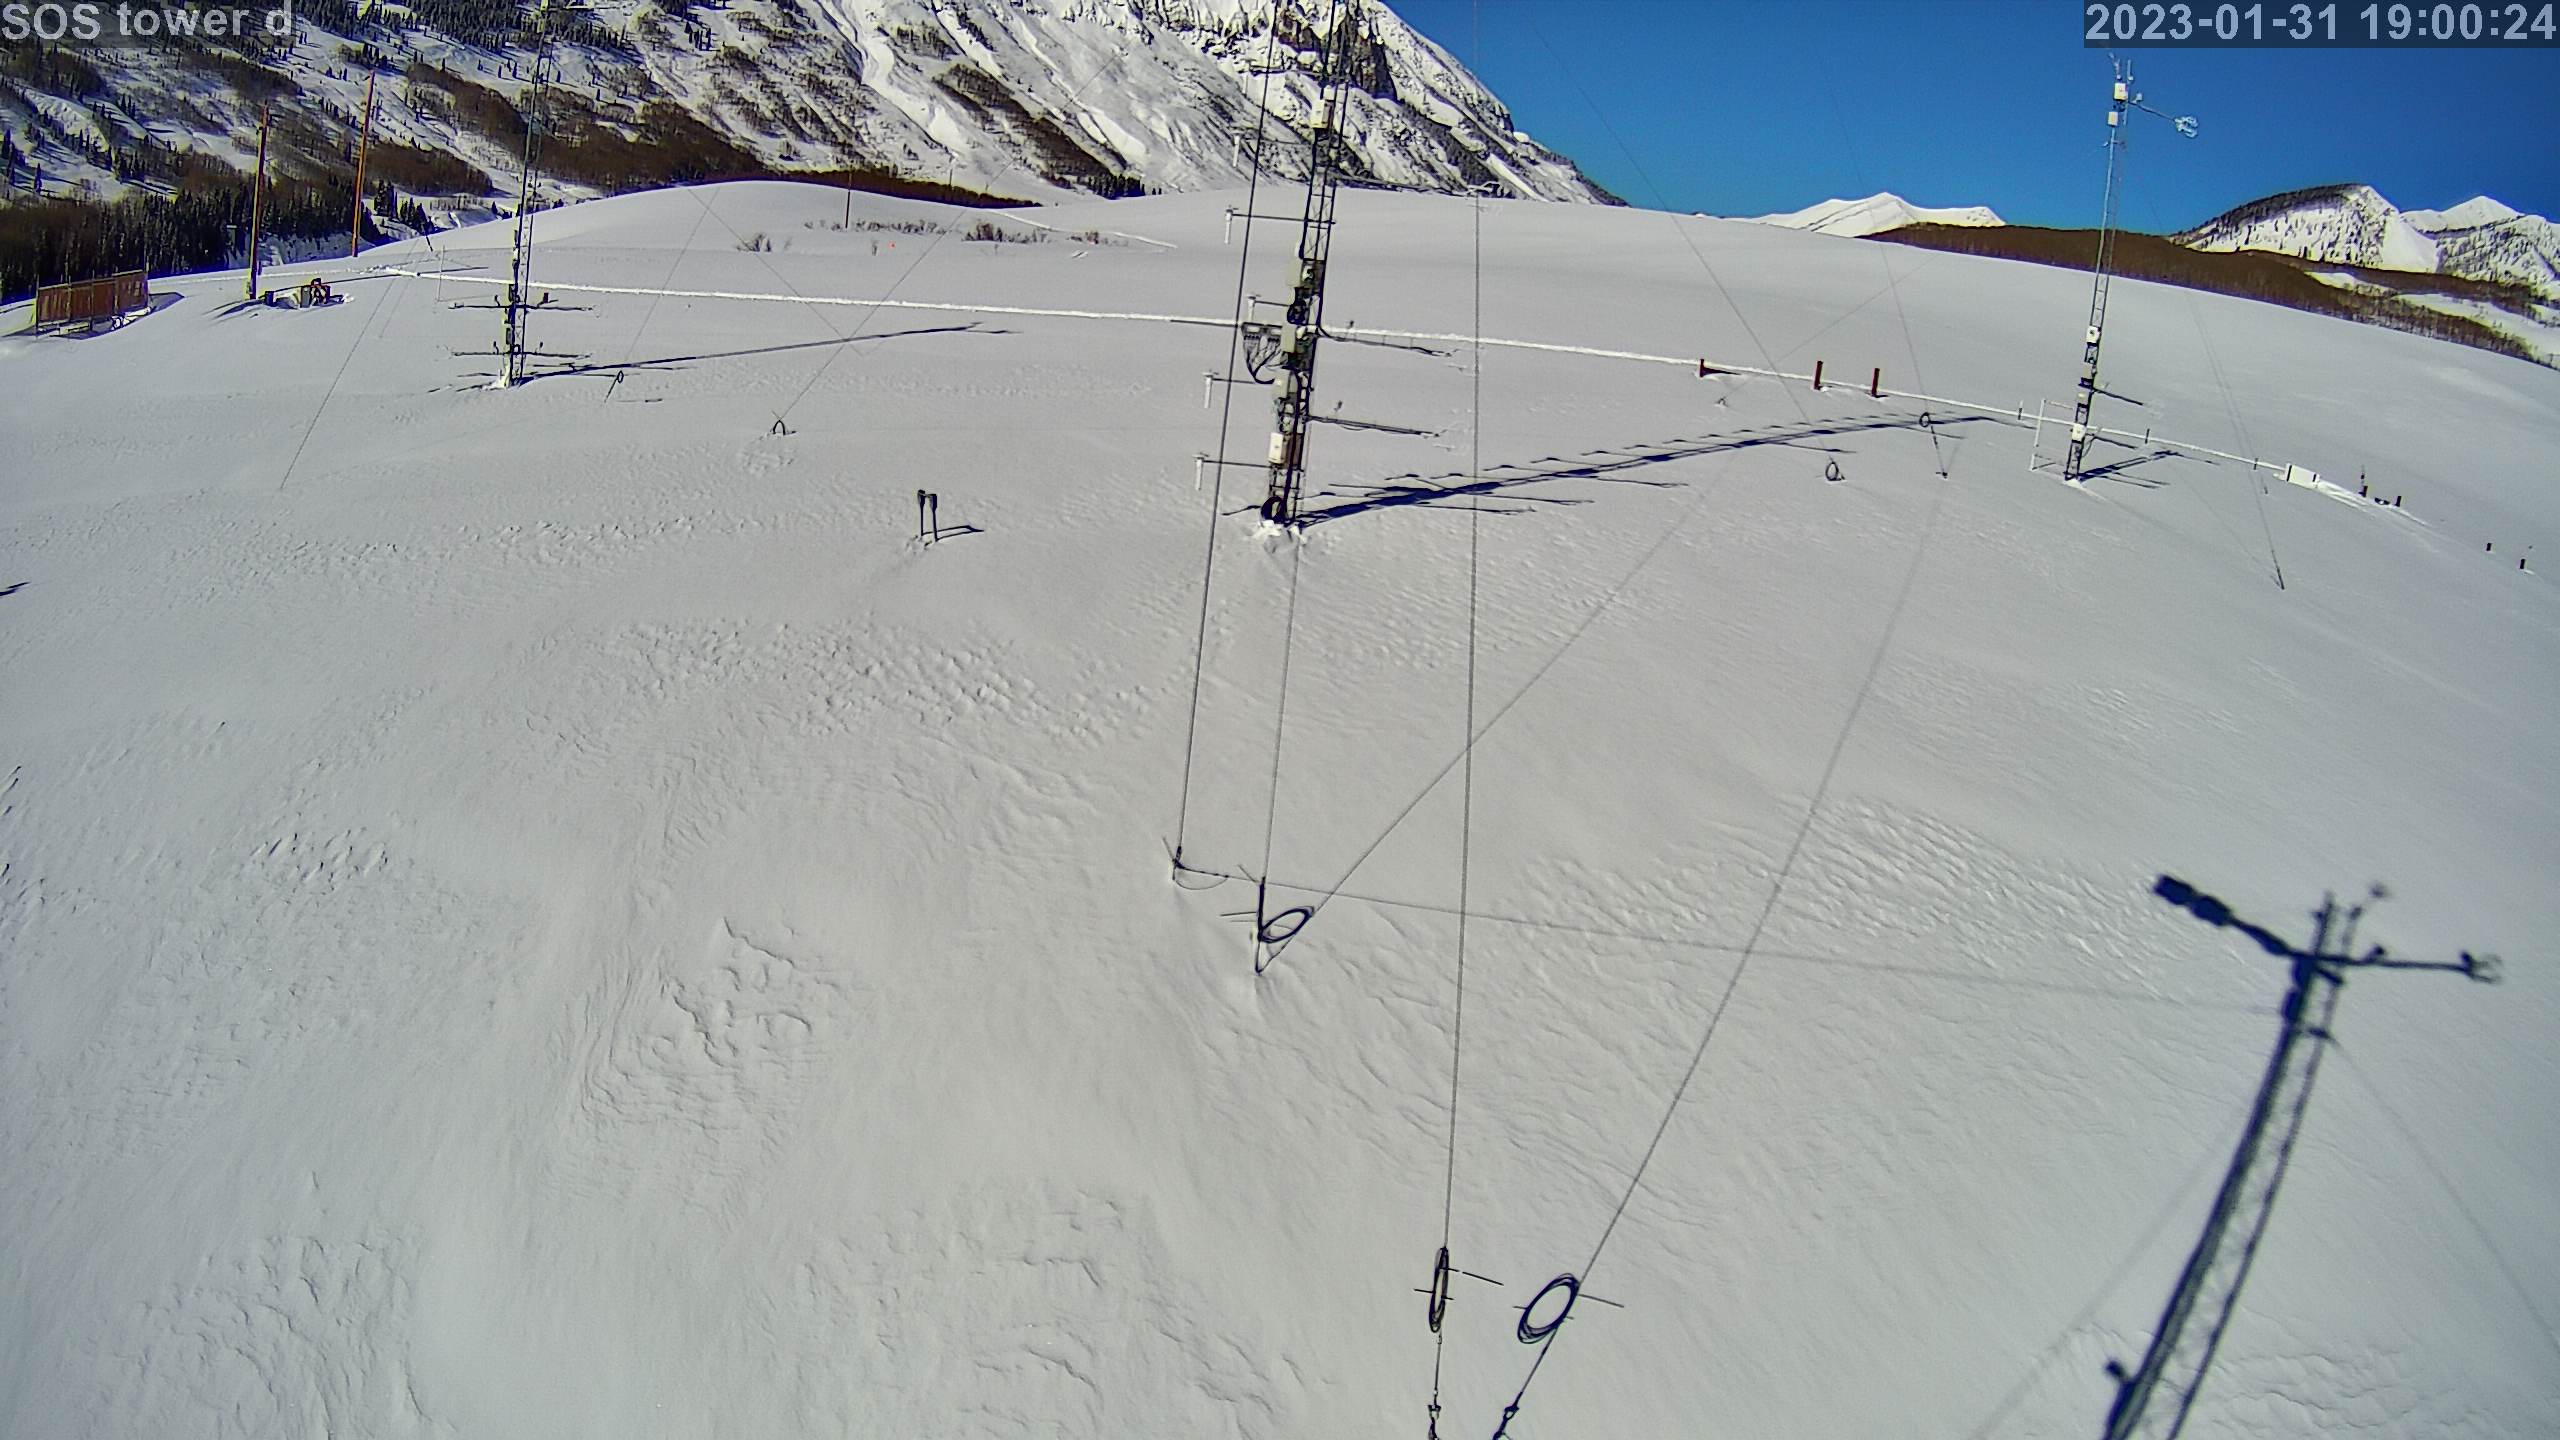
|
photo 2023013120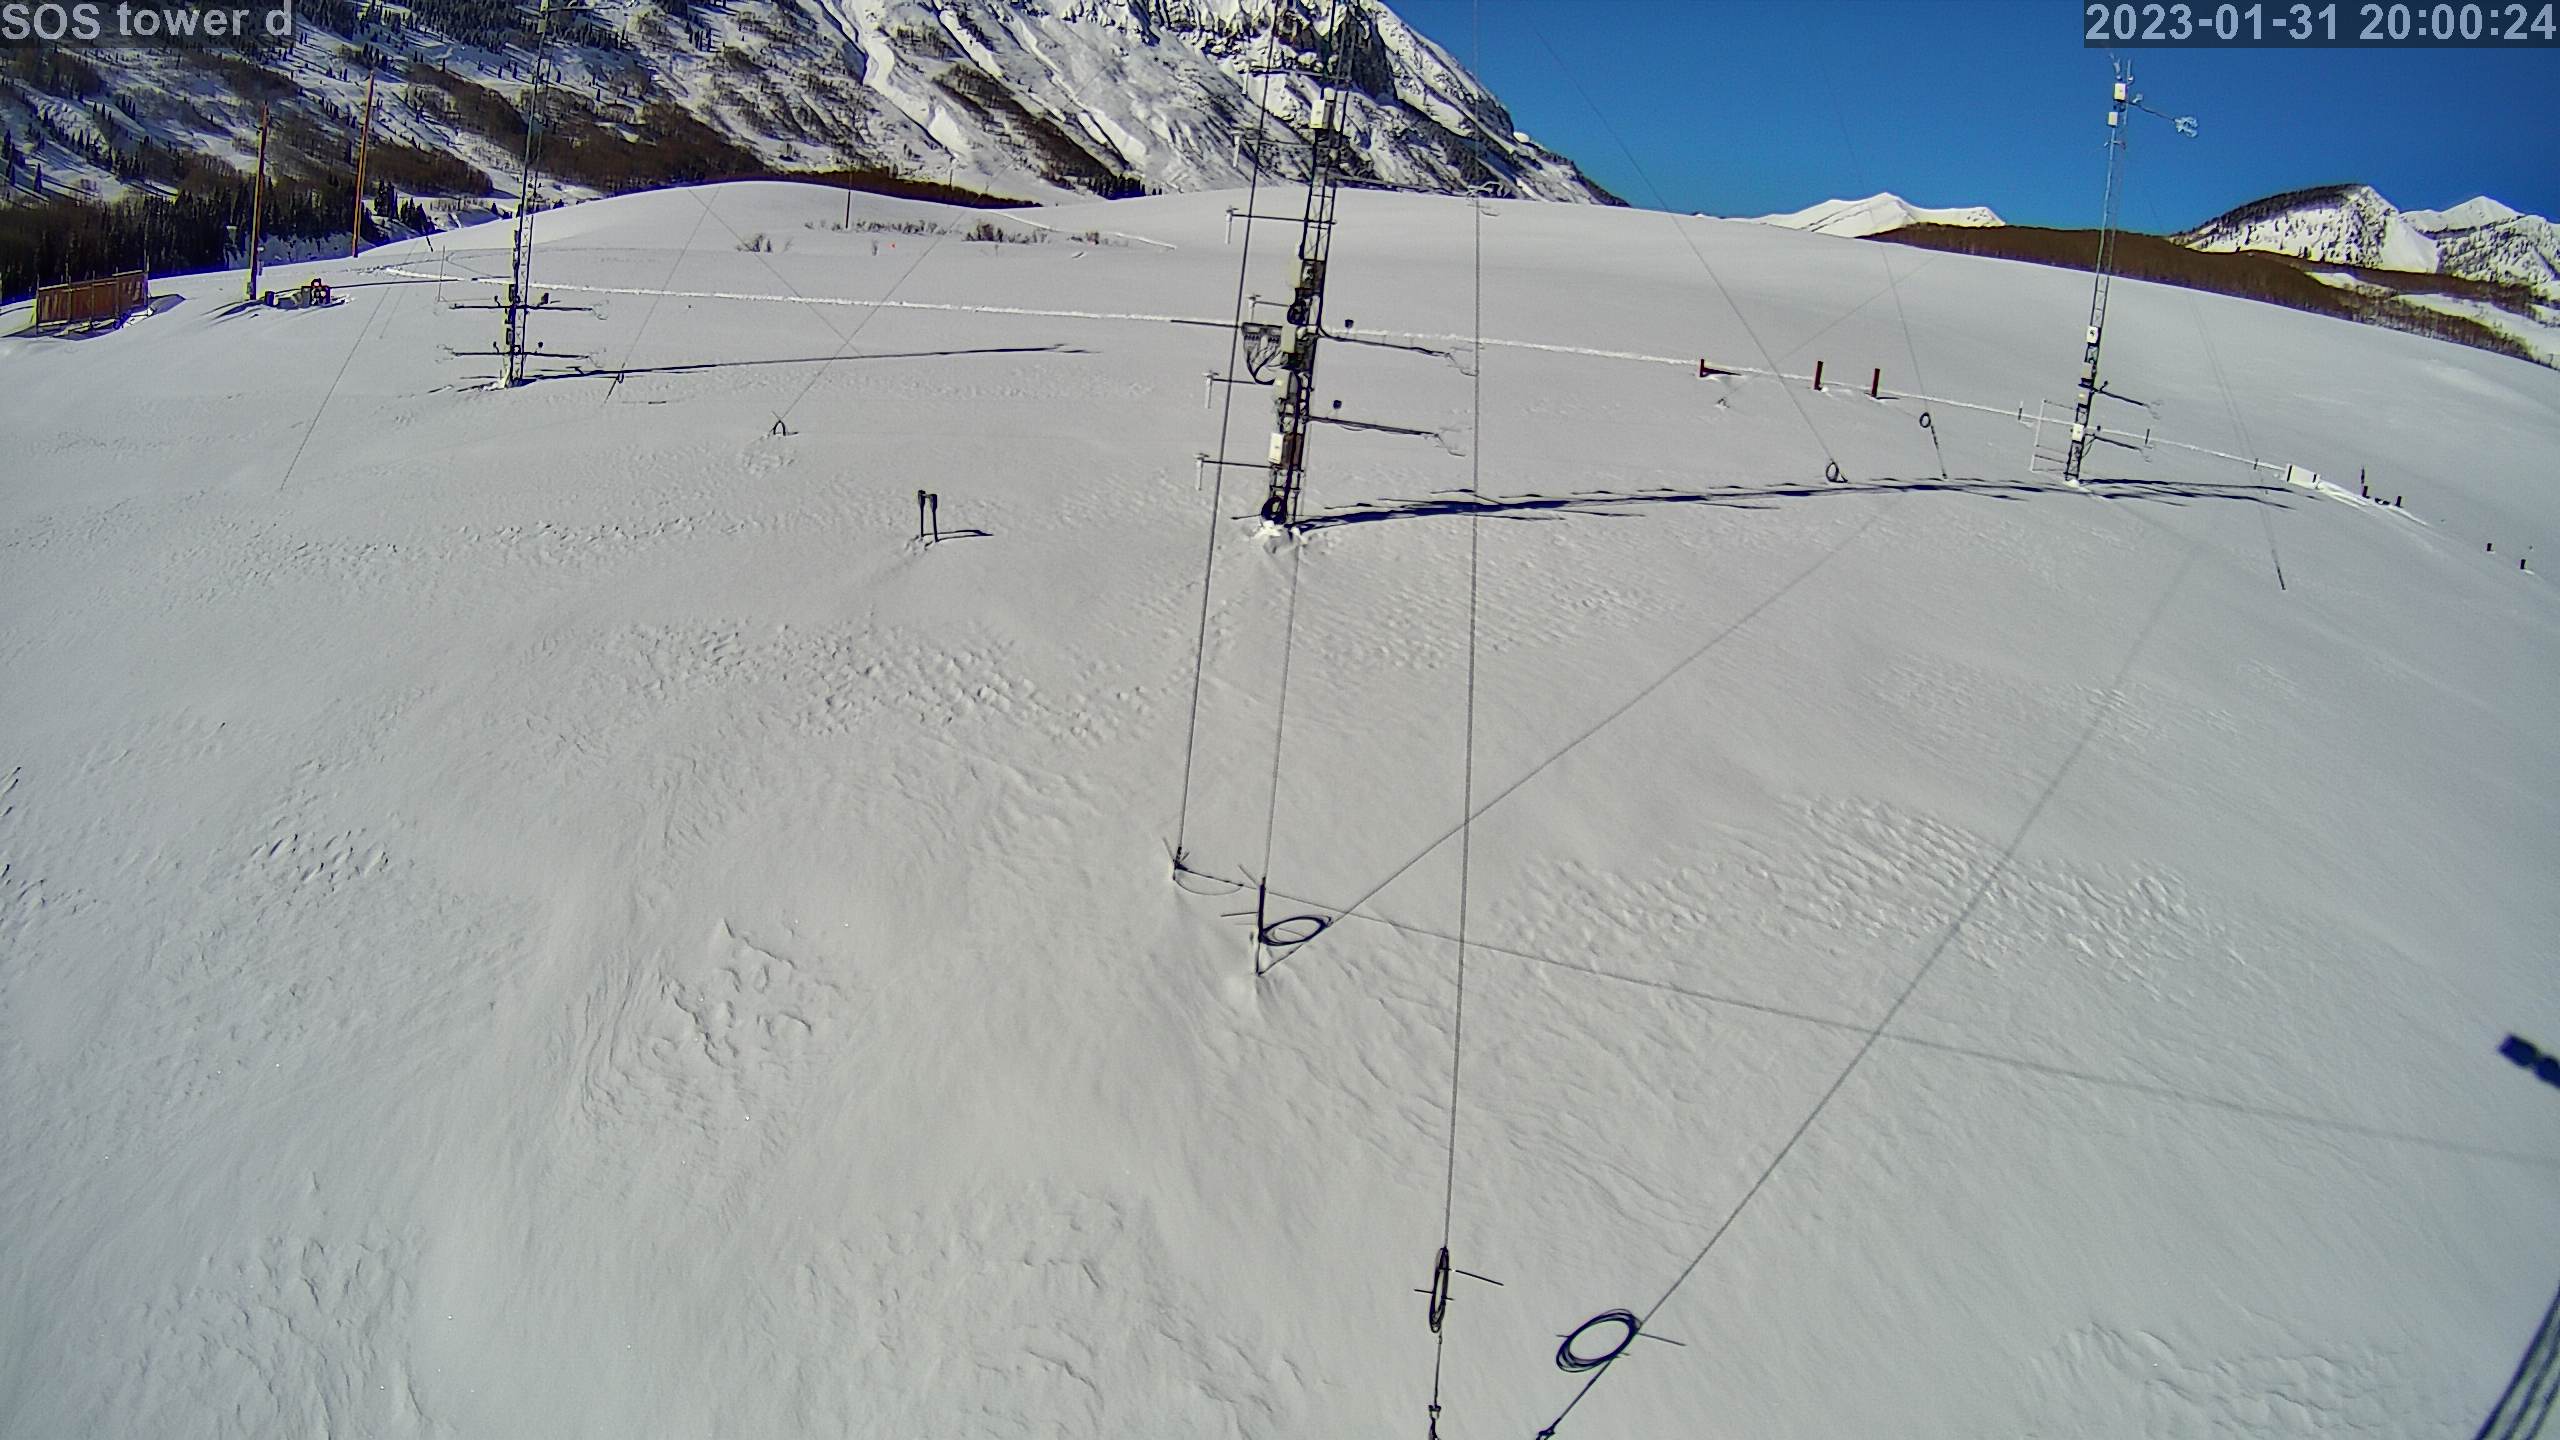
|
photo 2023013121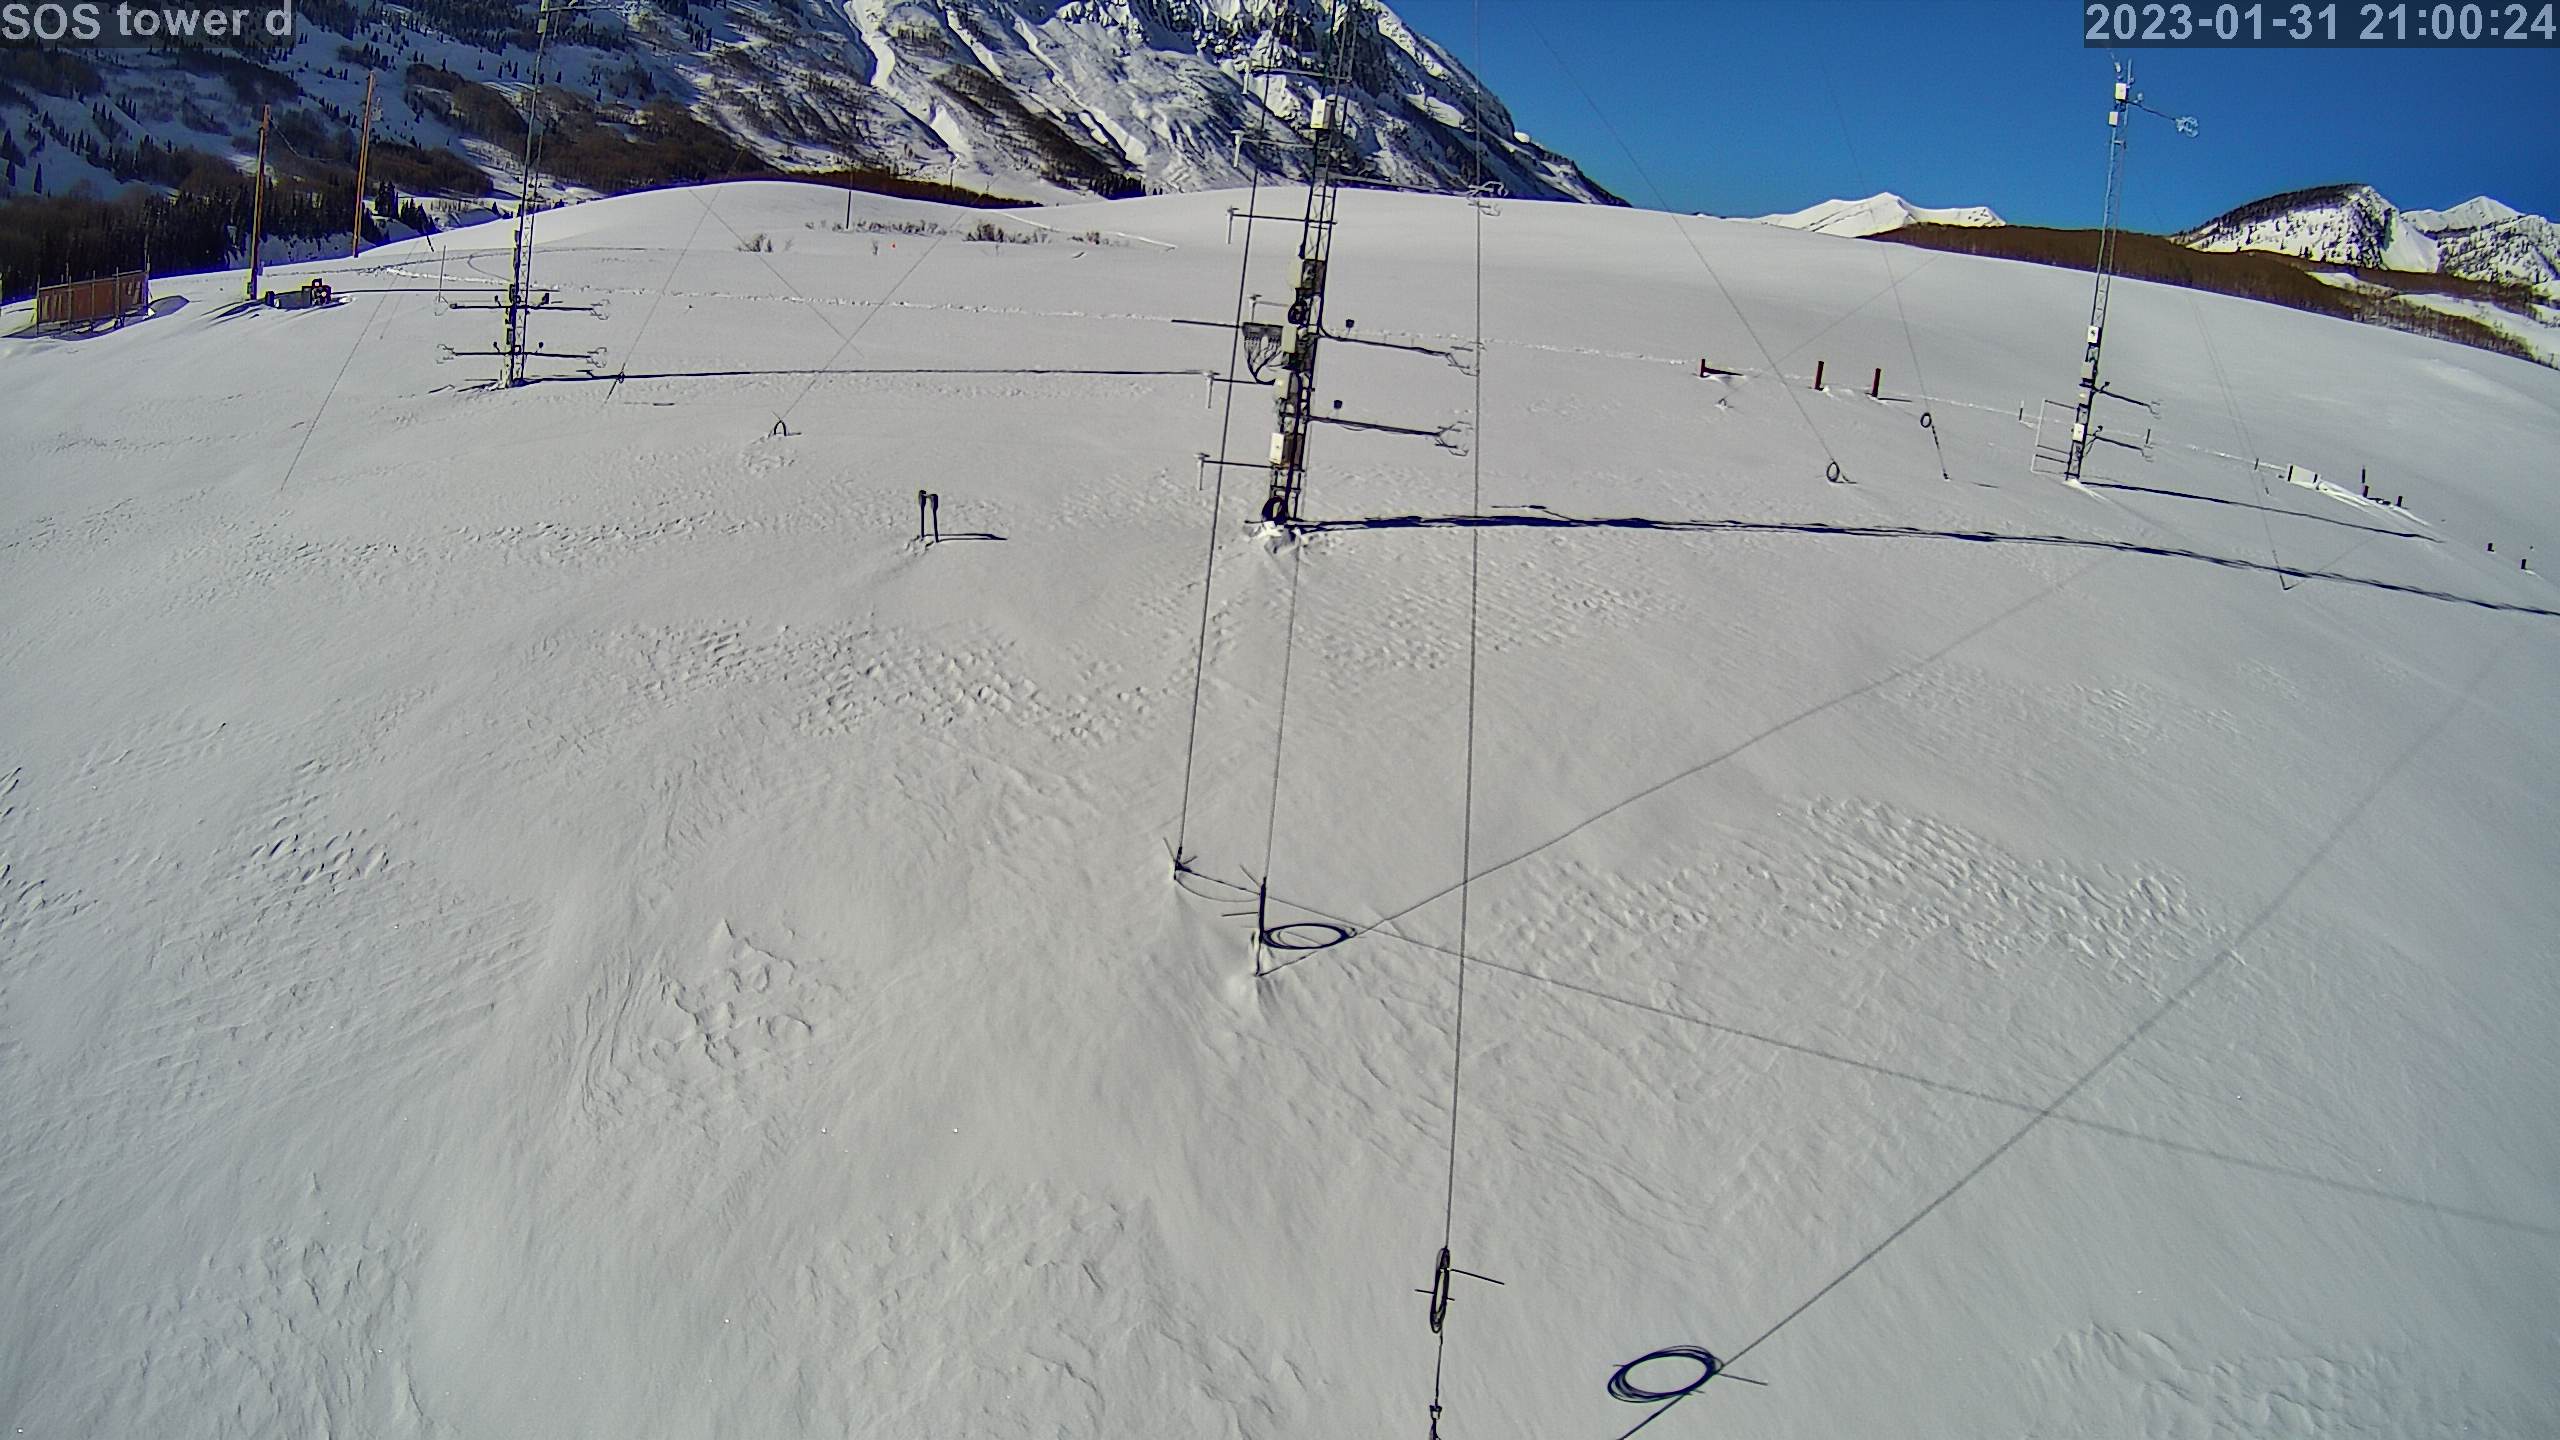
|
photo 2023013122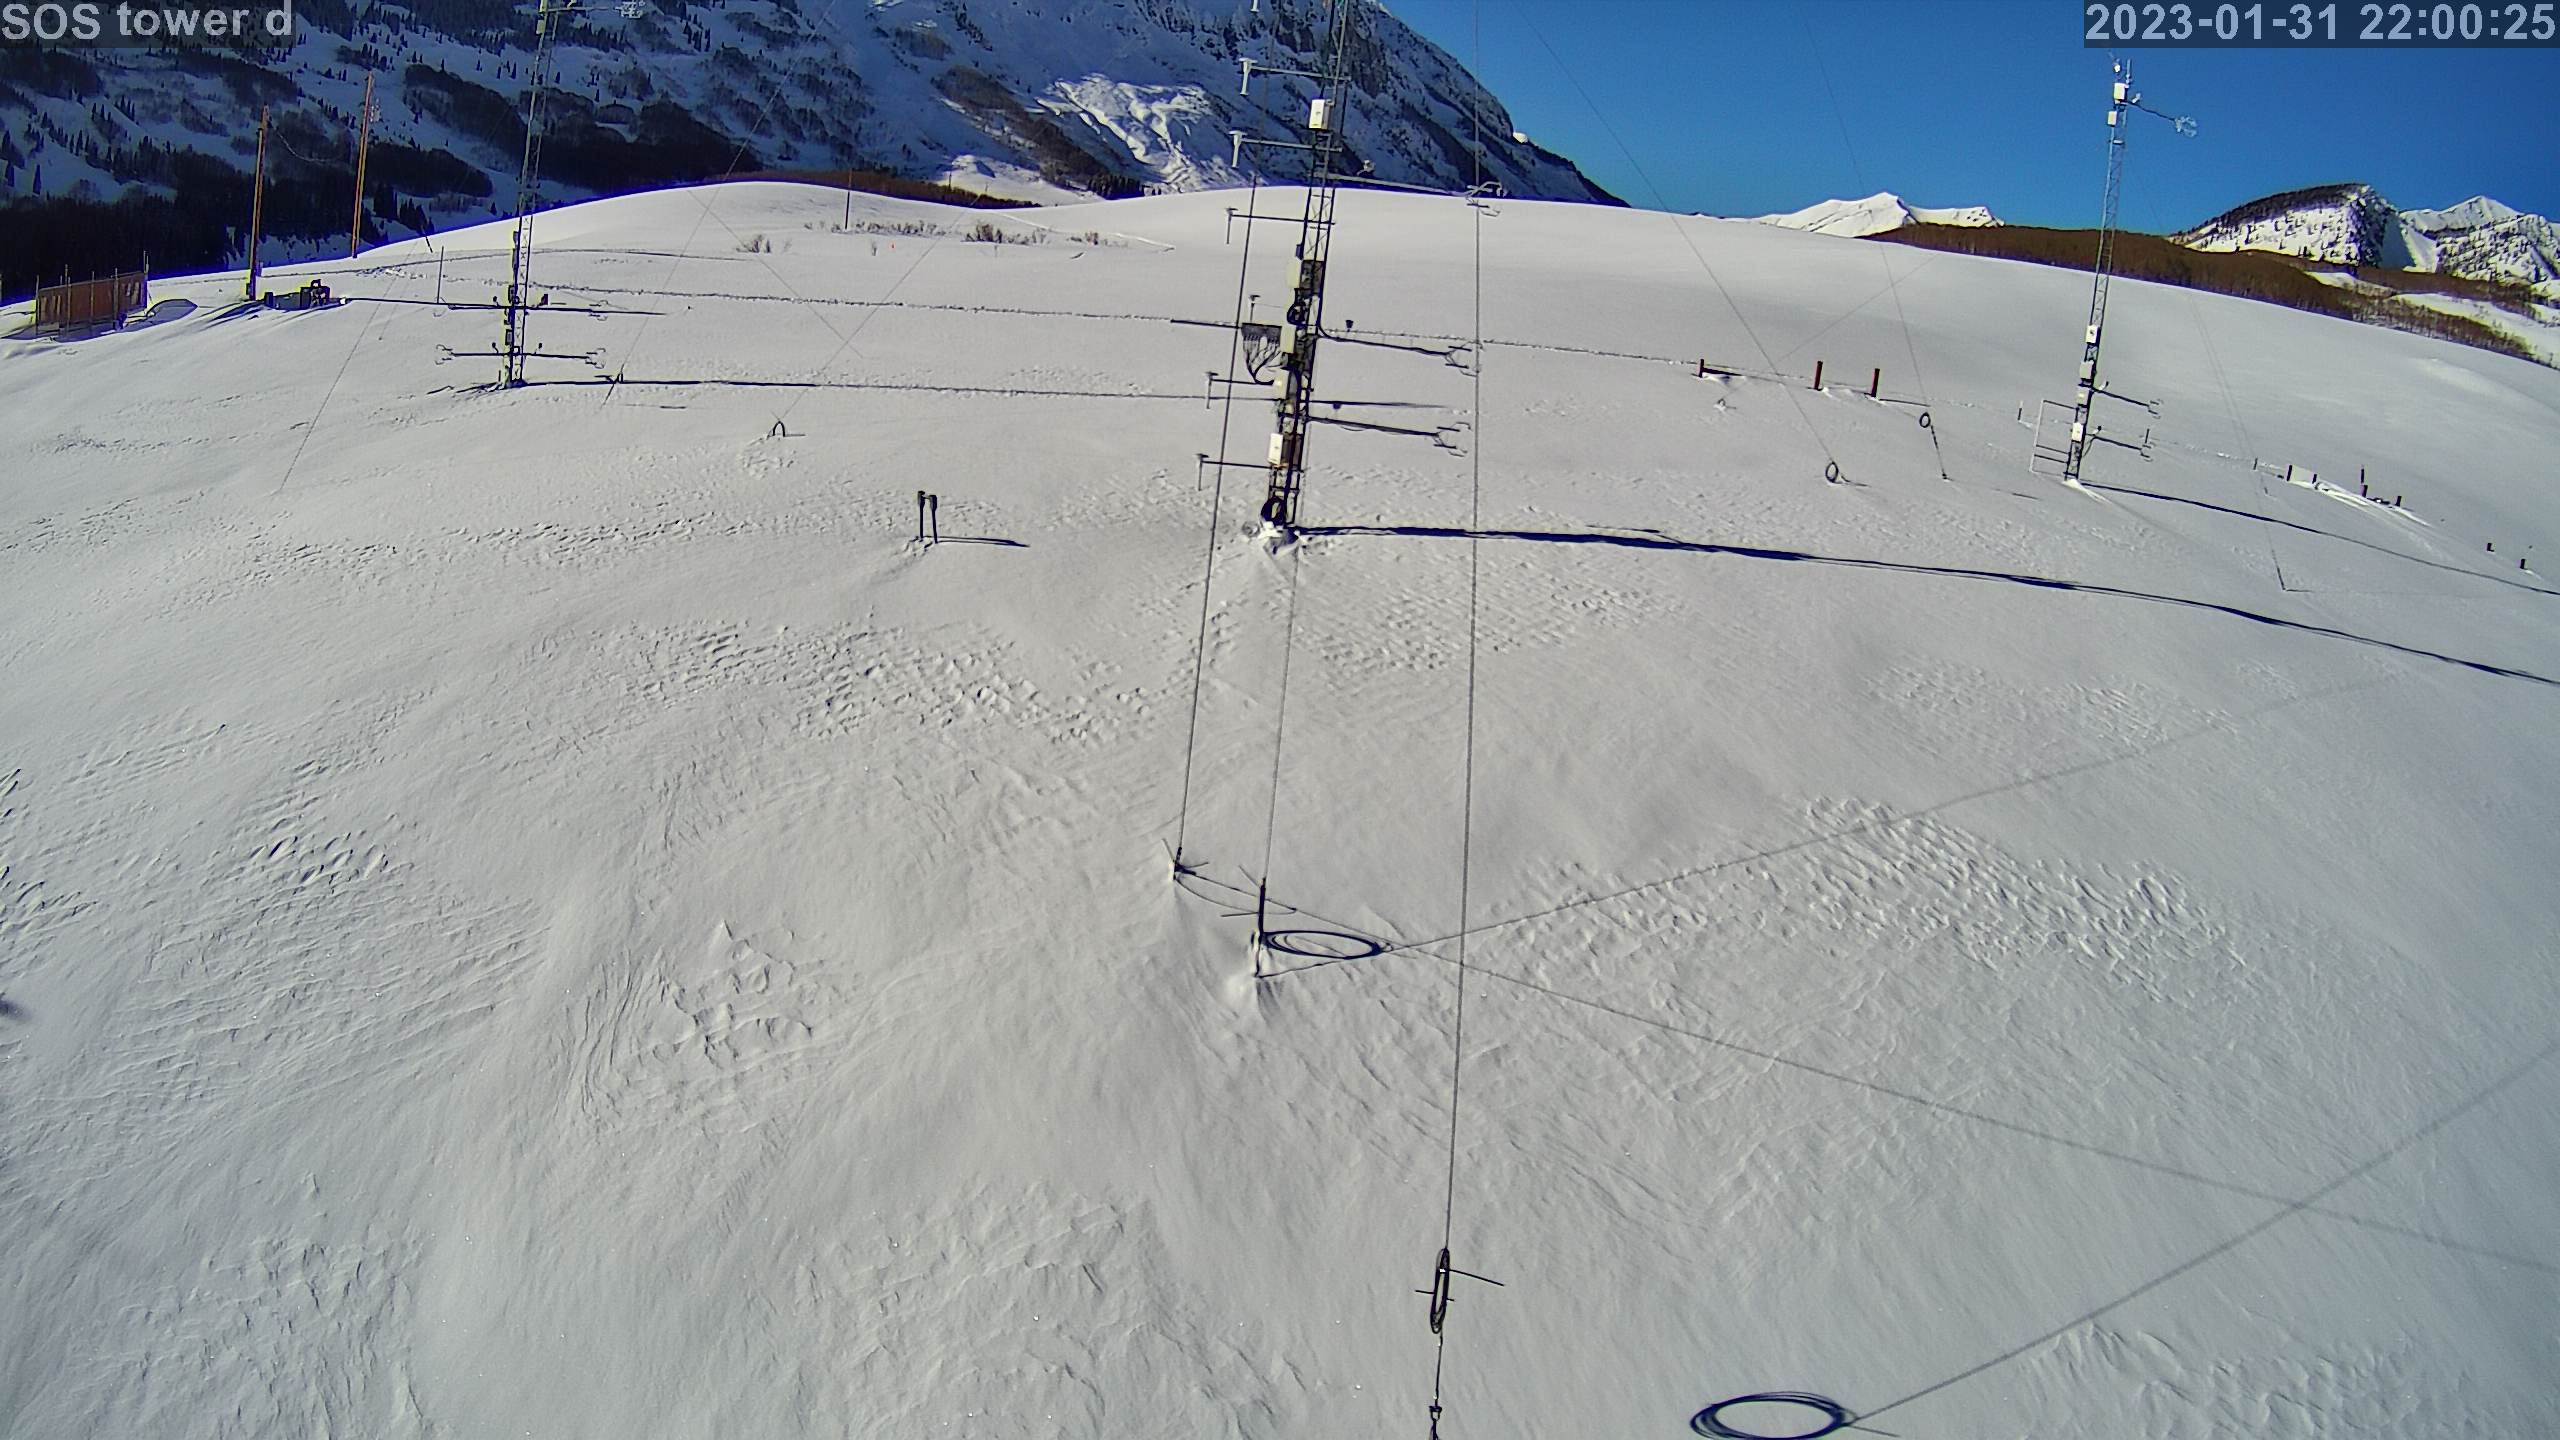
|
photo 2023013123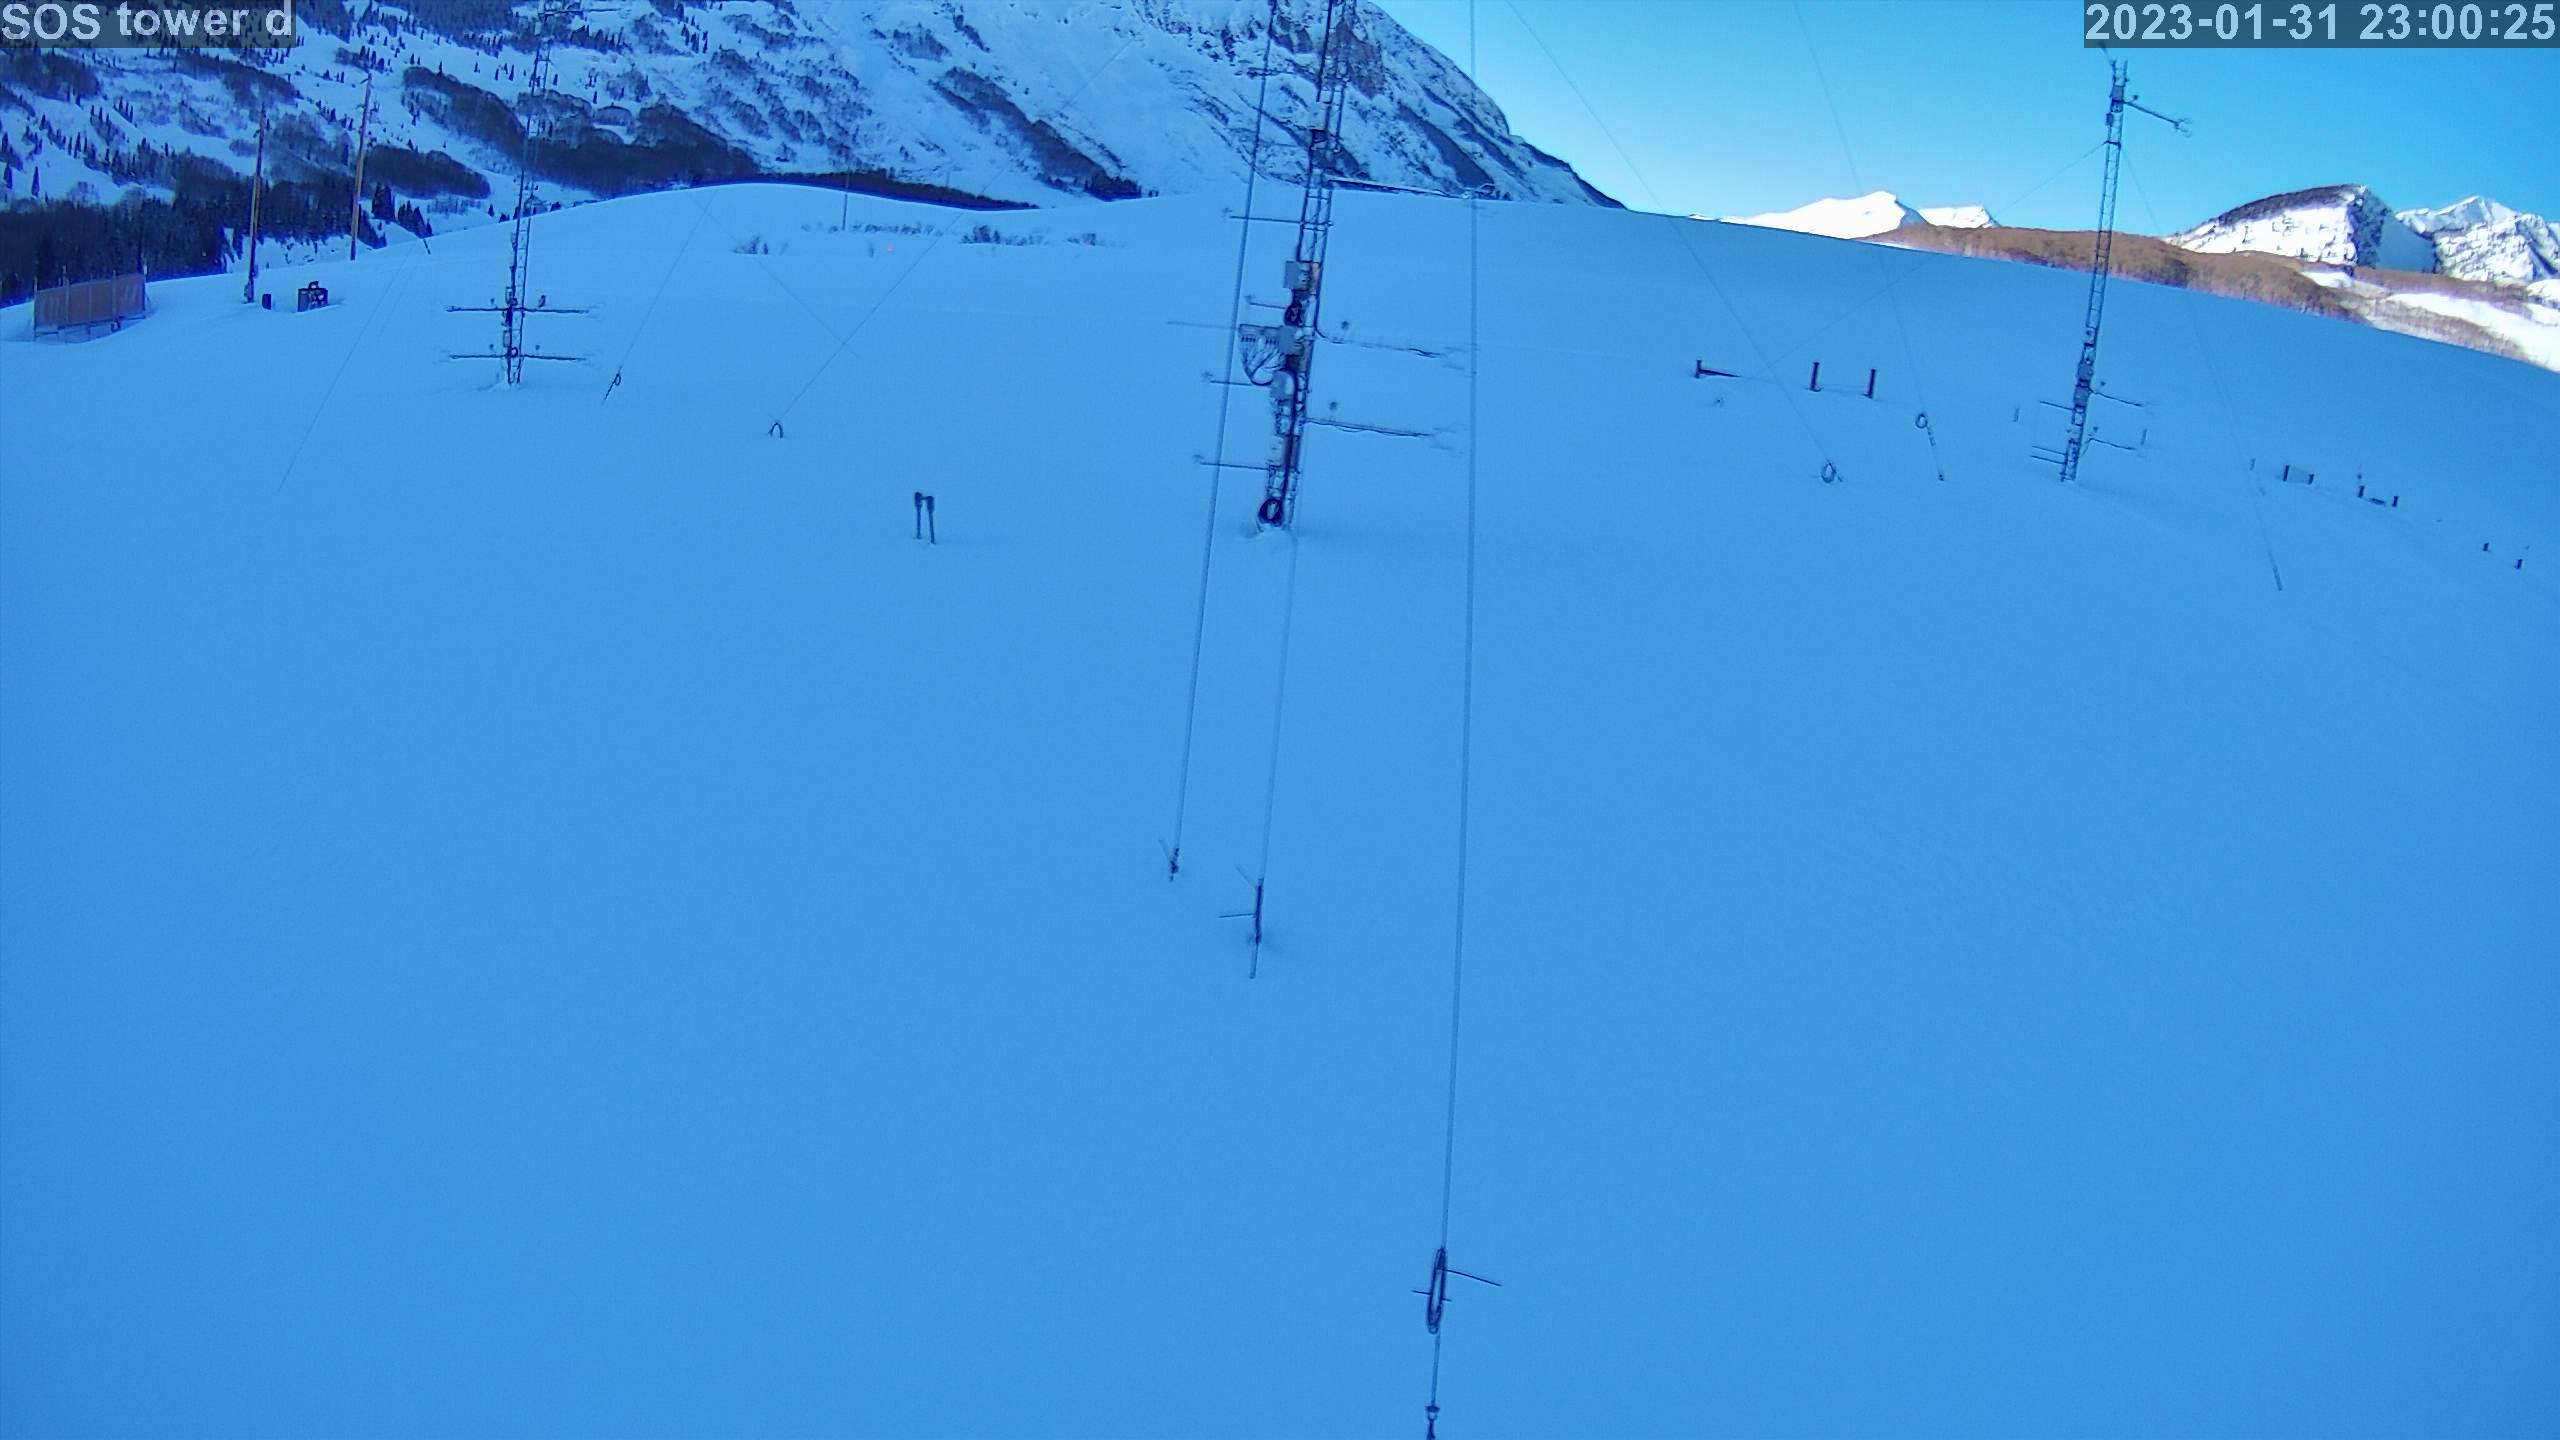
|