| Previous day | Select day | Next day |
The most recent plots are generally updated every 15 minutes. Use the browser reload button to make sure you are seeing the latest version of a plot.
In order to distinquish the traces on the vertical profile plots, a slight offset in X is added to some traces. This is indicated by a "(n)" in the legend for the trace.
If you right-click on an image, most browsers will provide a menu to download or display the plot in another window.
photo 20230125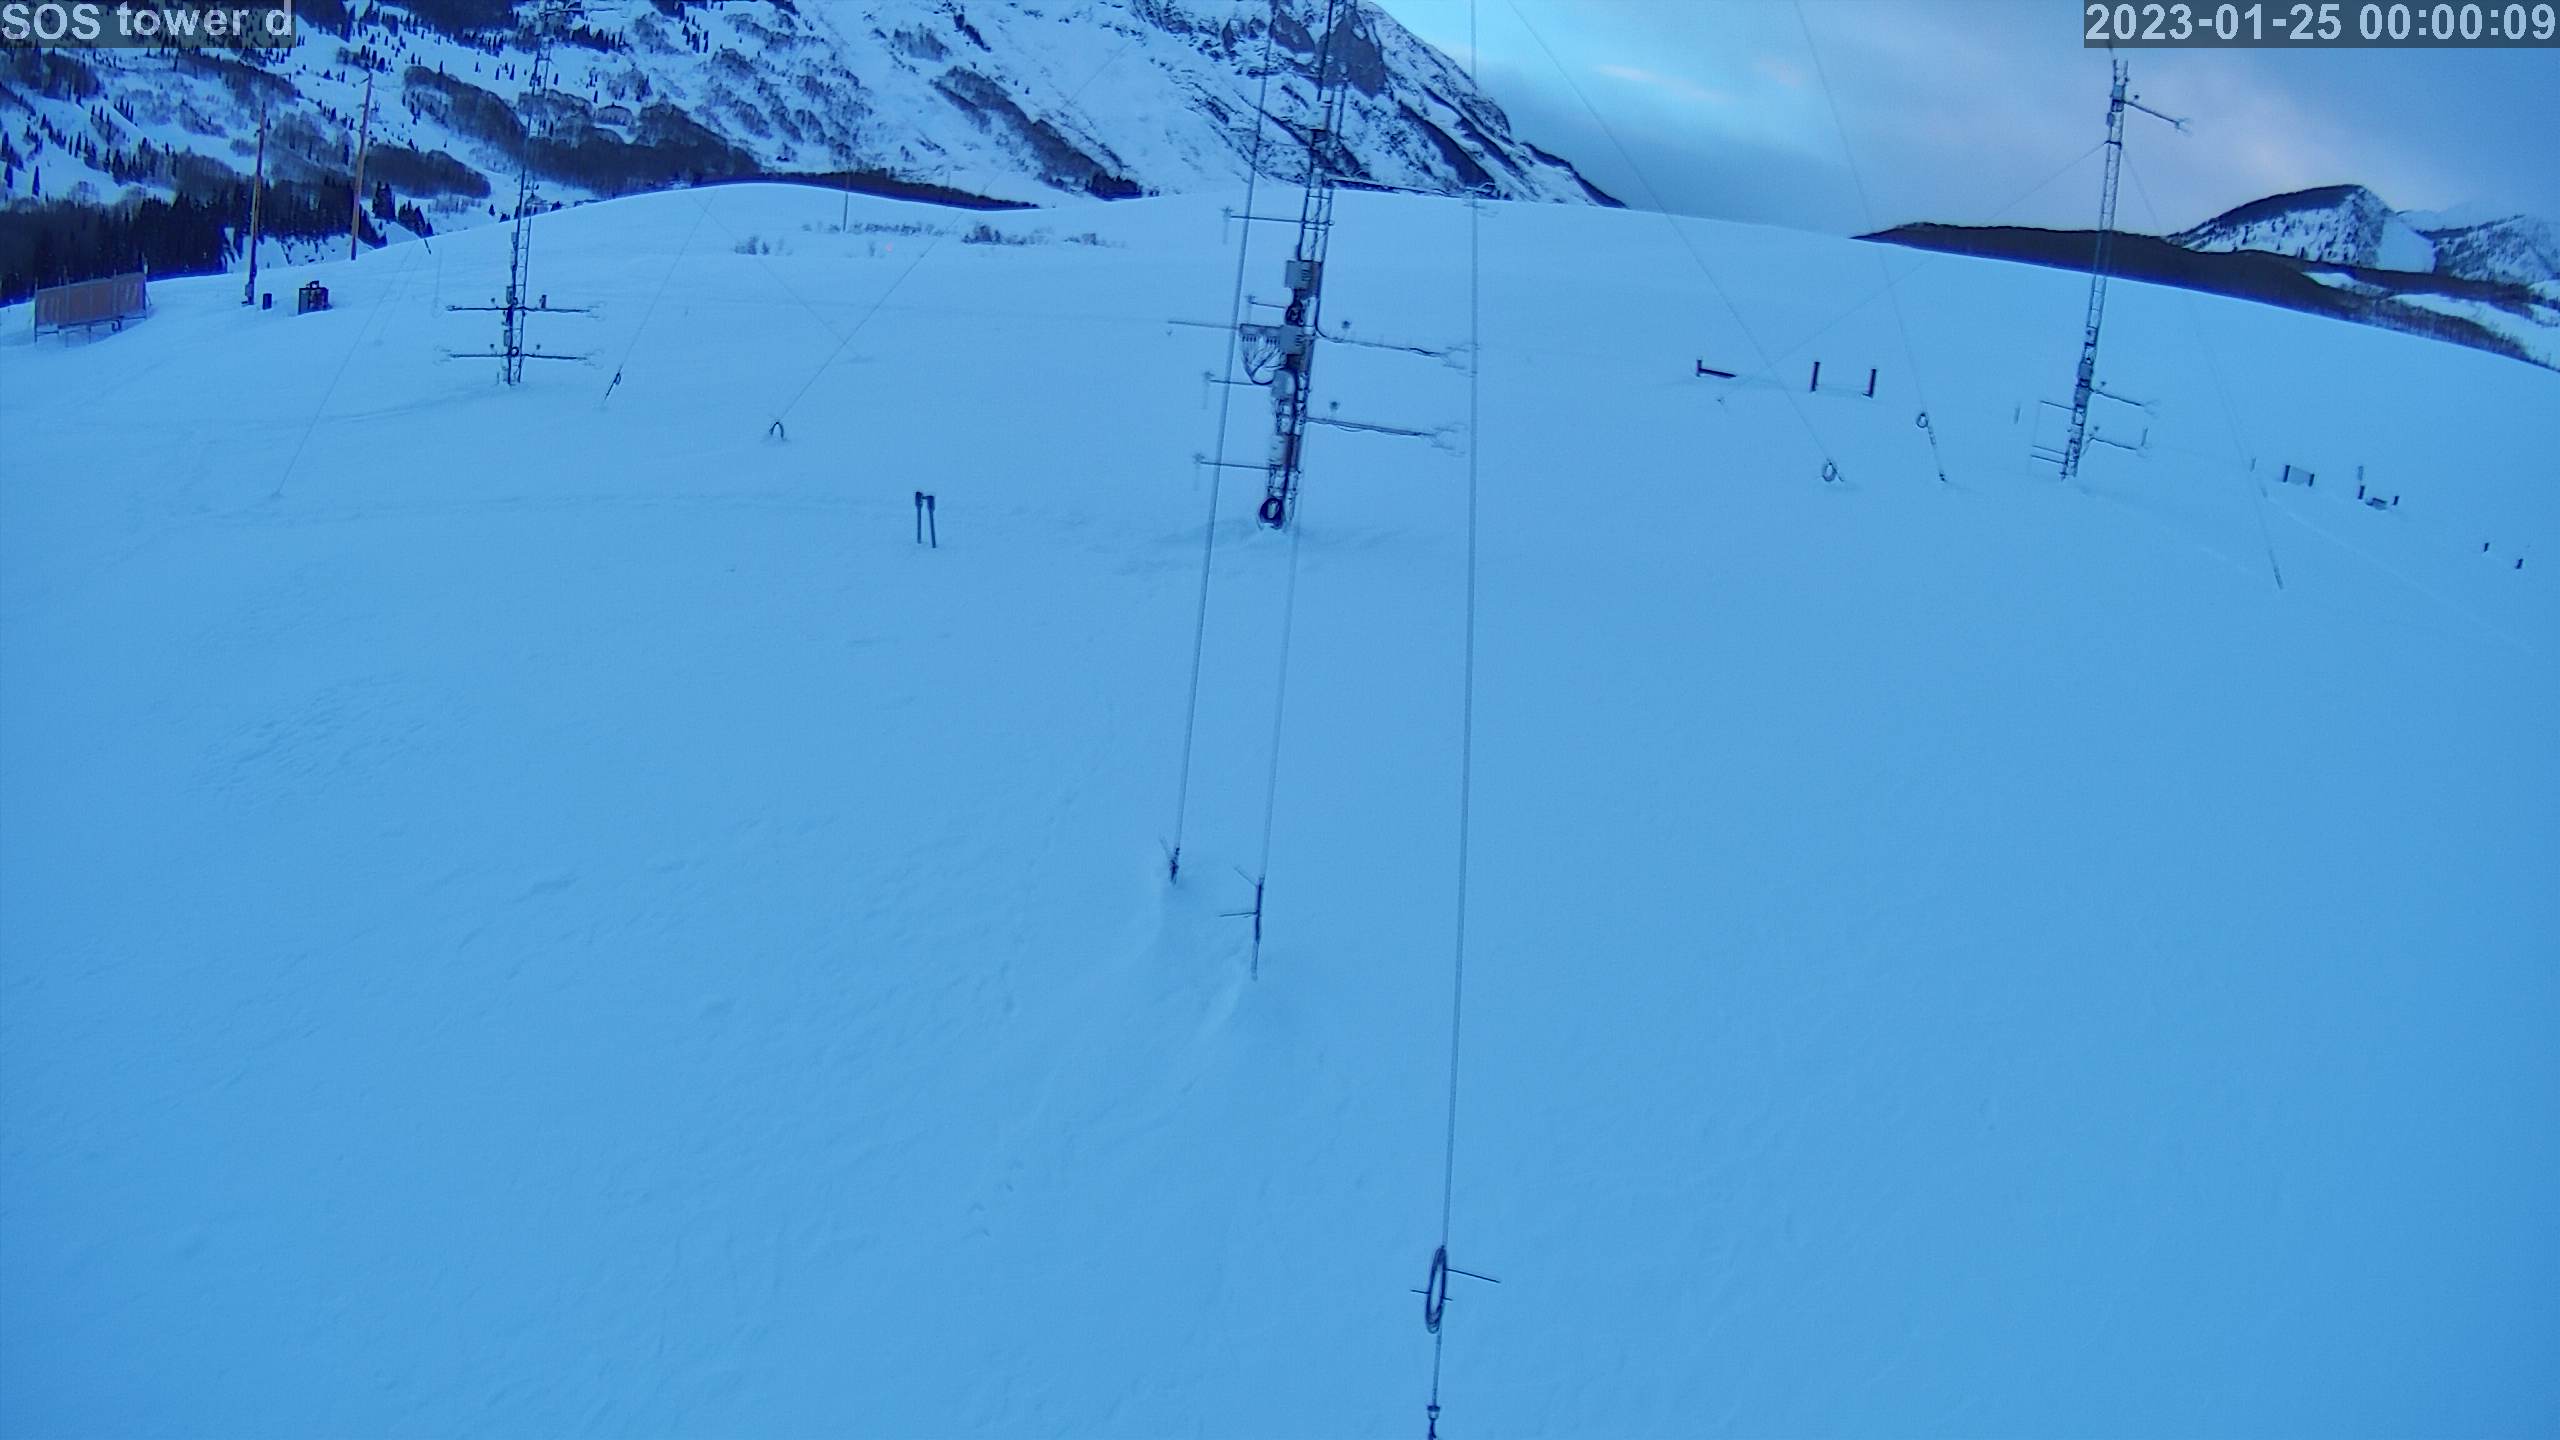
|
photo 2023012501
|
photo 2023012502
|
photo 2023012503
|
photo 2023012504
|
photo 2023012505
|
photo 2023012506
|
photo 2023012507
|
photo 2023012508
|
photo 2023012509
|
photo 2023012510
|
photo 2023012511
|
photo 2023012512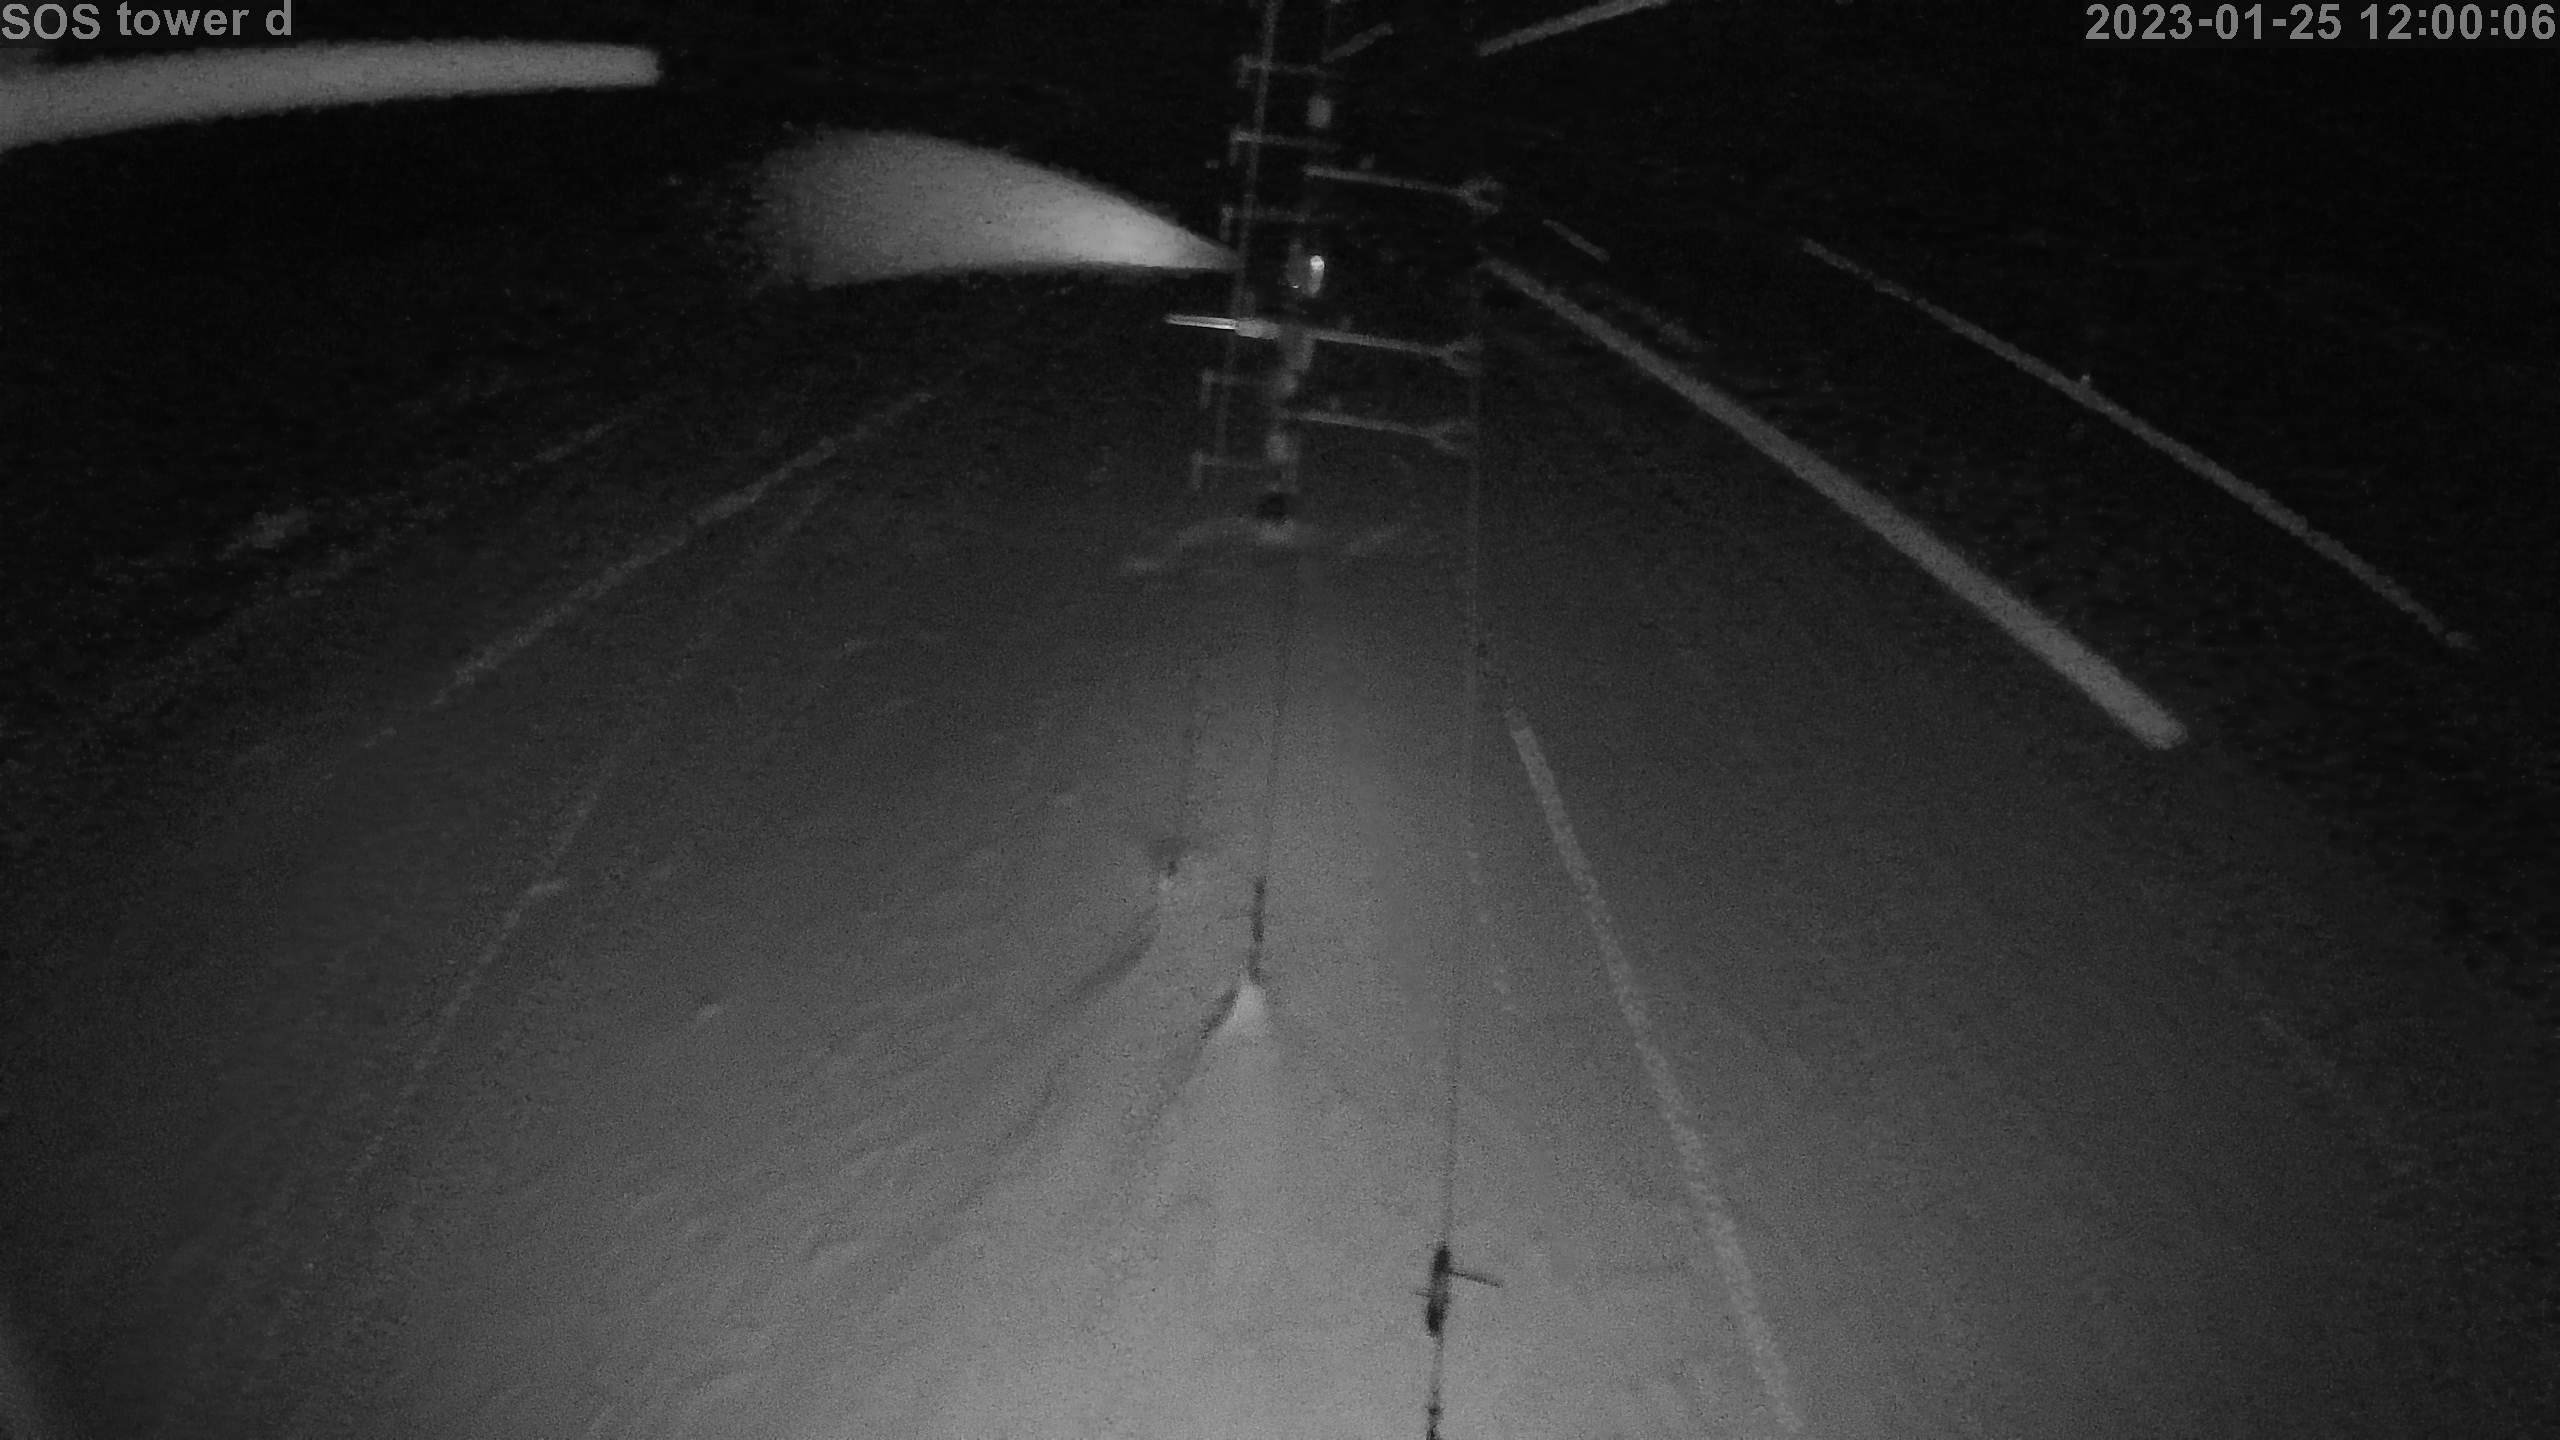
|
photo 2023012513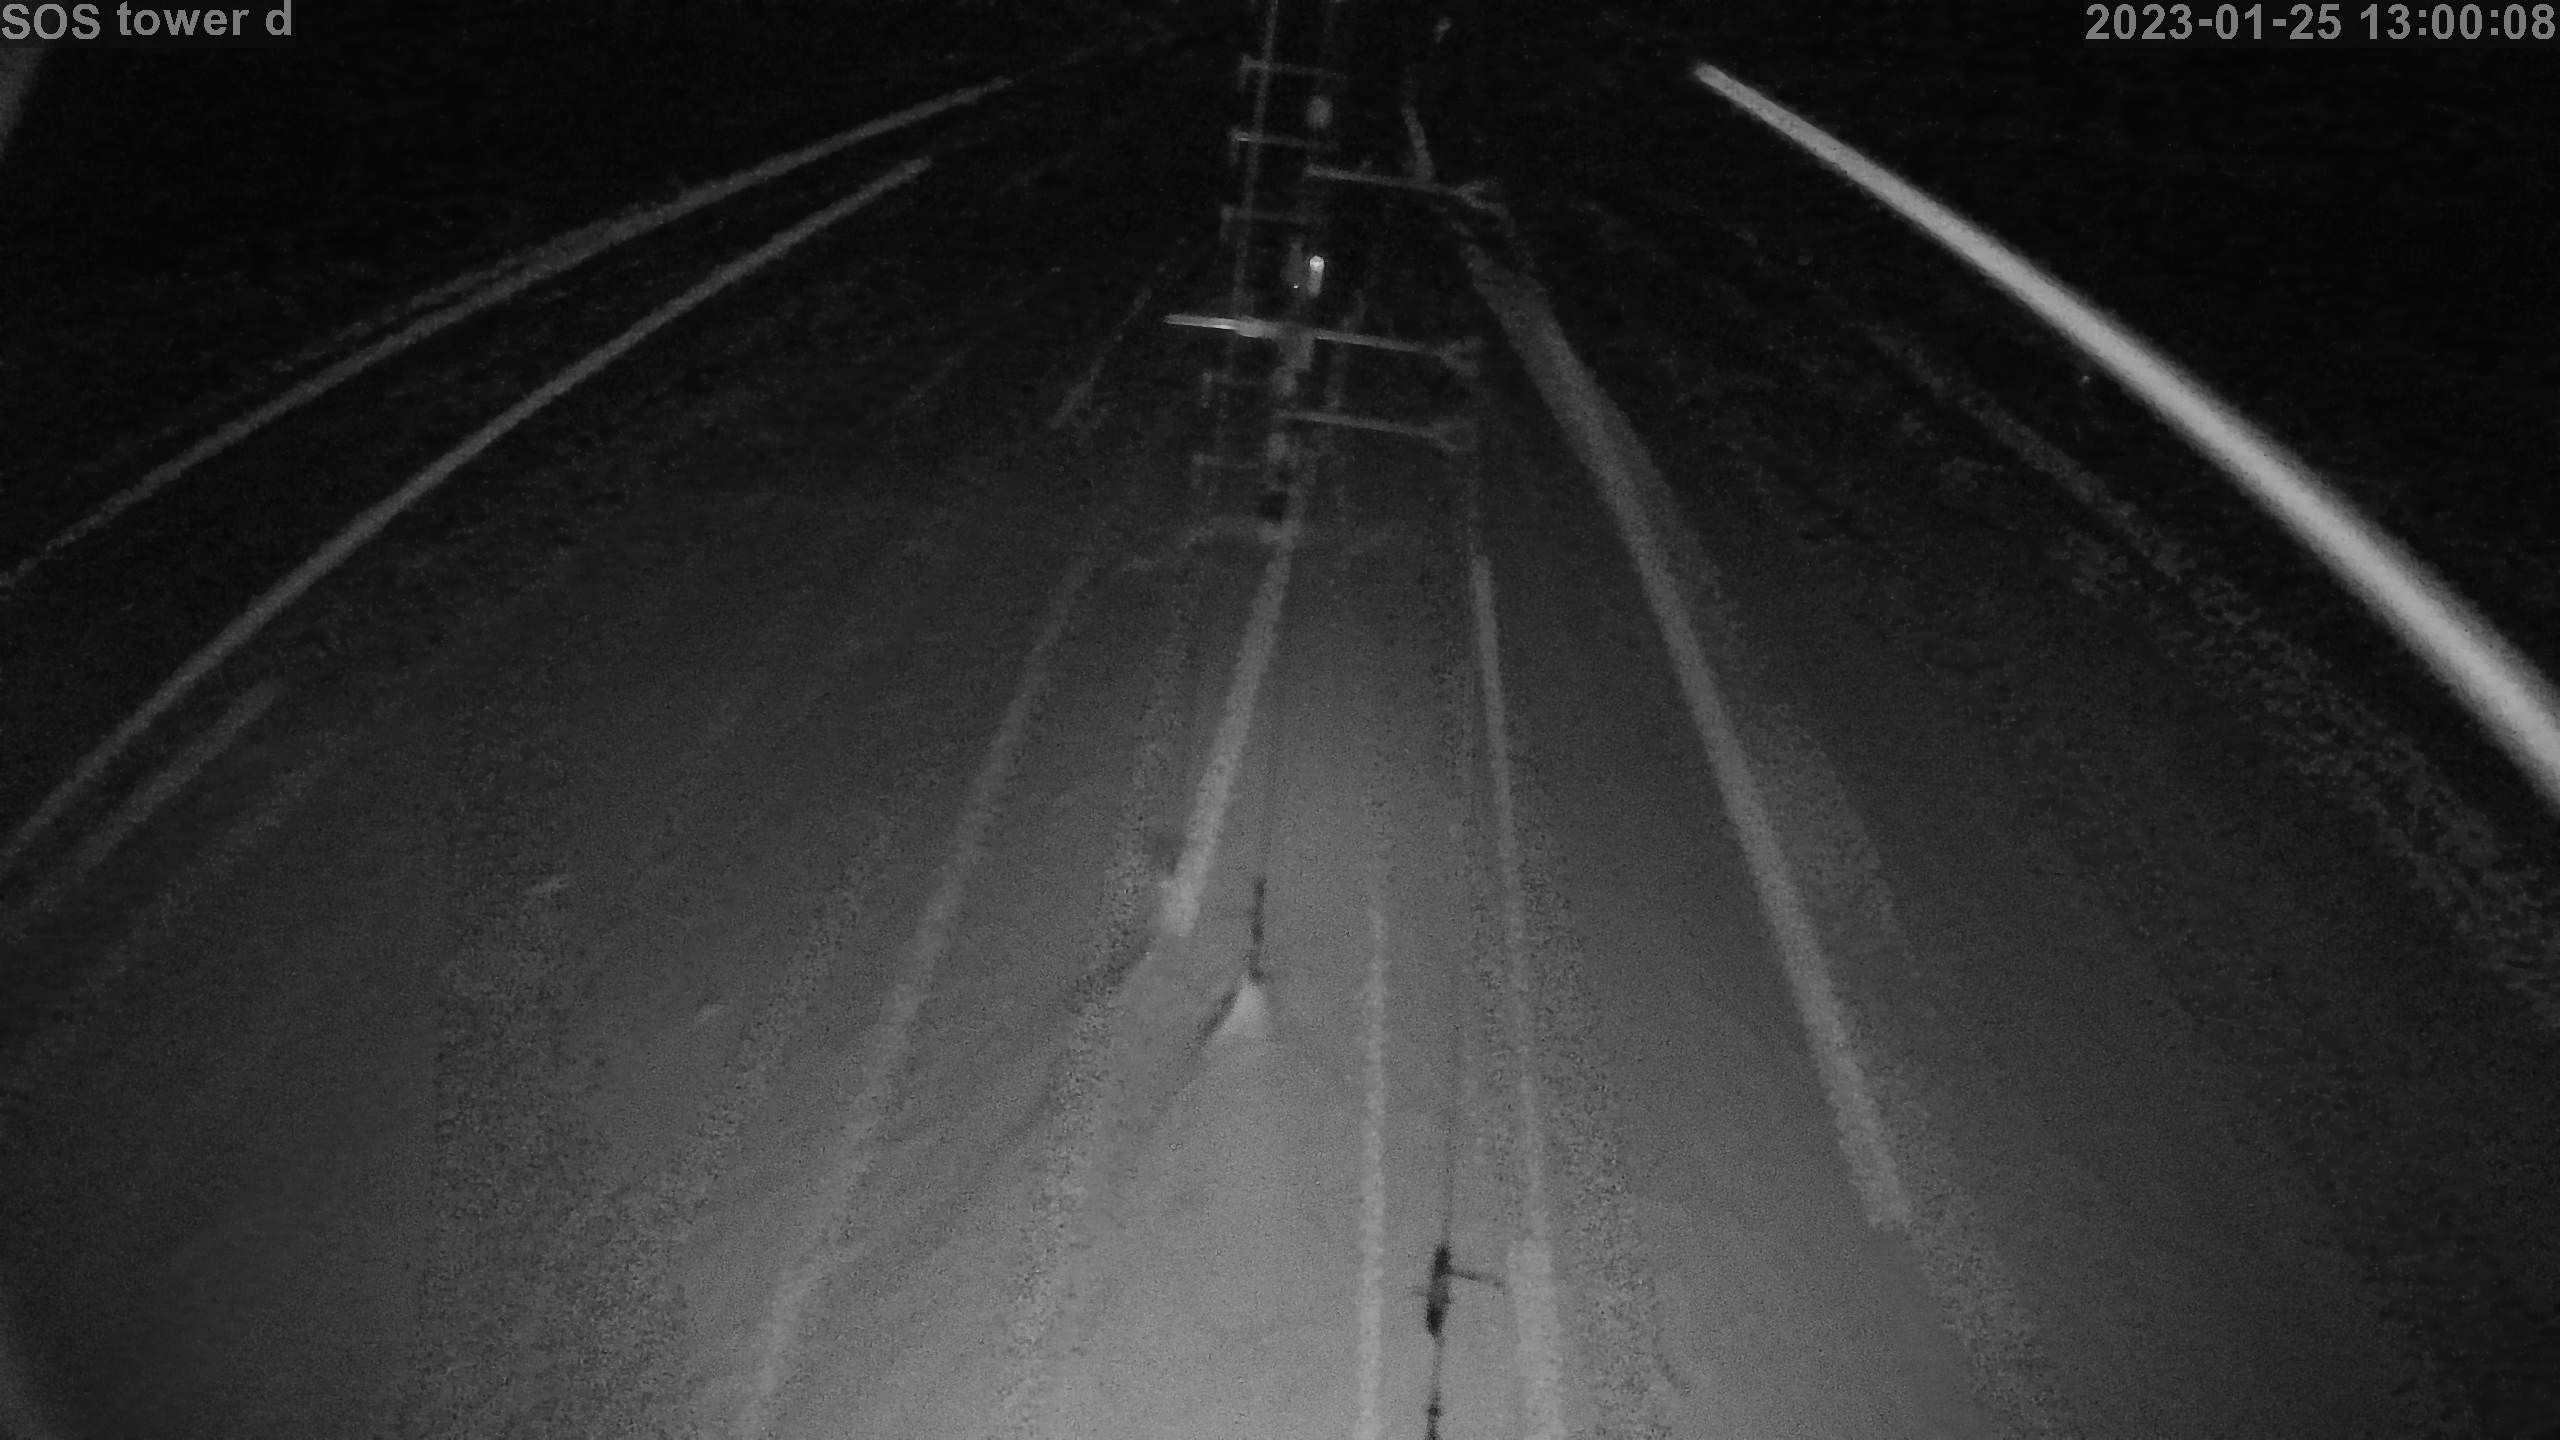
|
photo 2023012514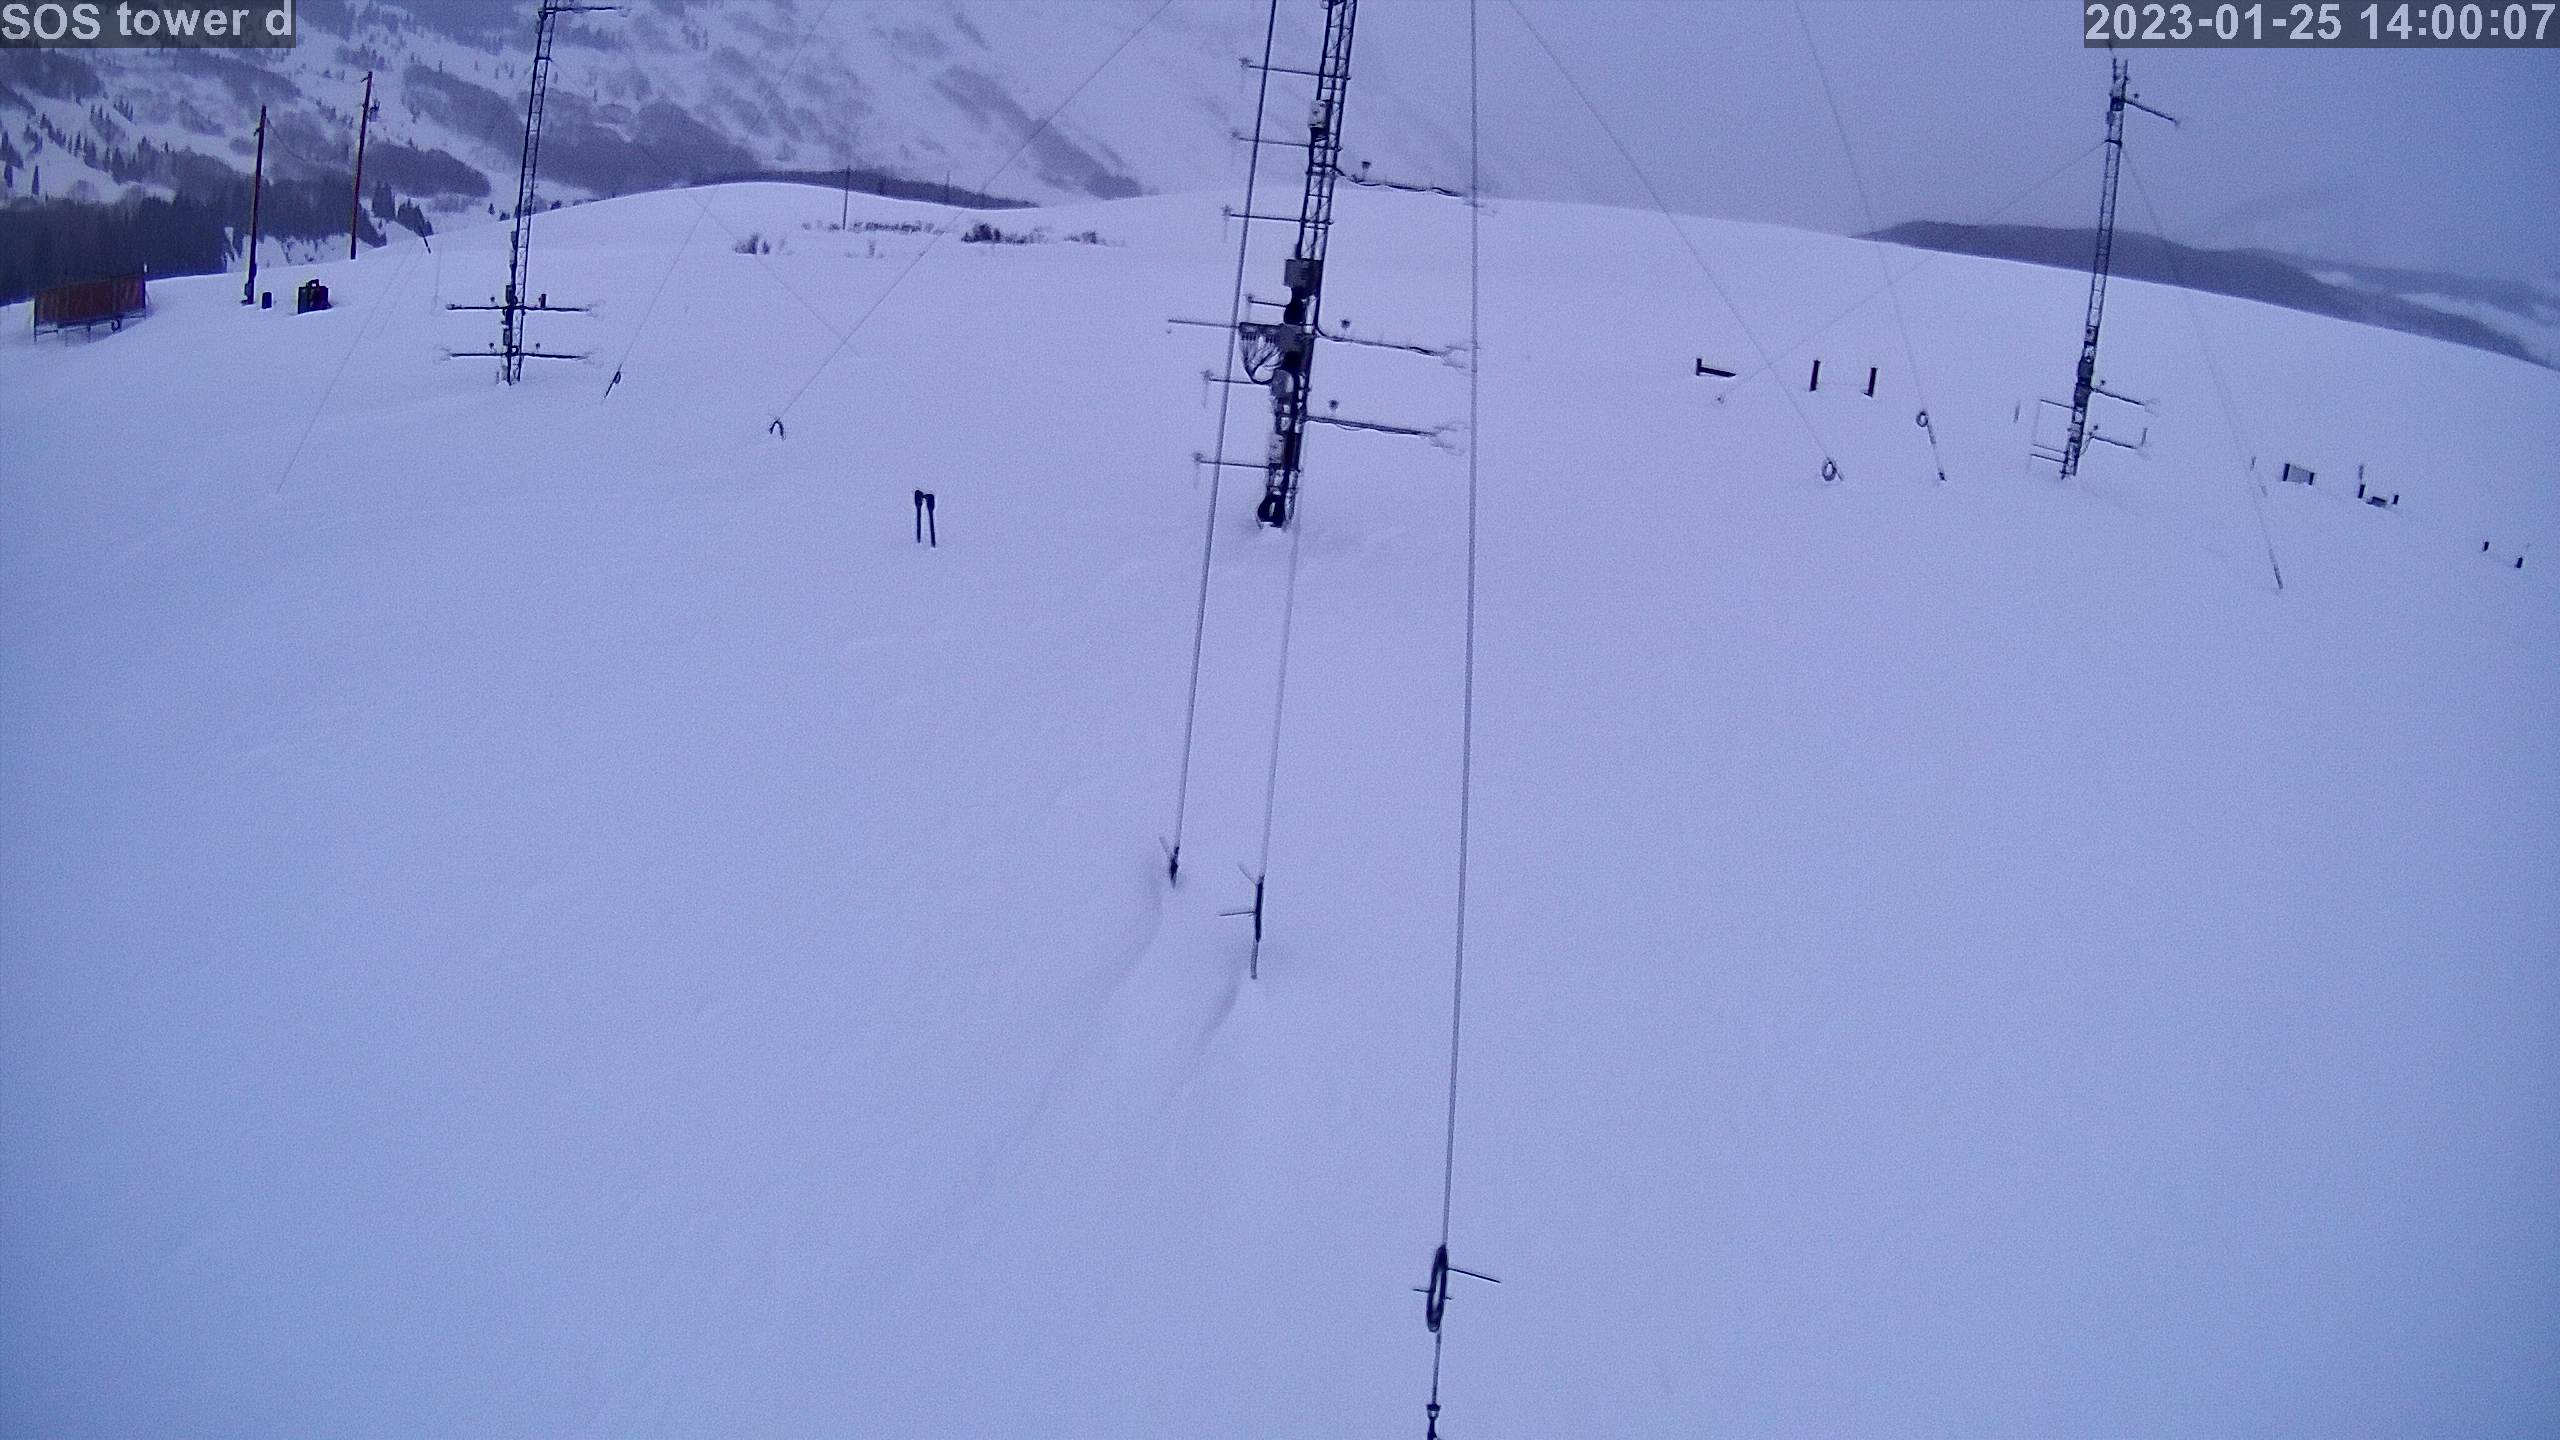
|
photo 2023012515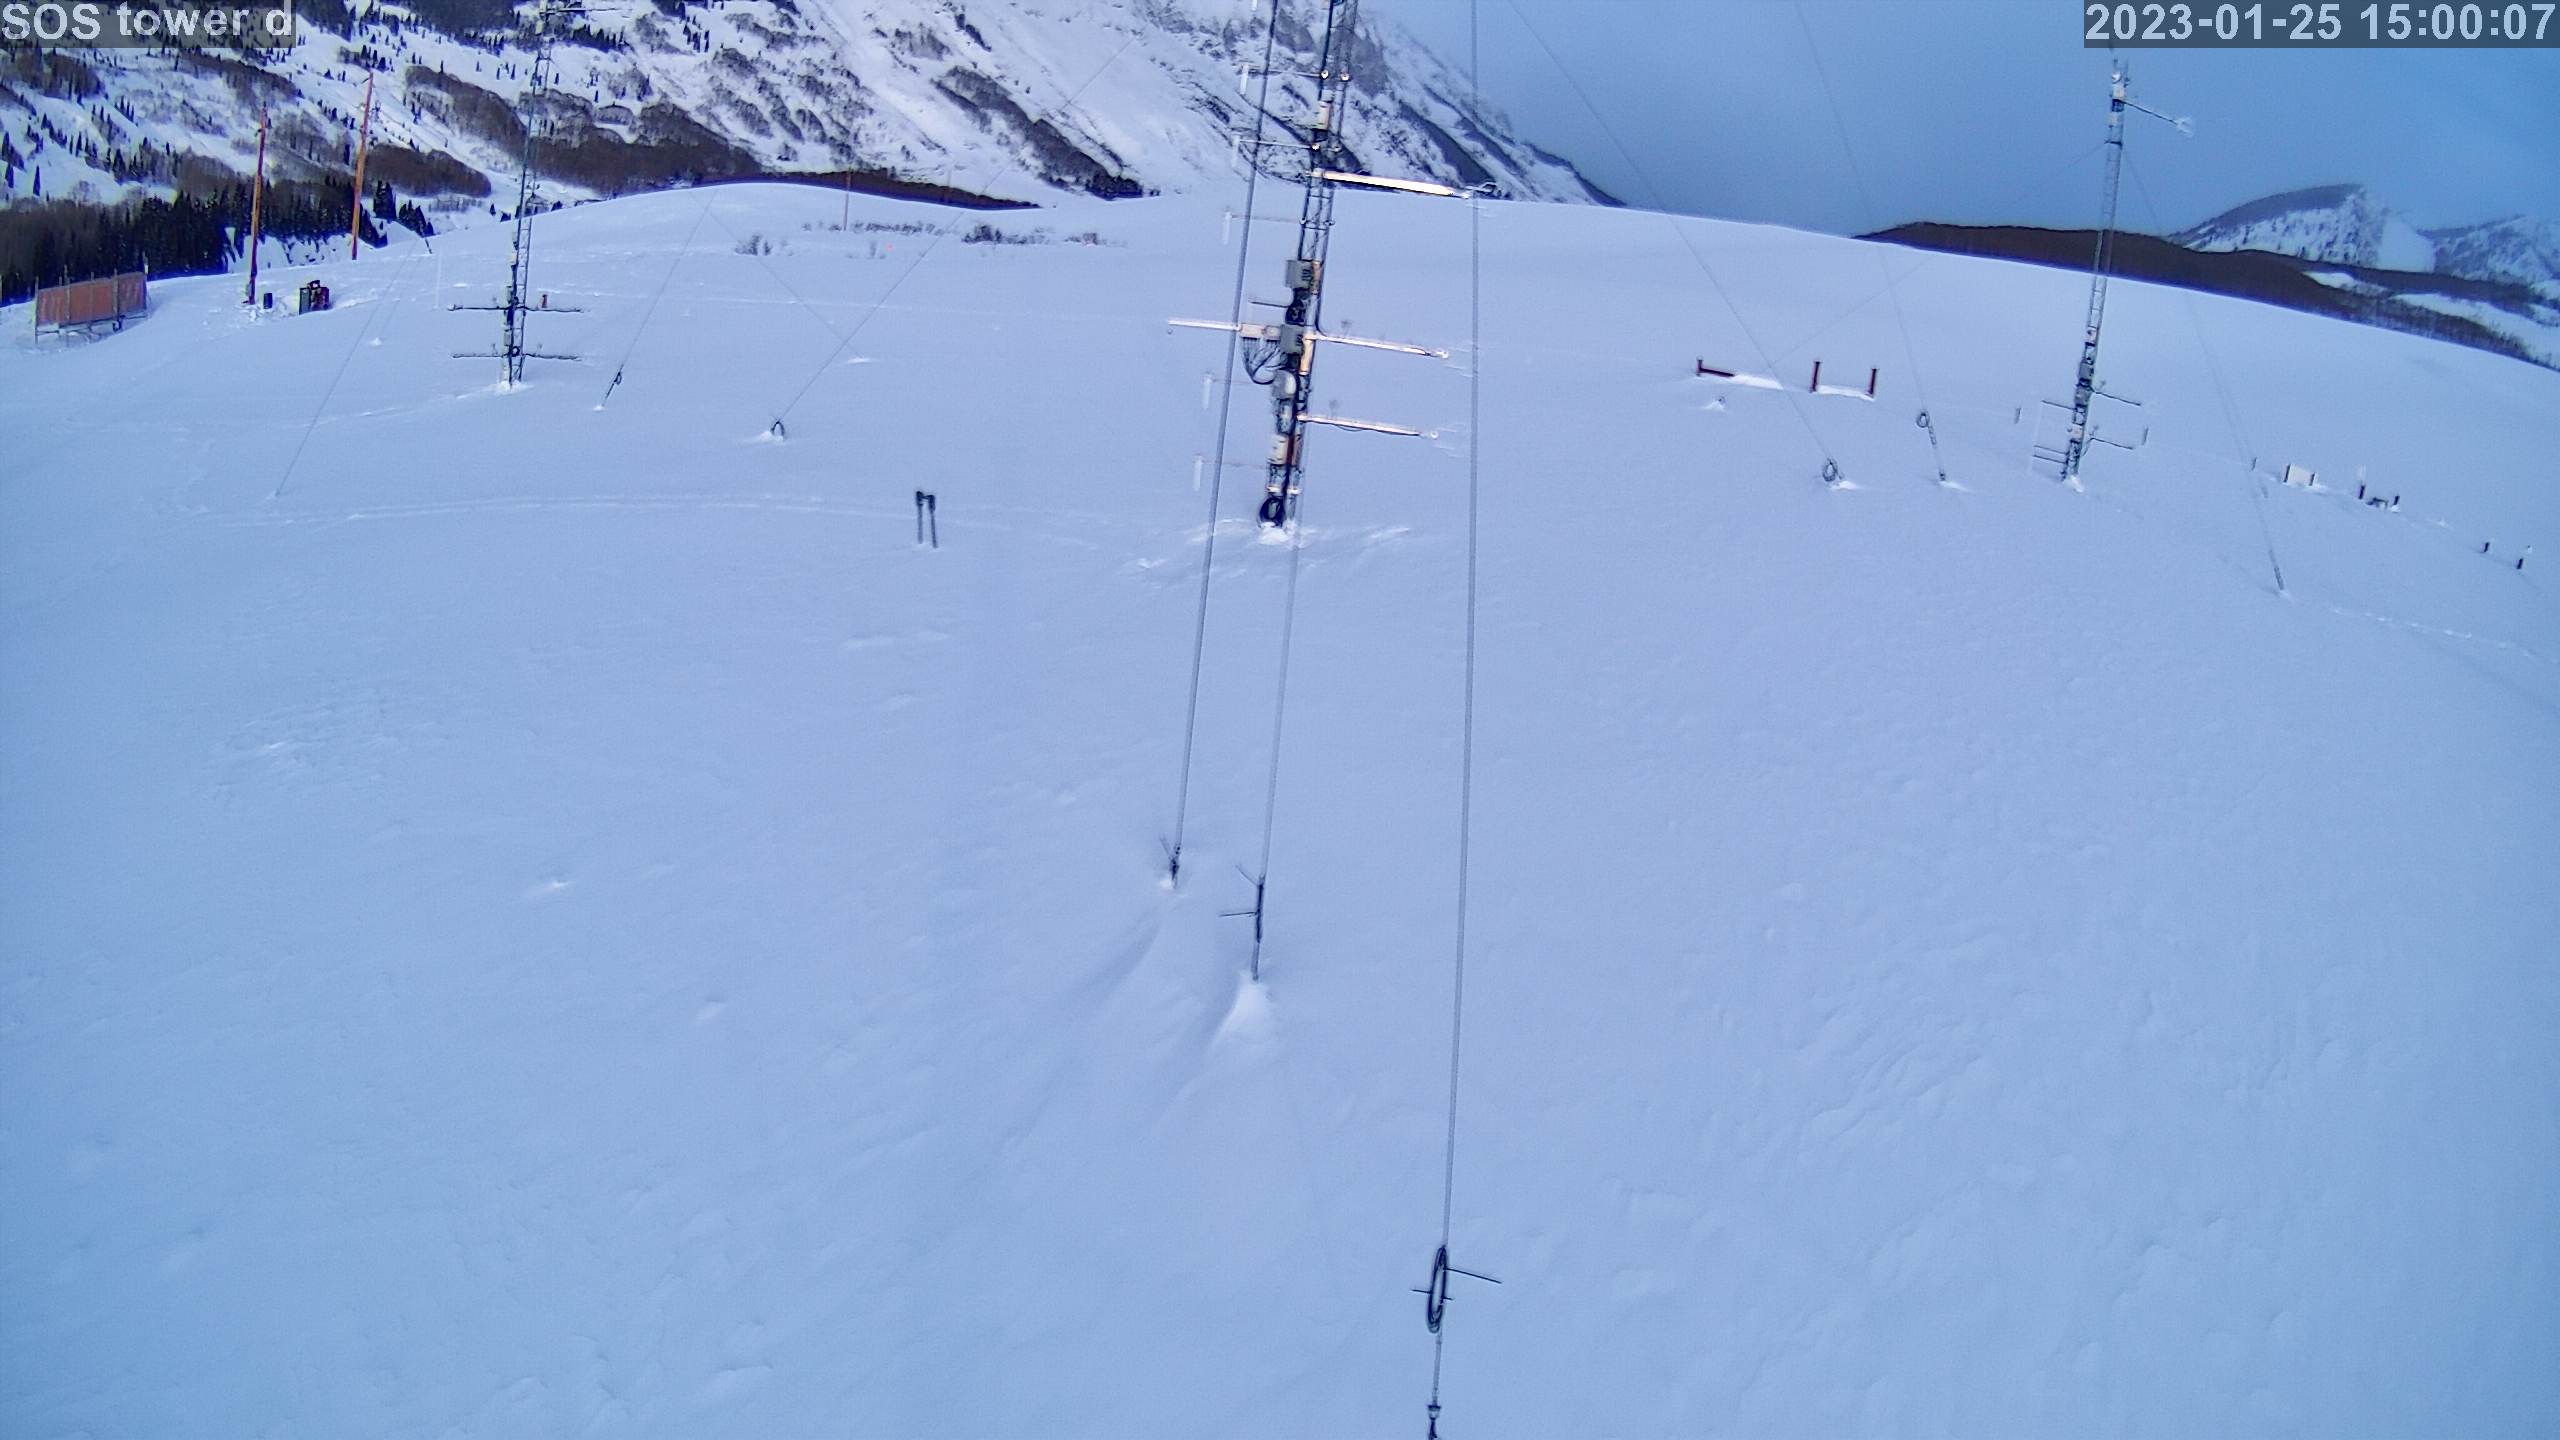
|
photo 2023012516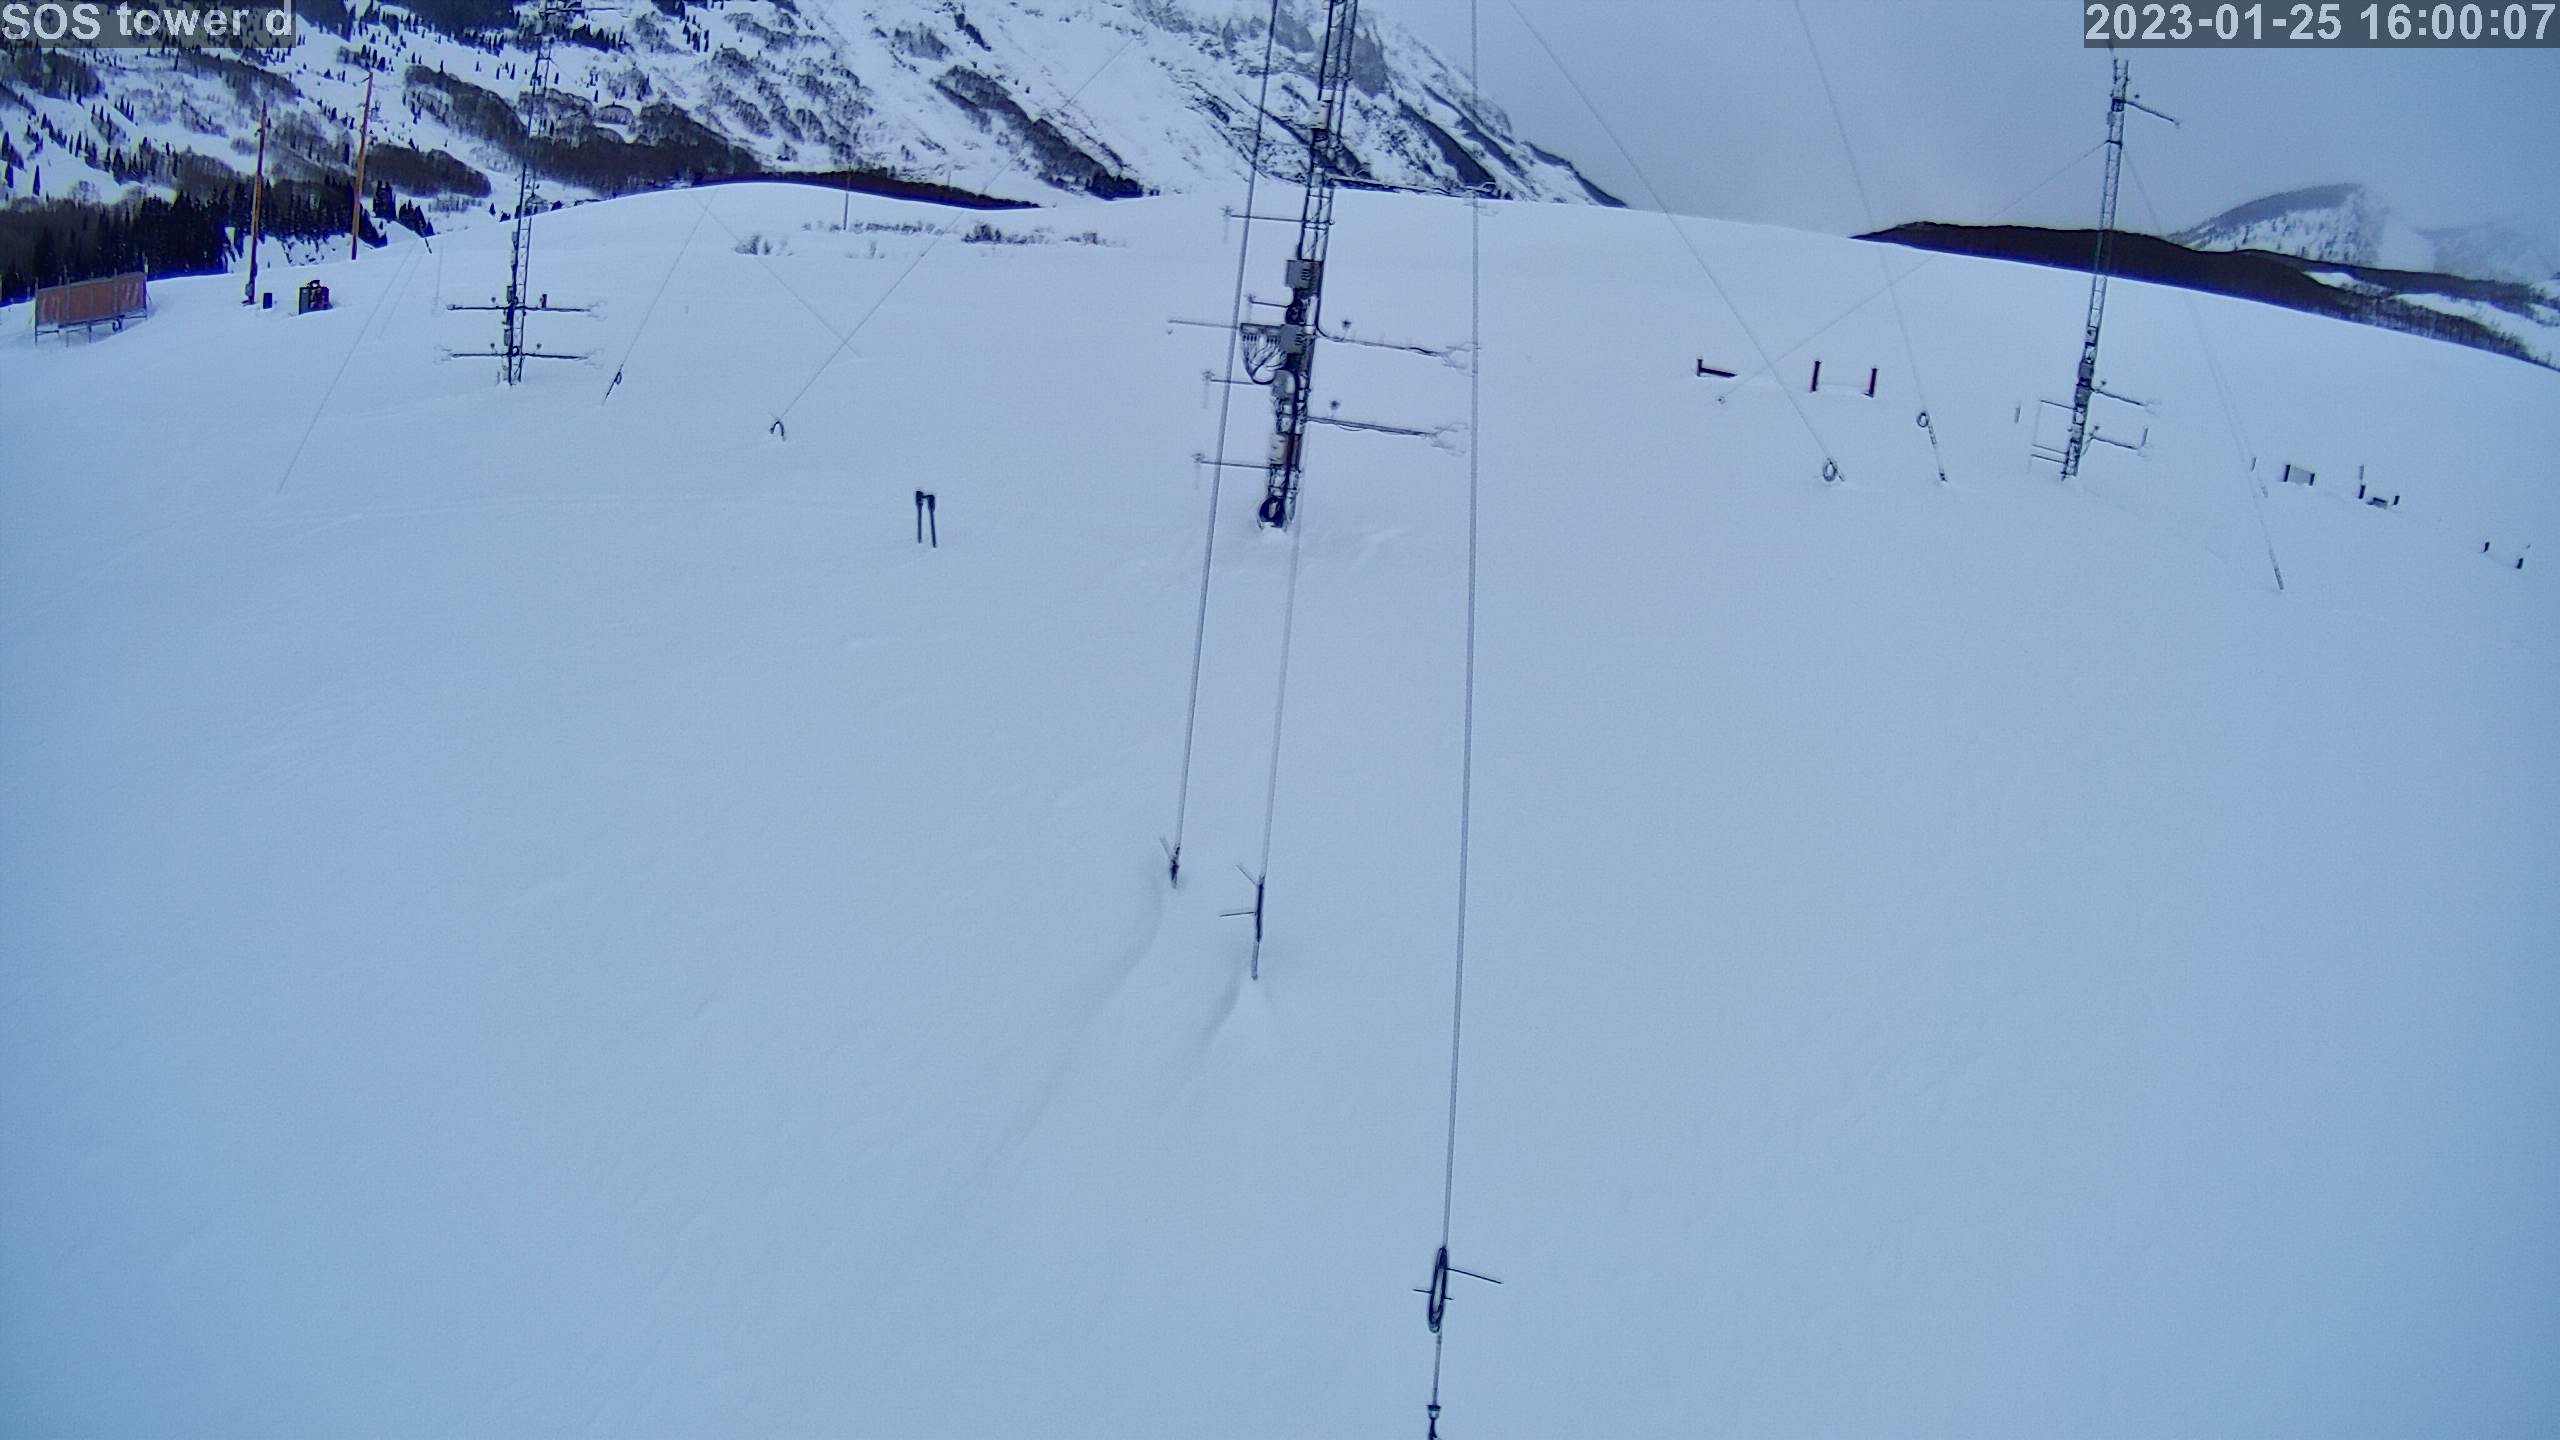
|
photo 2023012517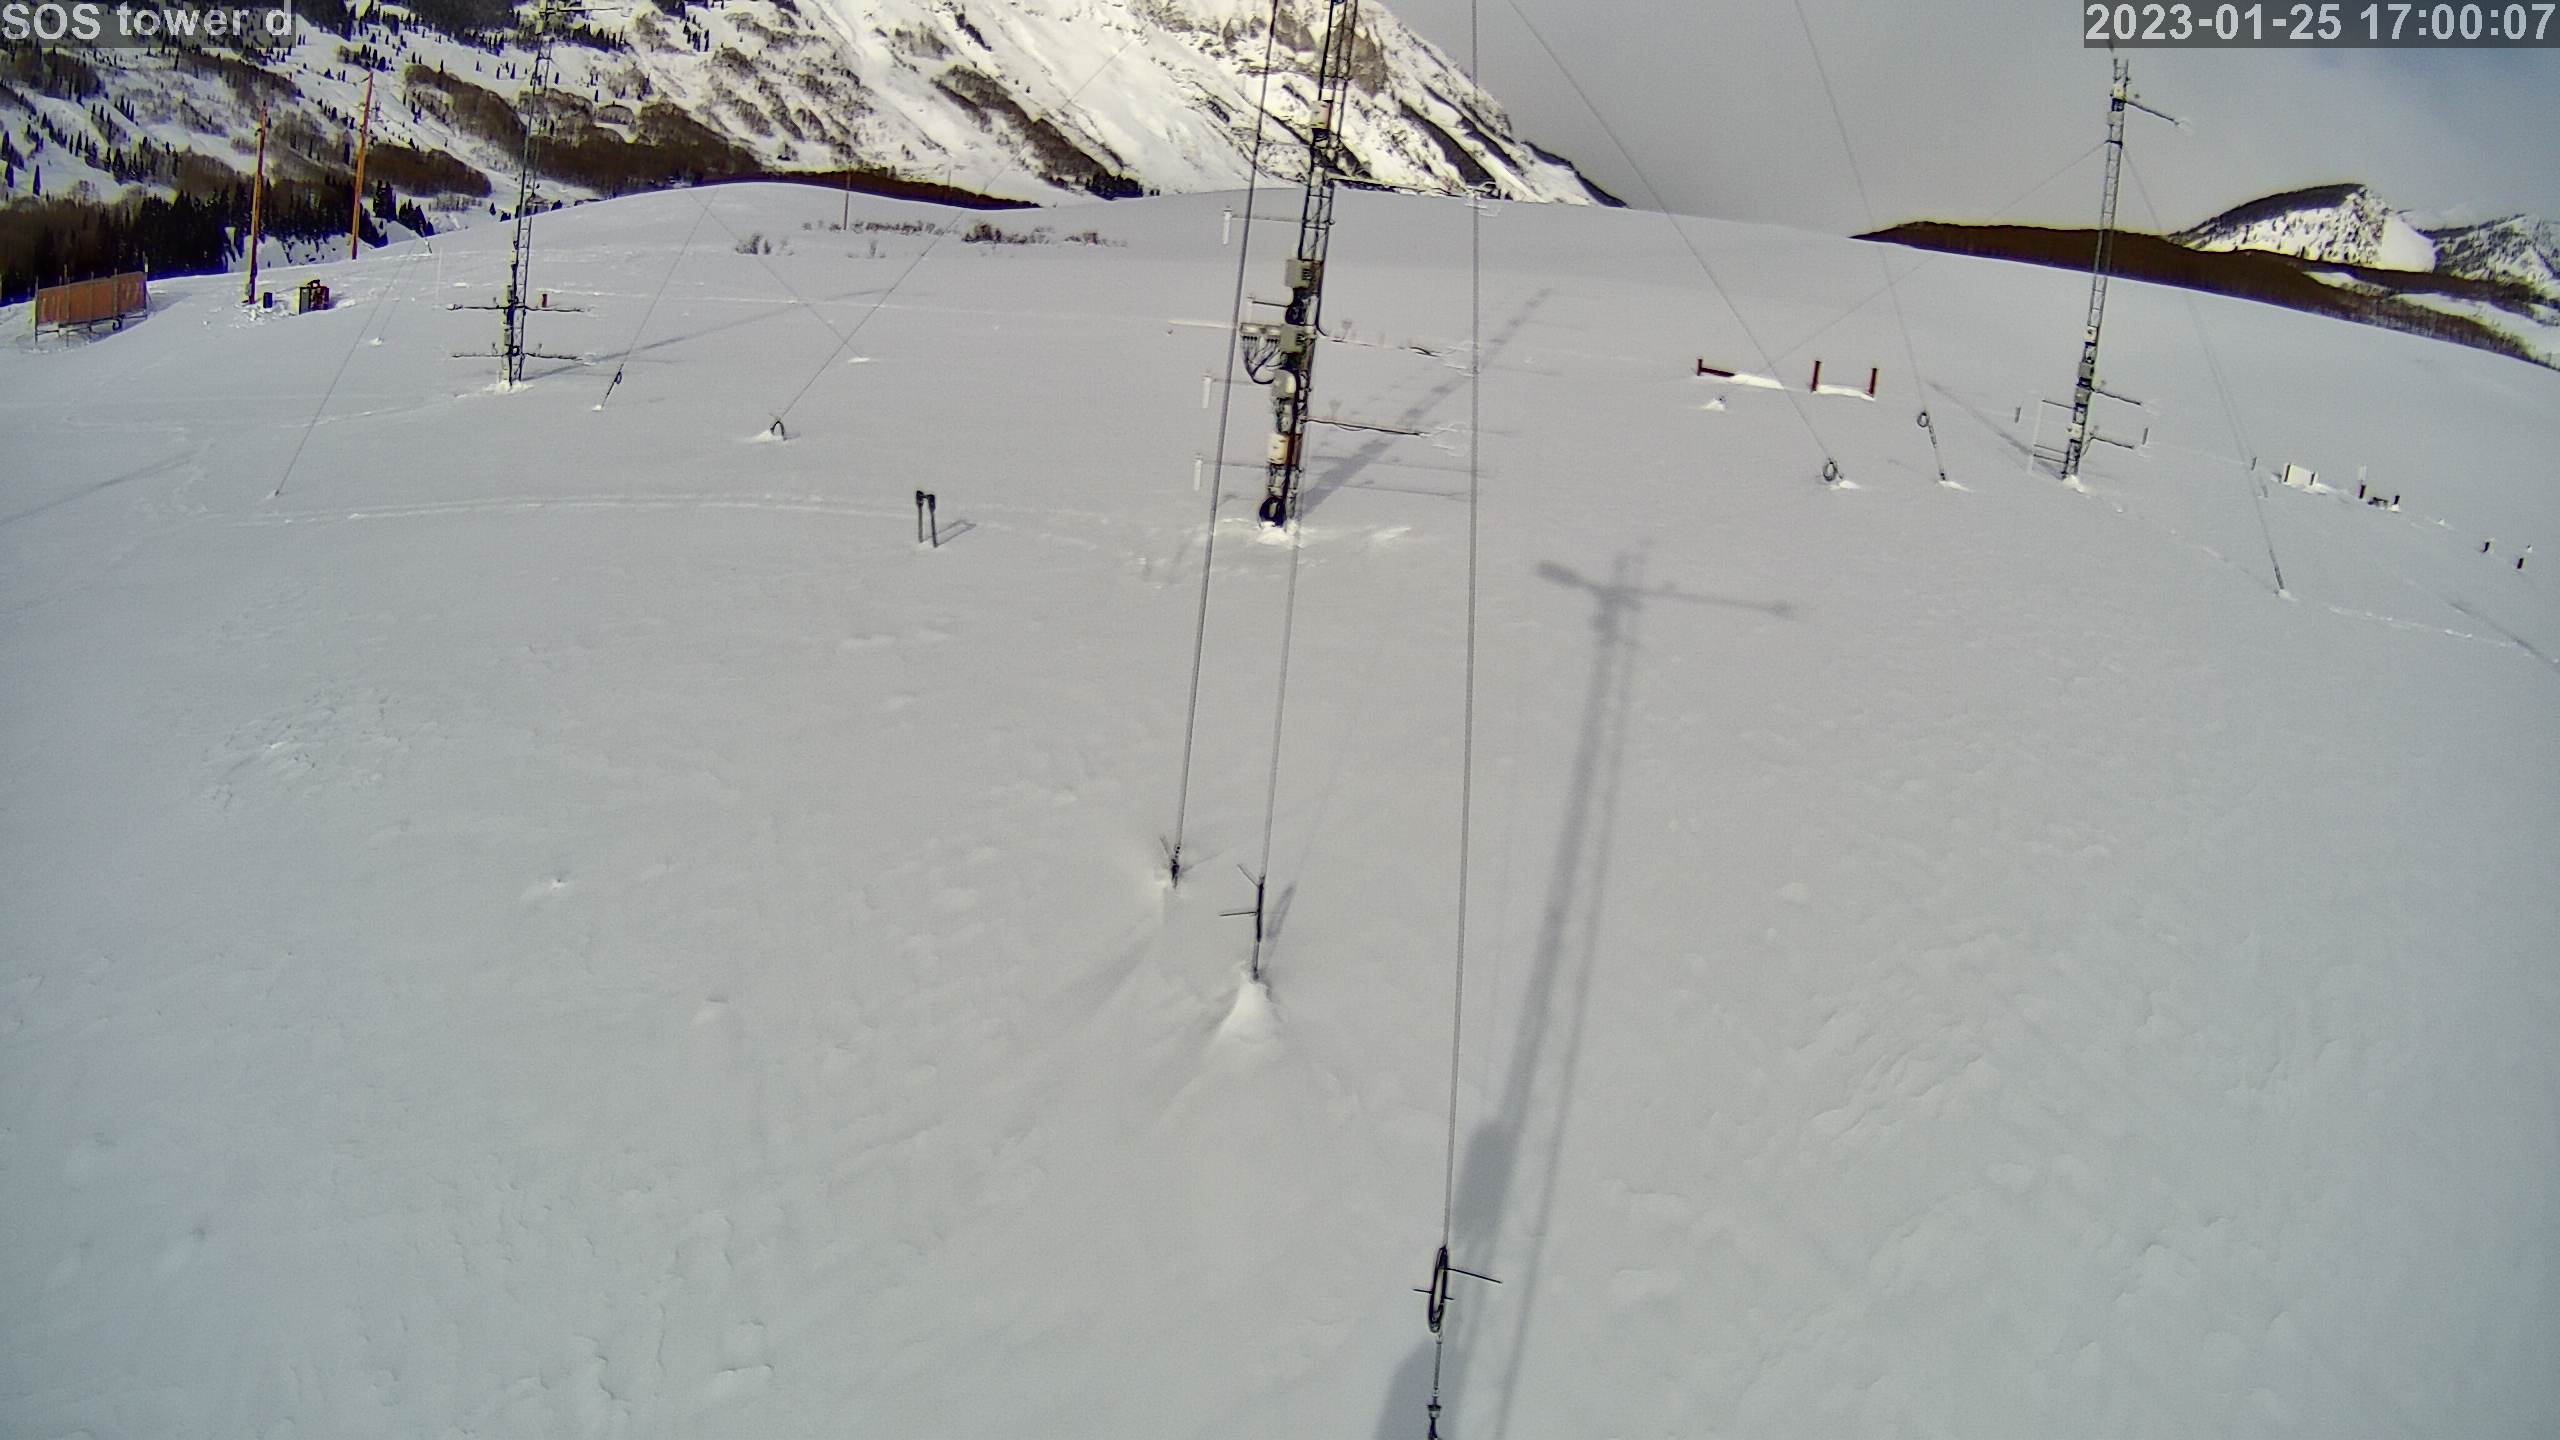
|
photo 2023012518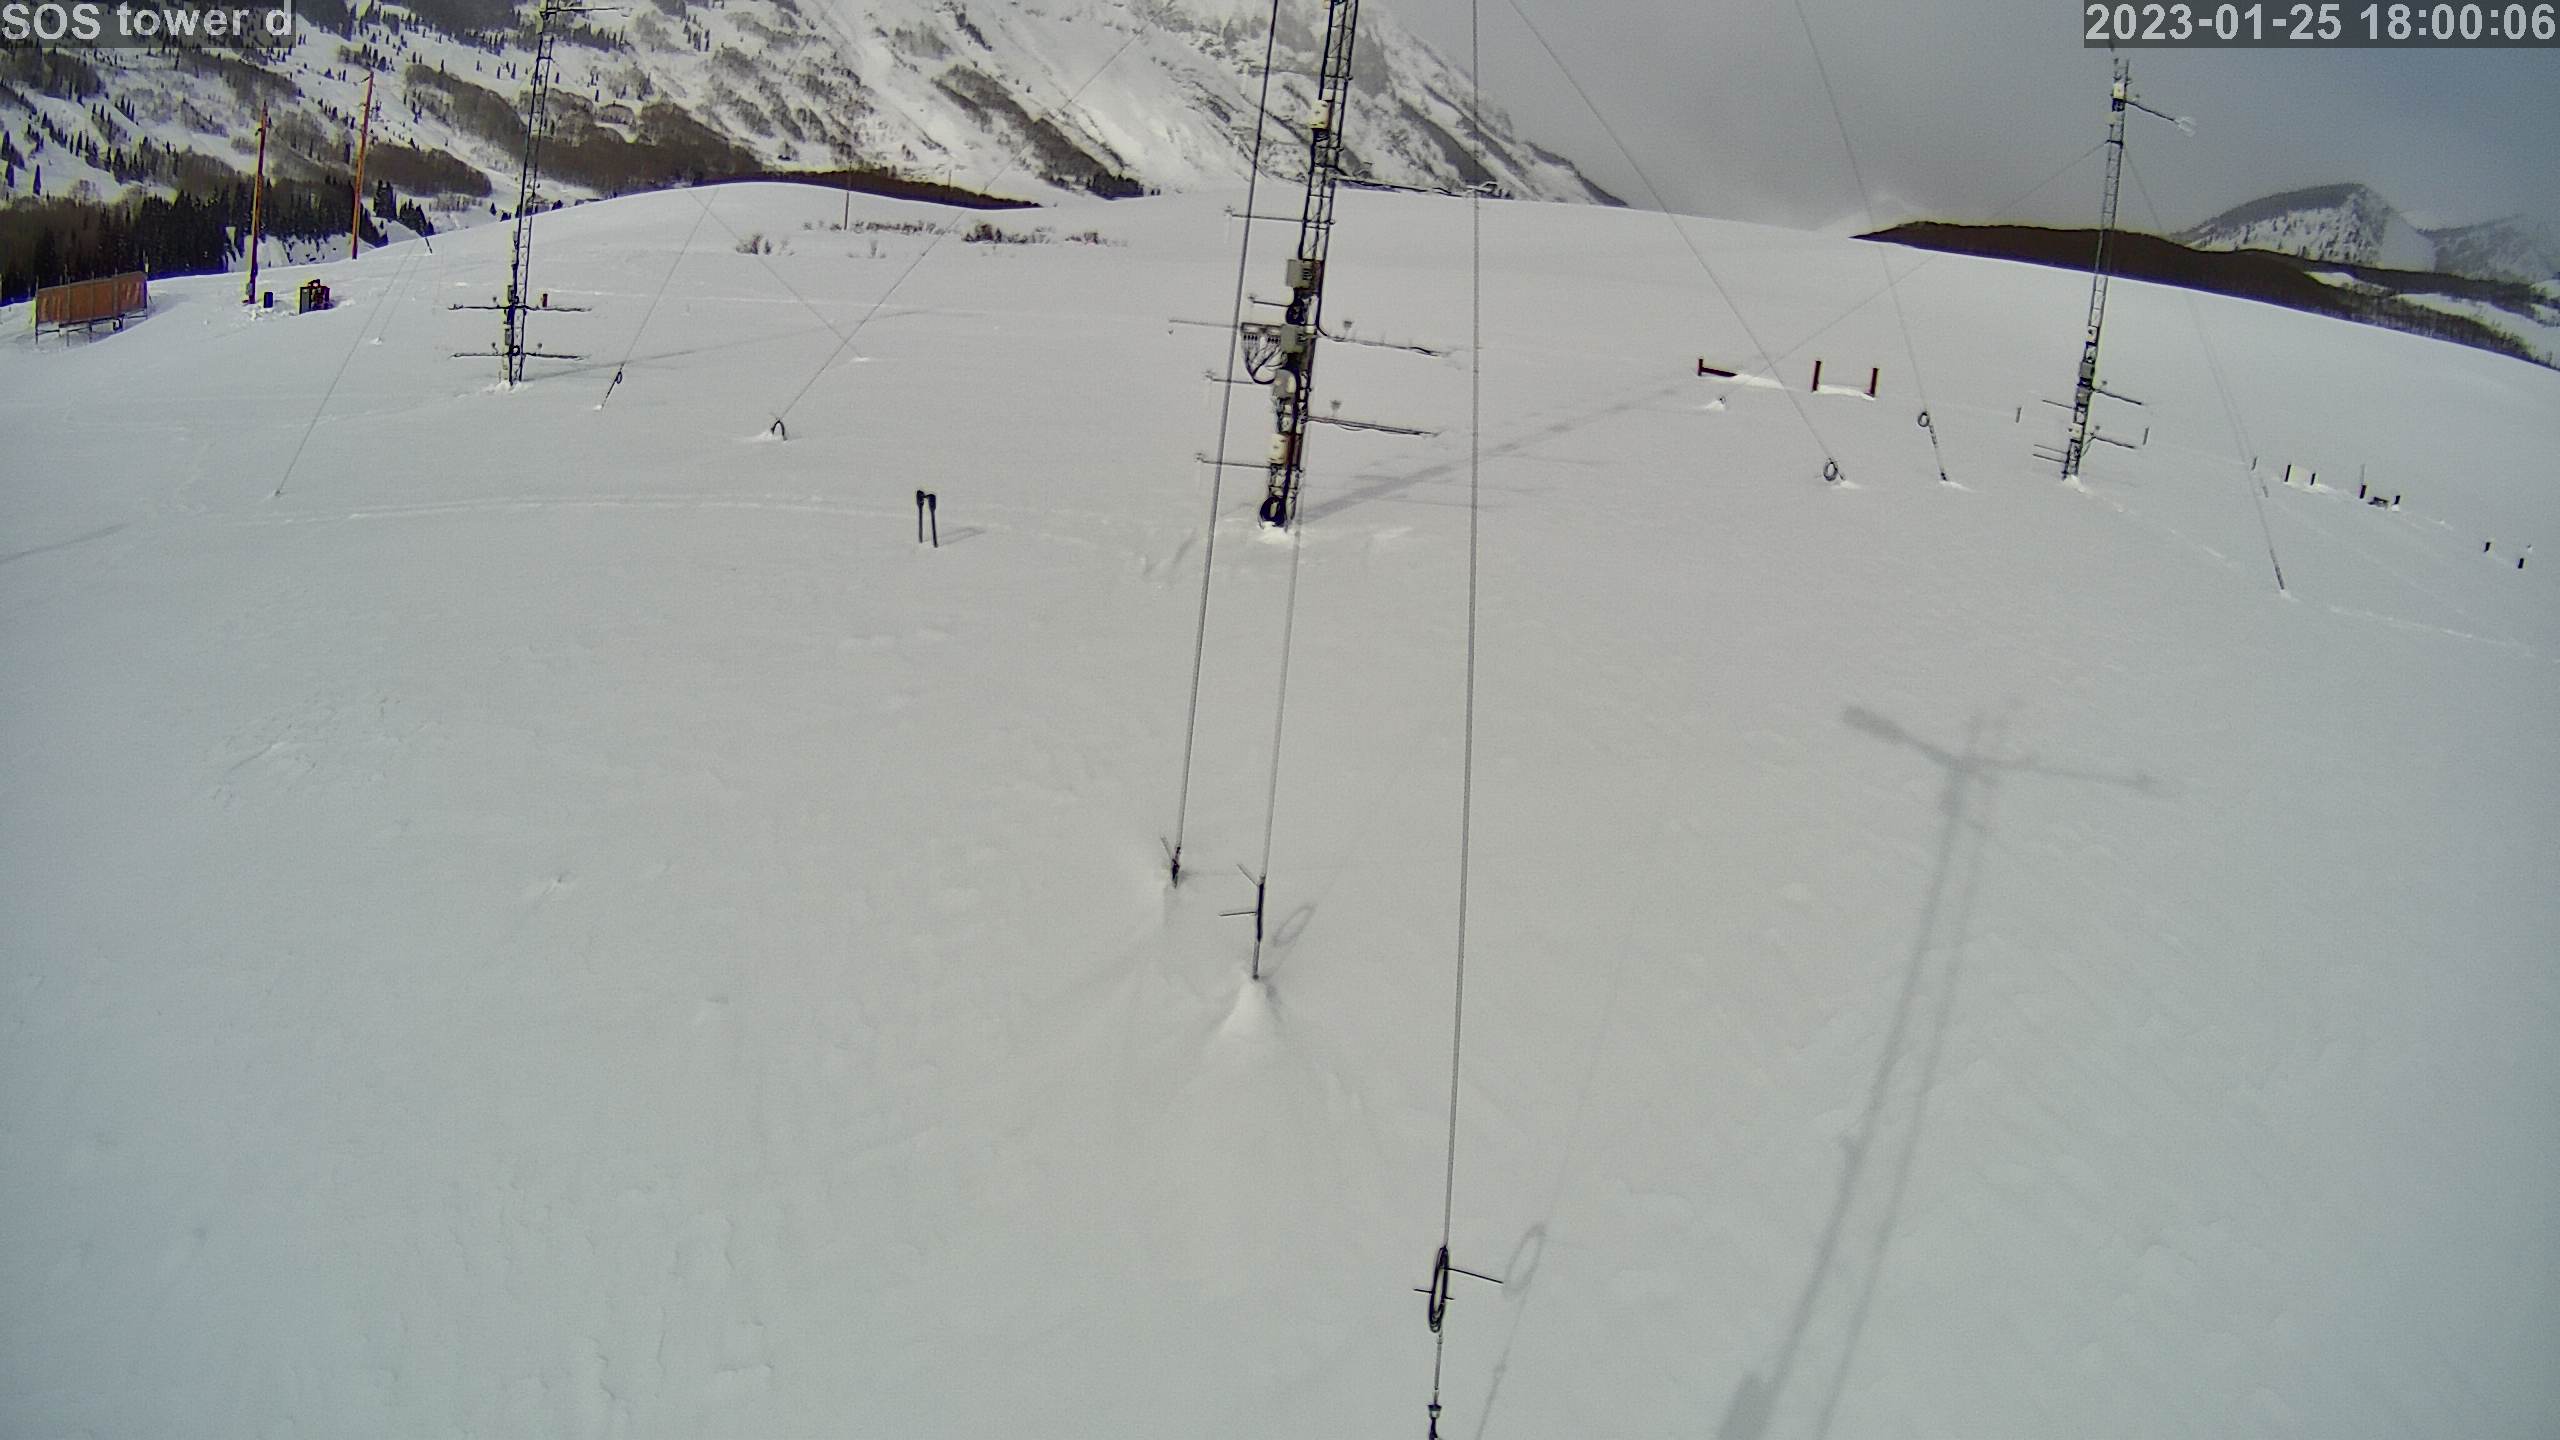
|
photo 2023012519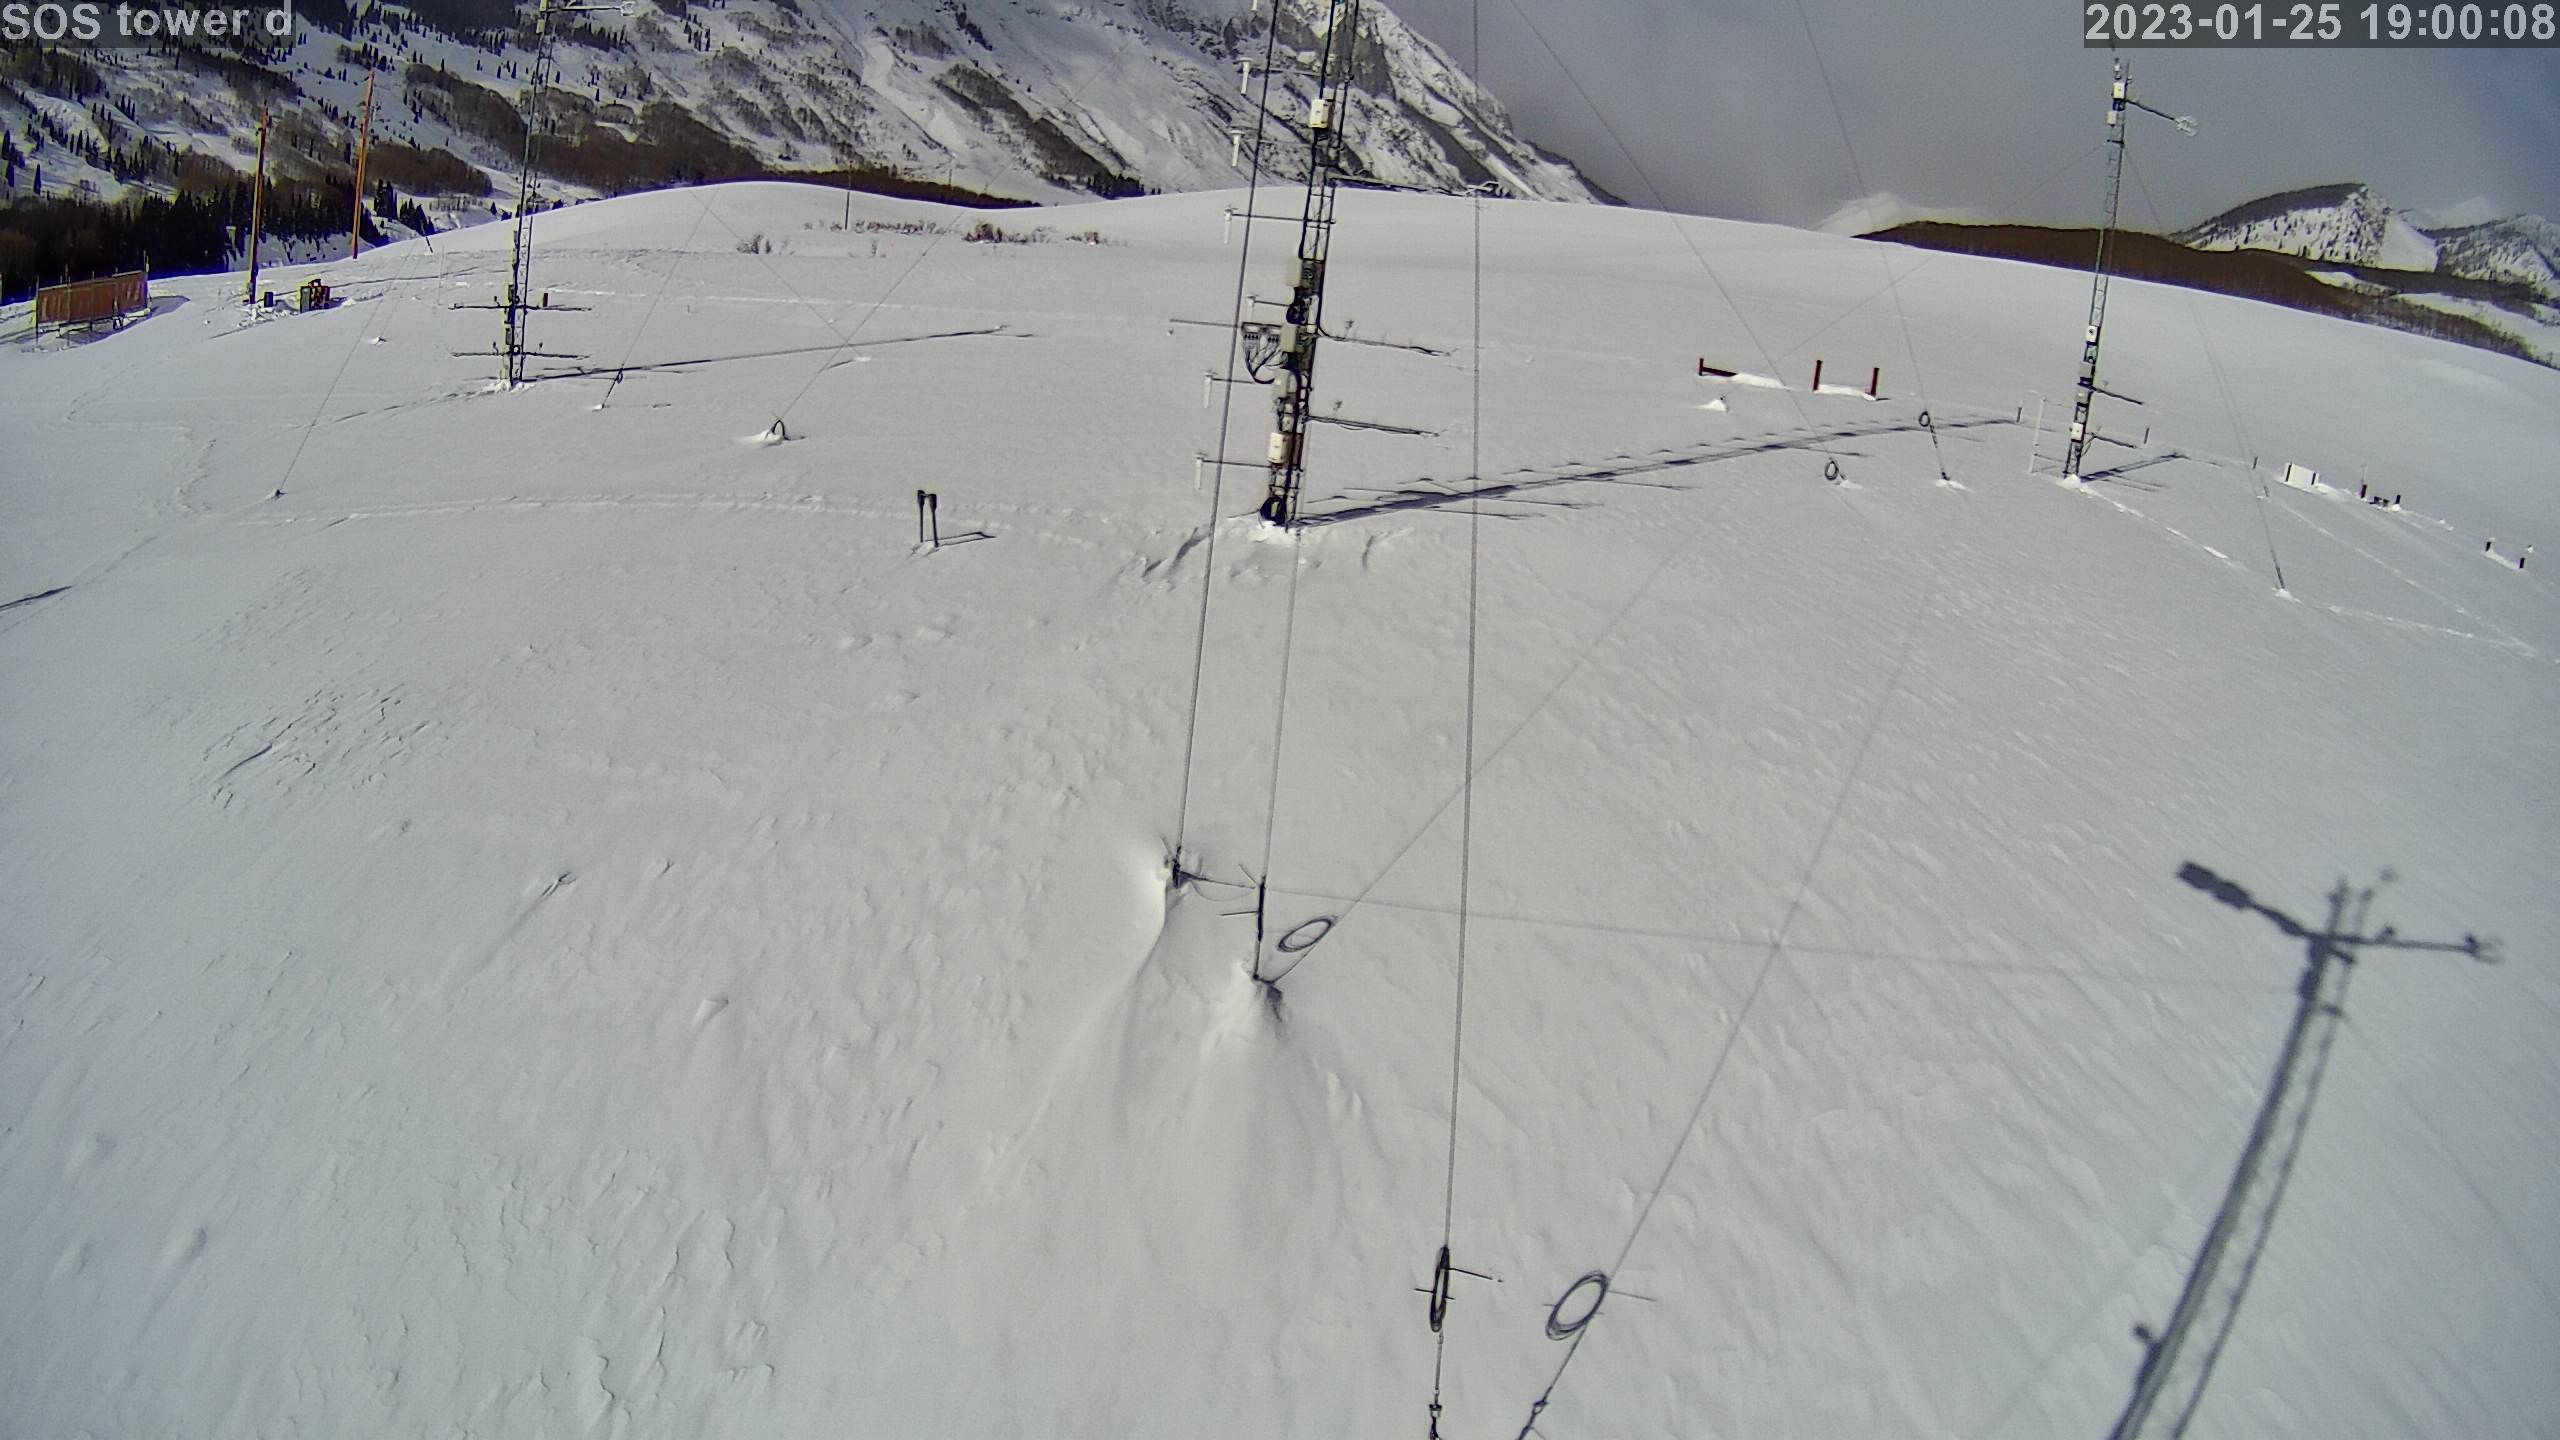
|
photo 2023012520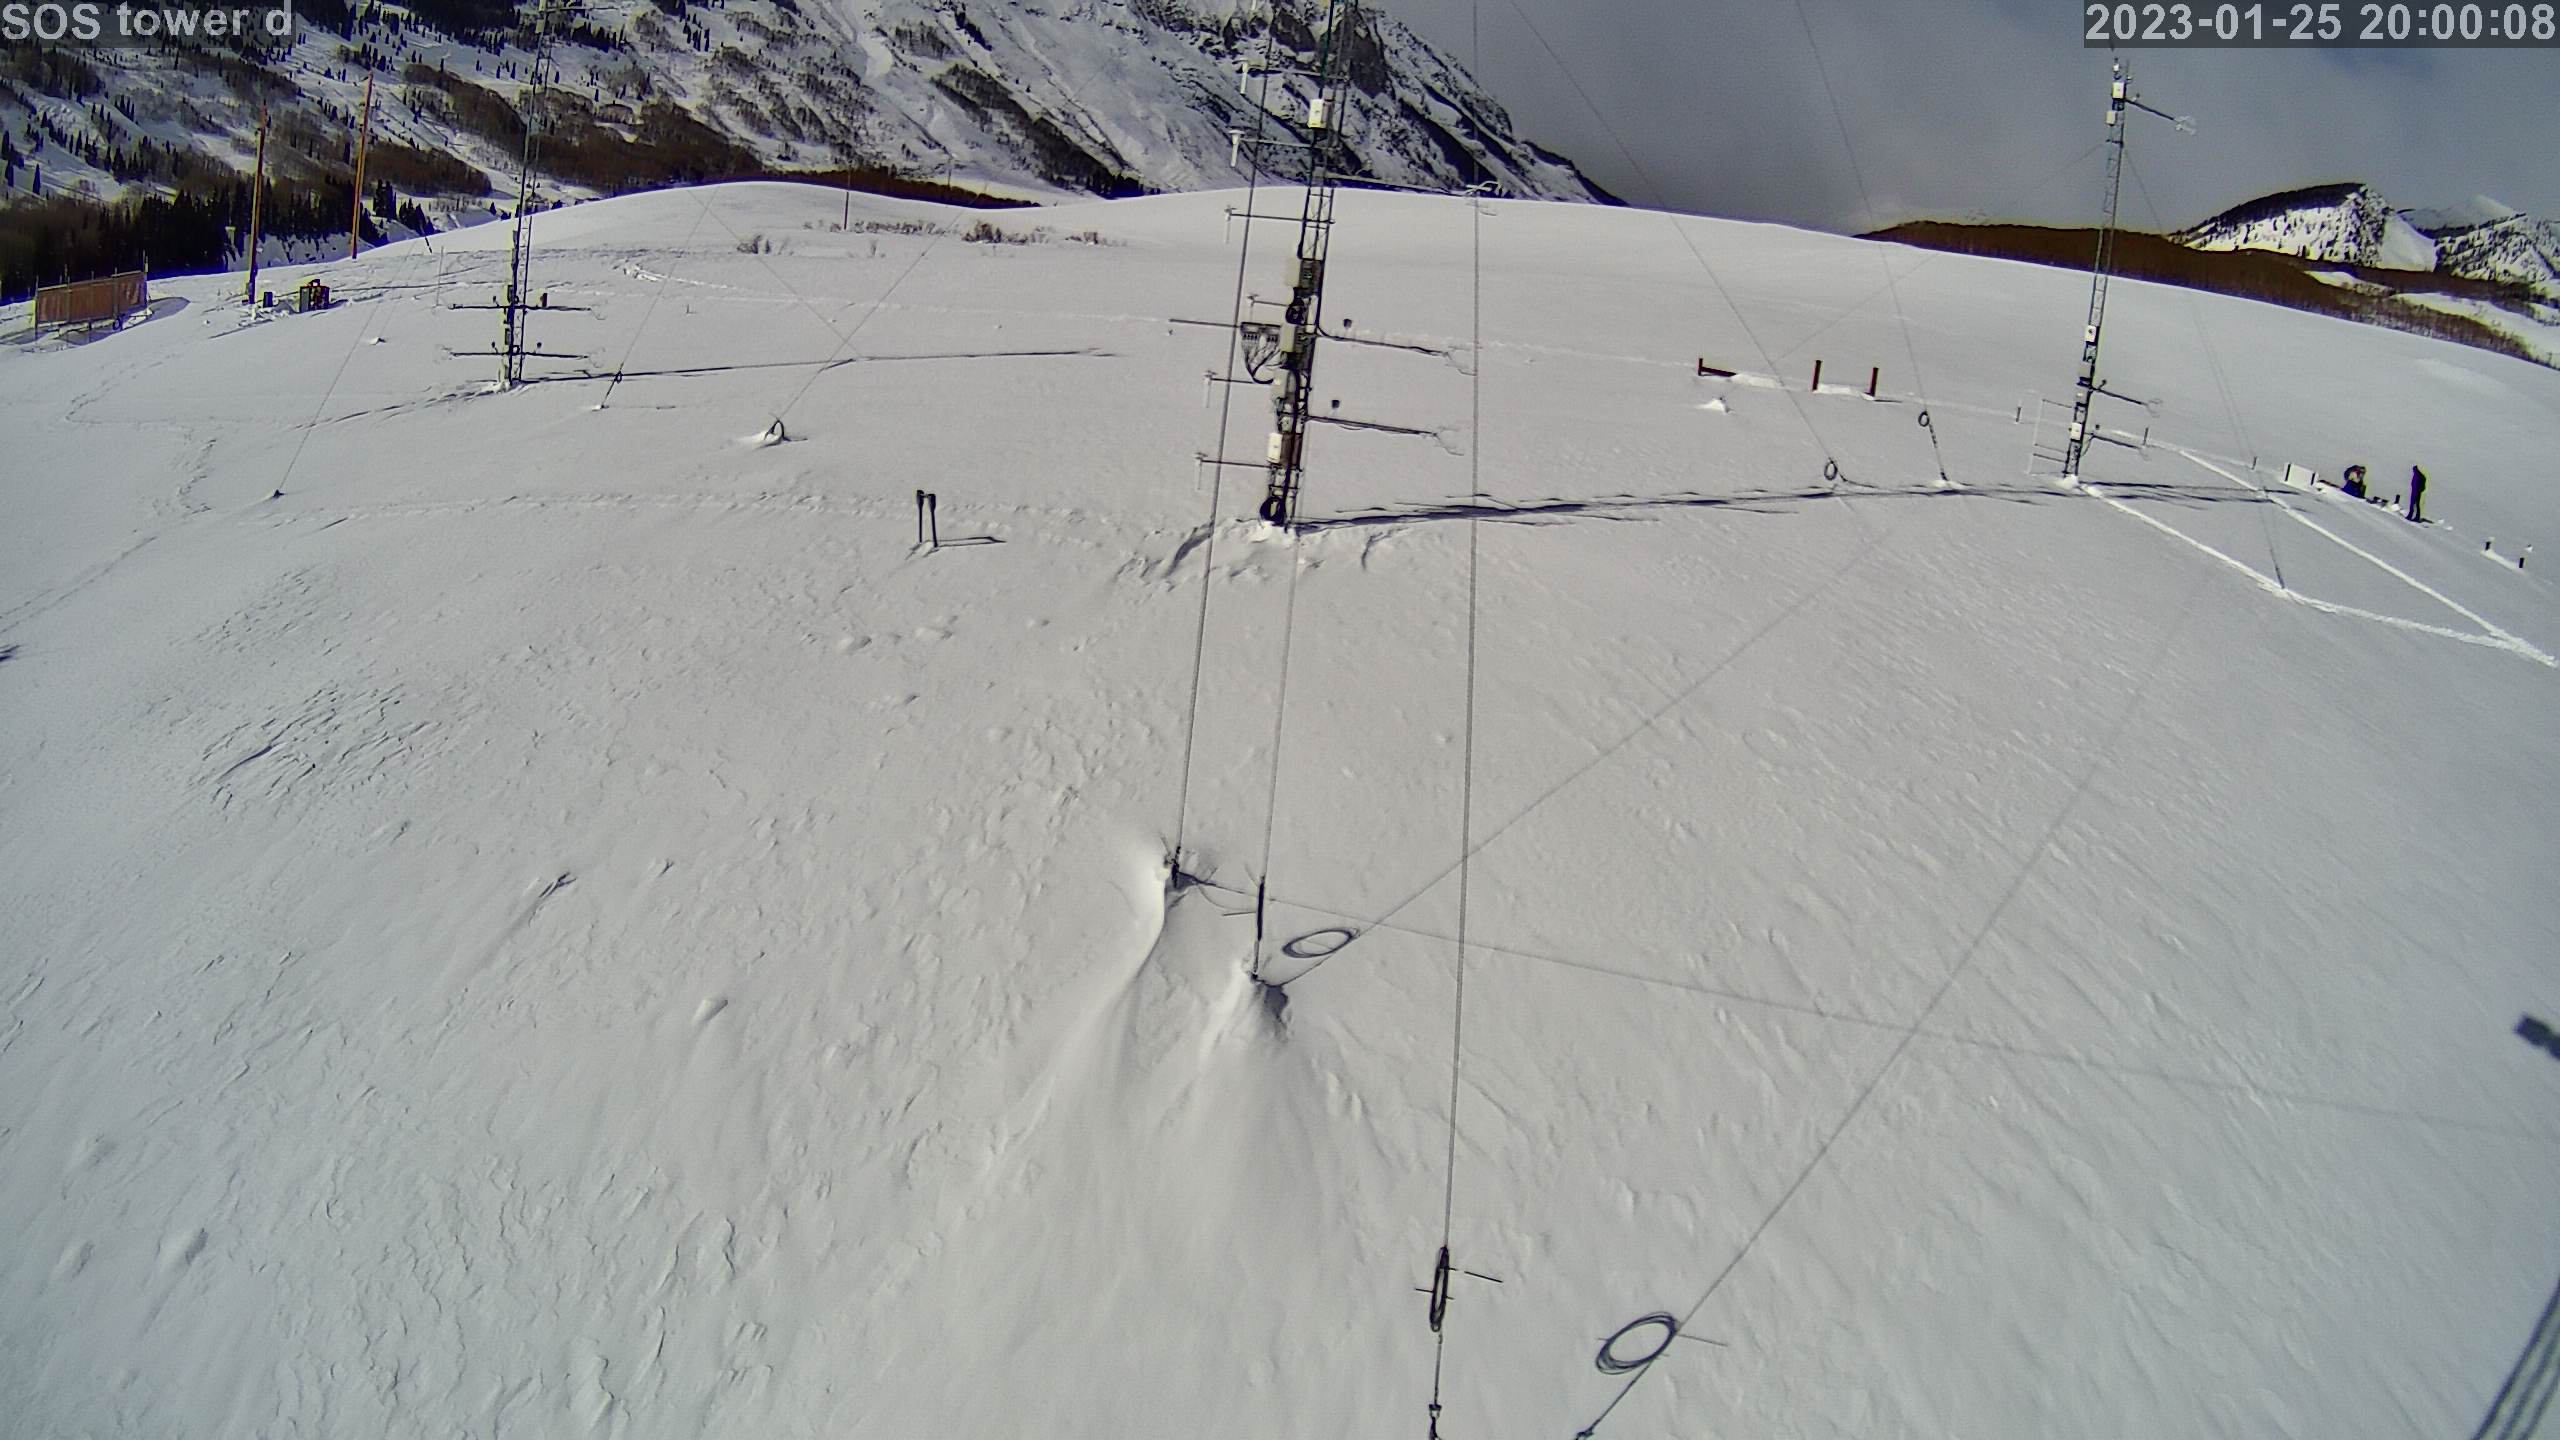
|
photo 2023012521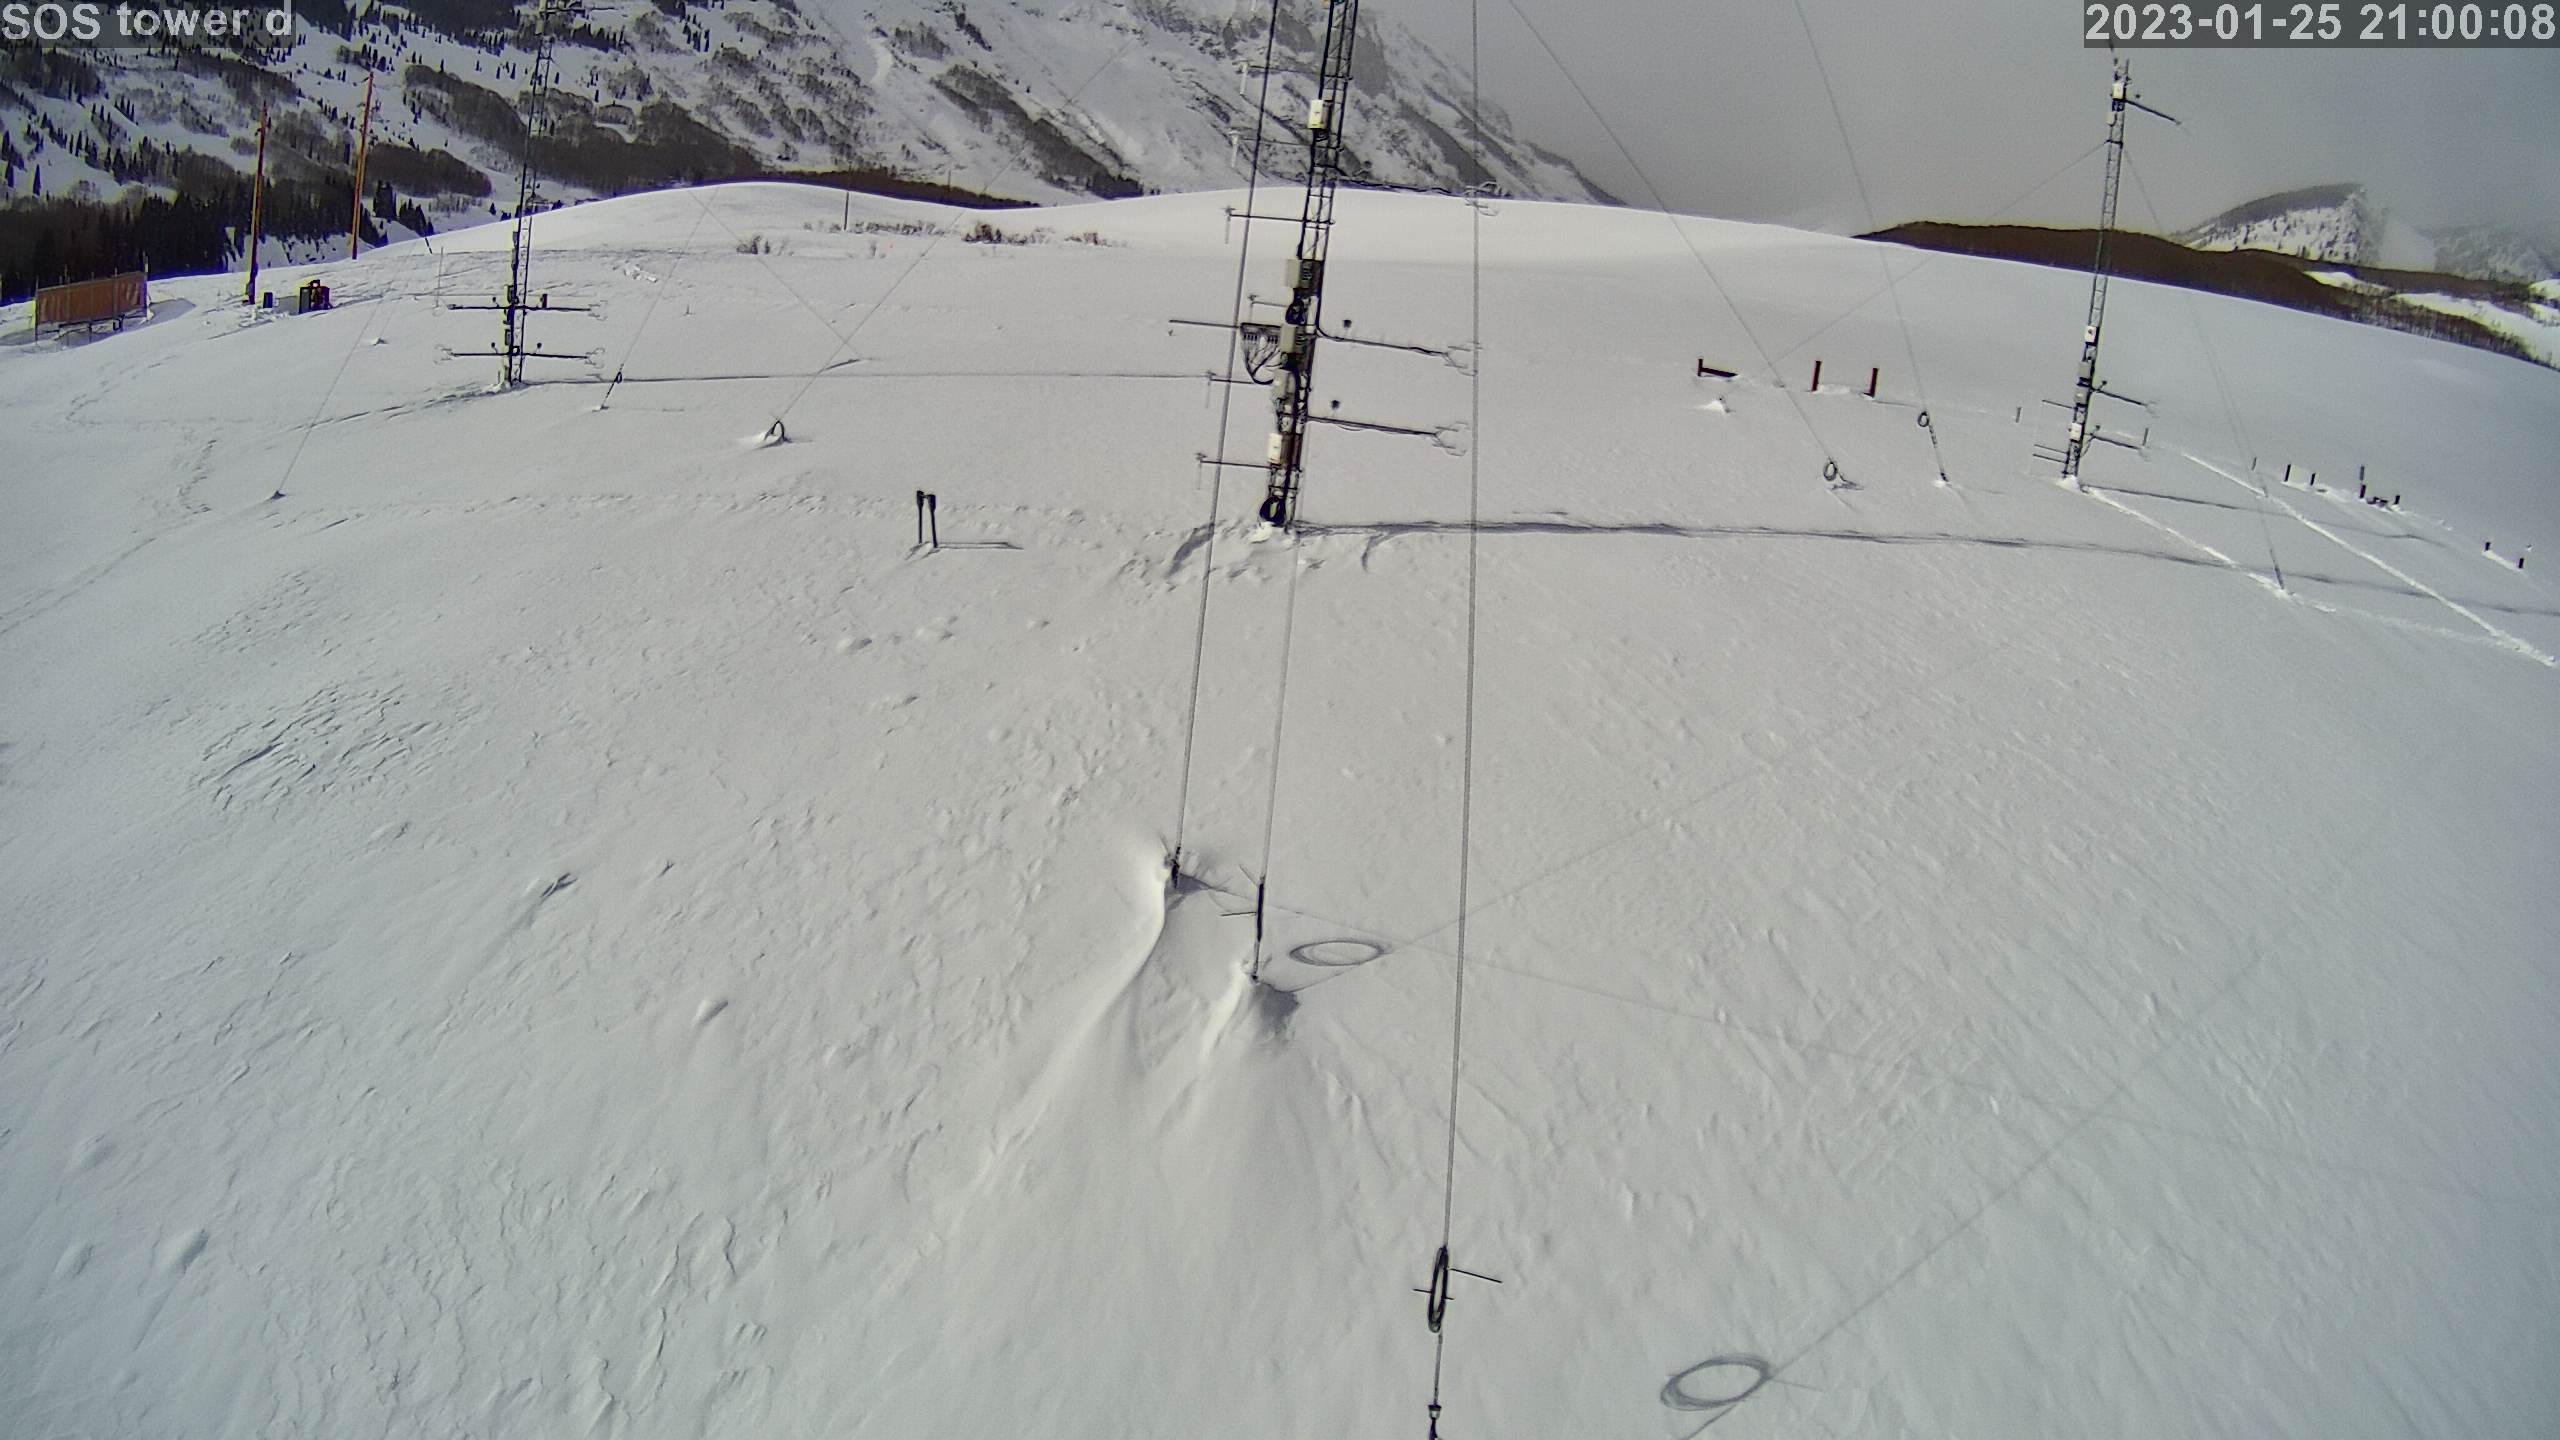
|
photo 2023012522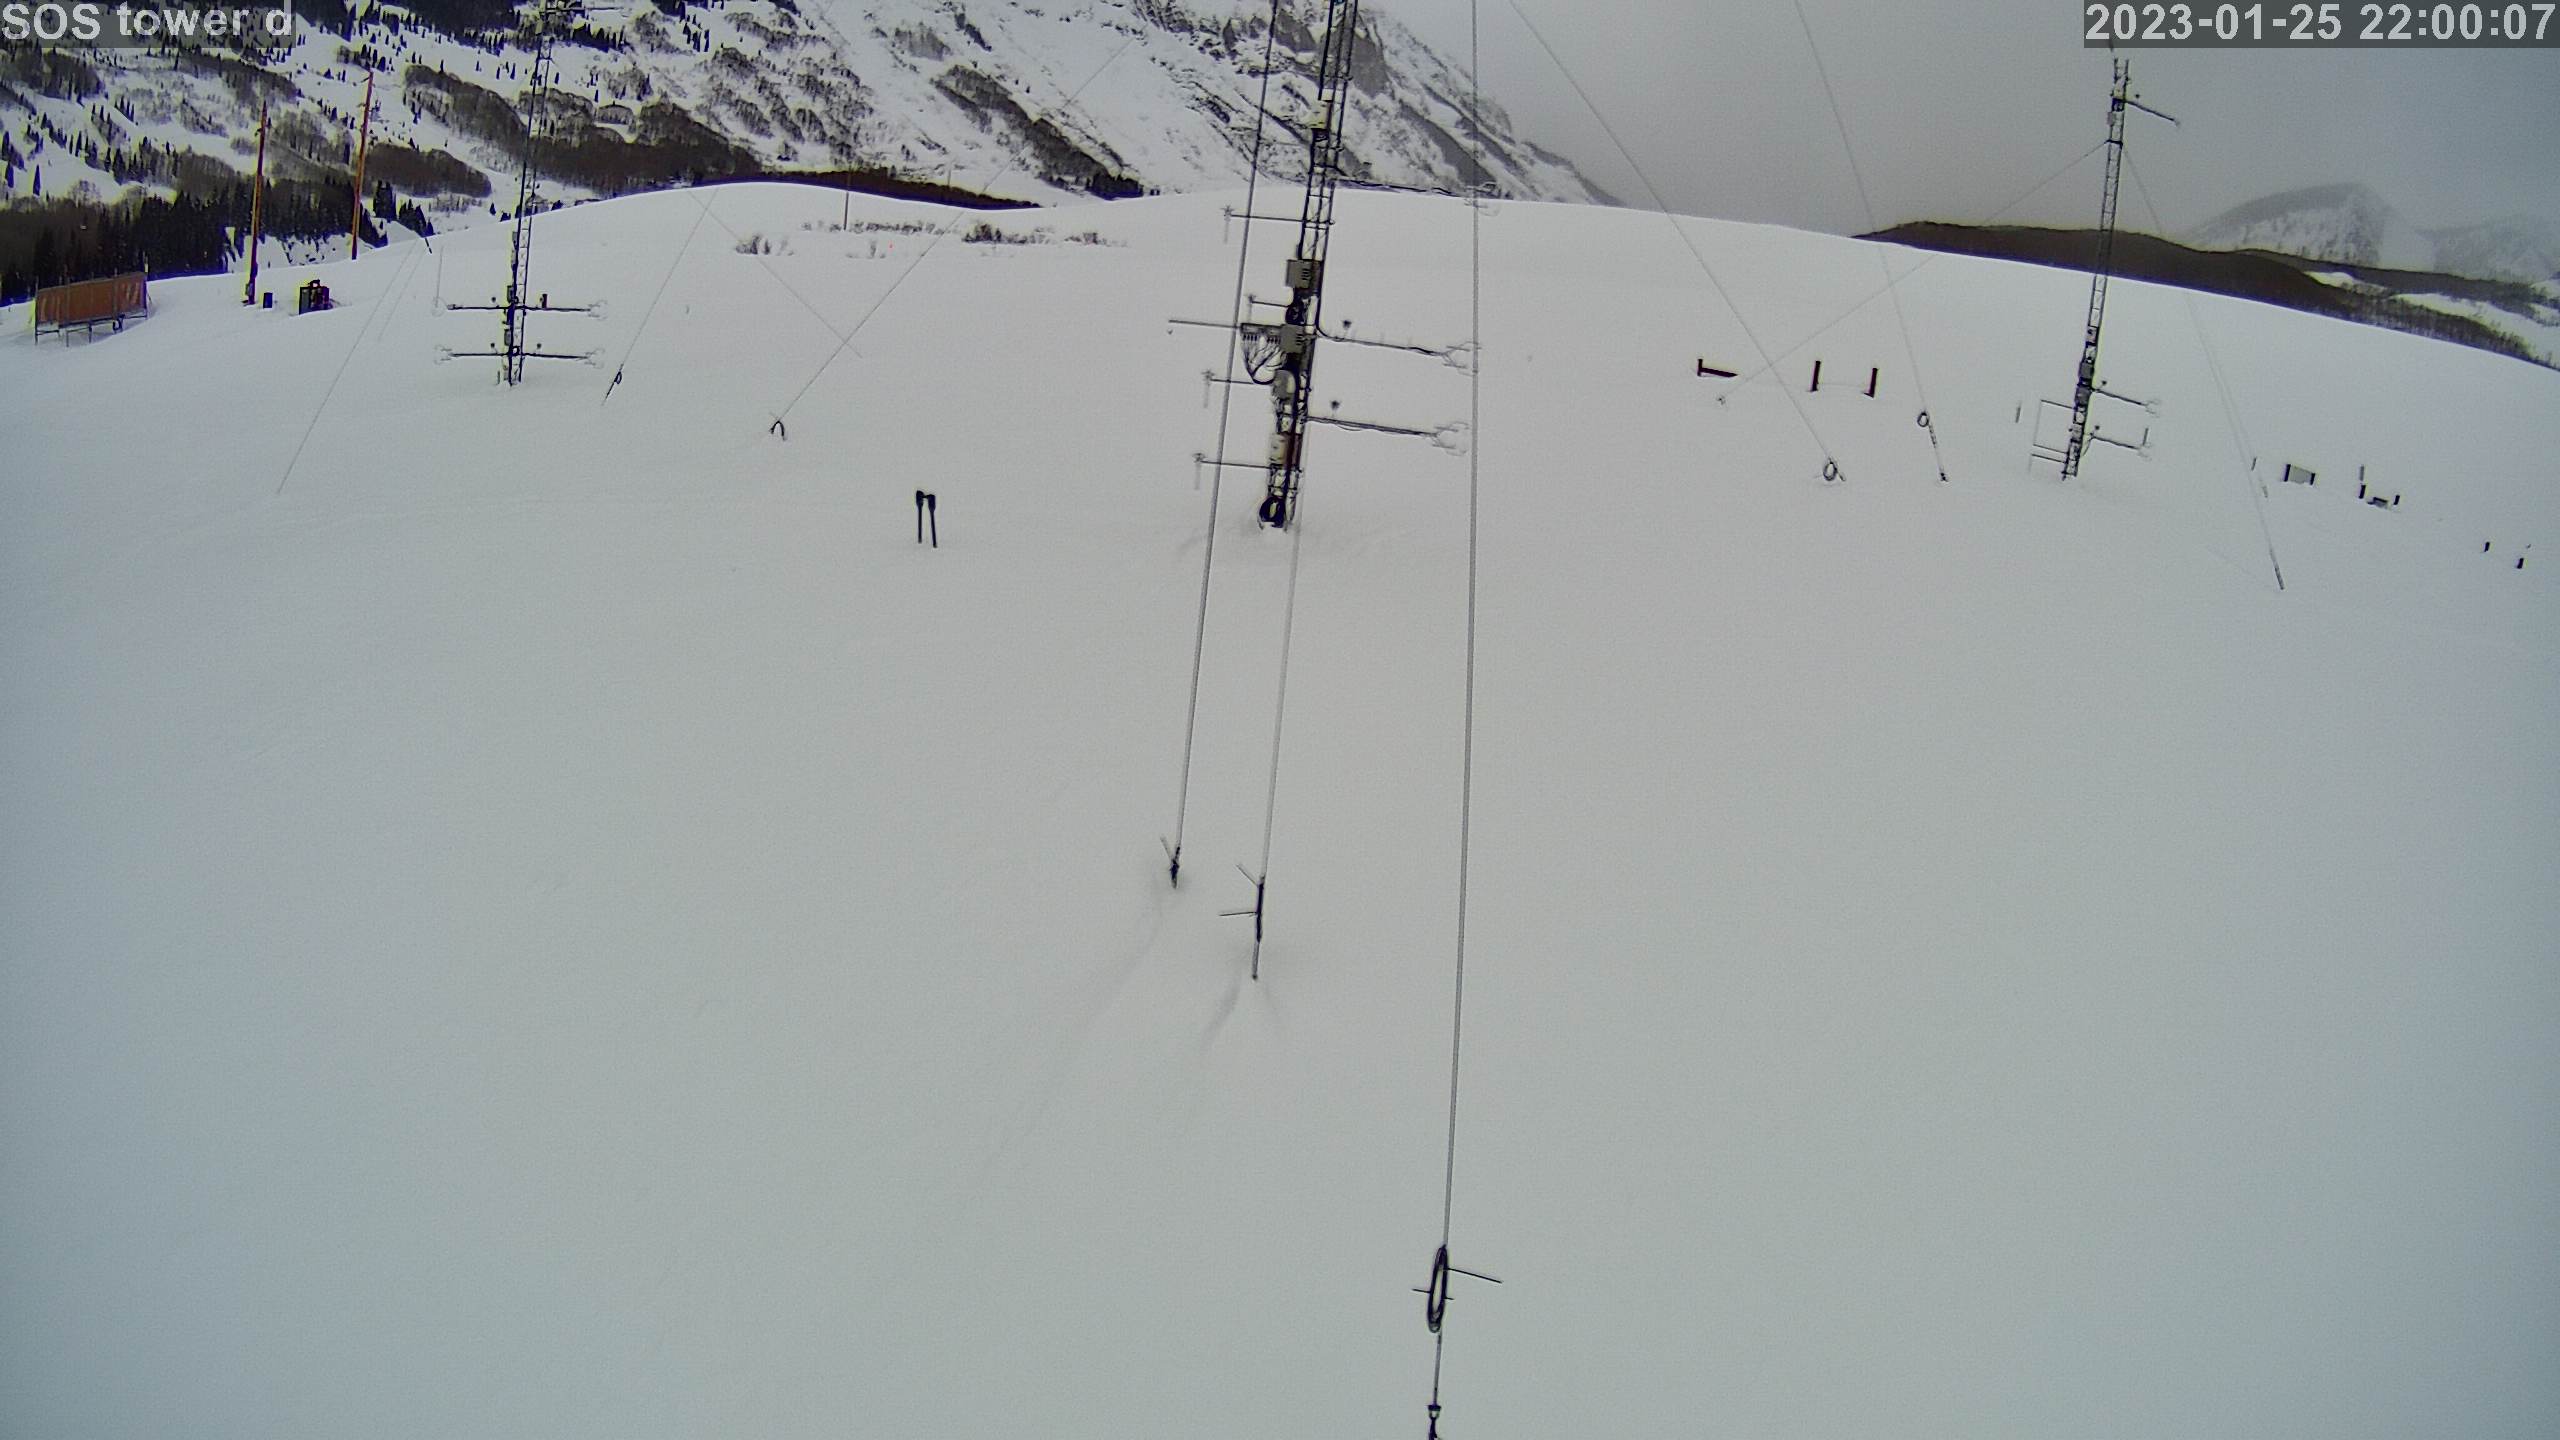
|
photo 2023012523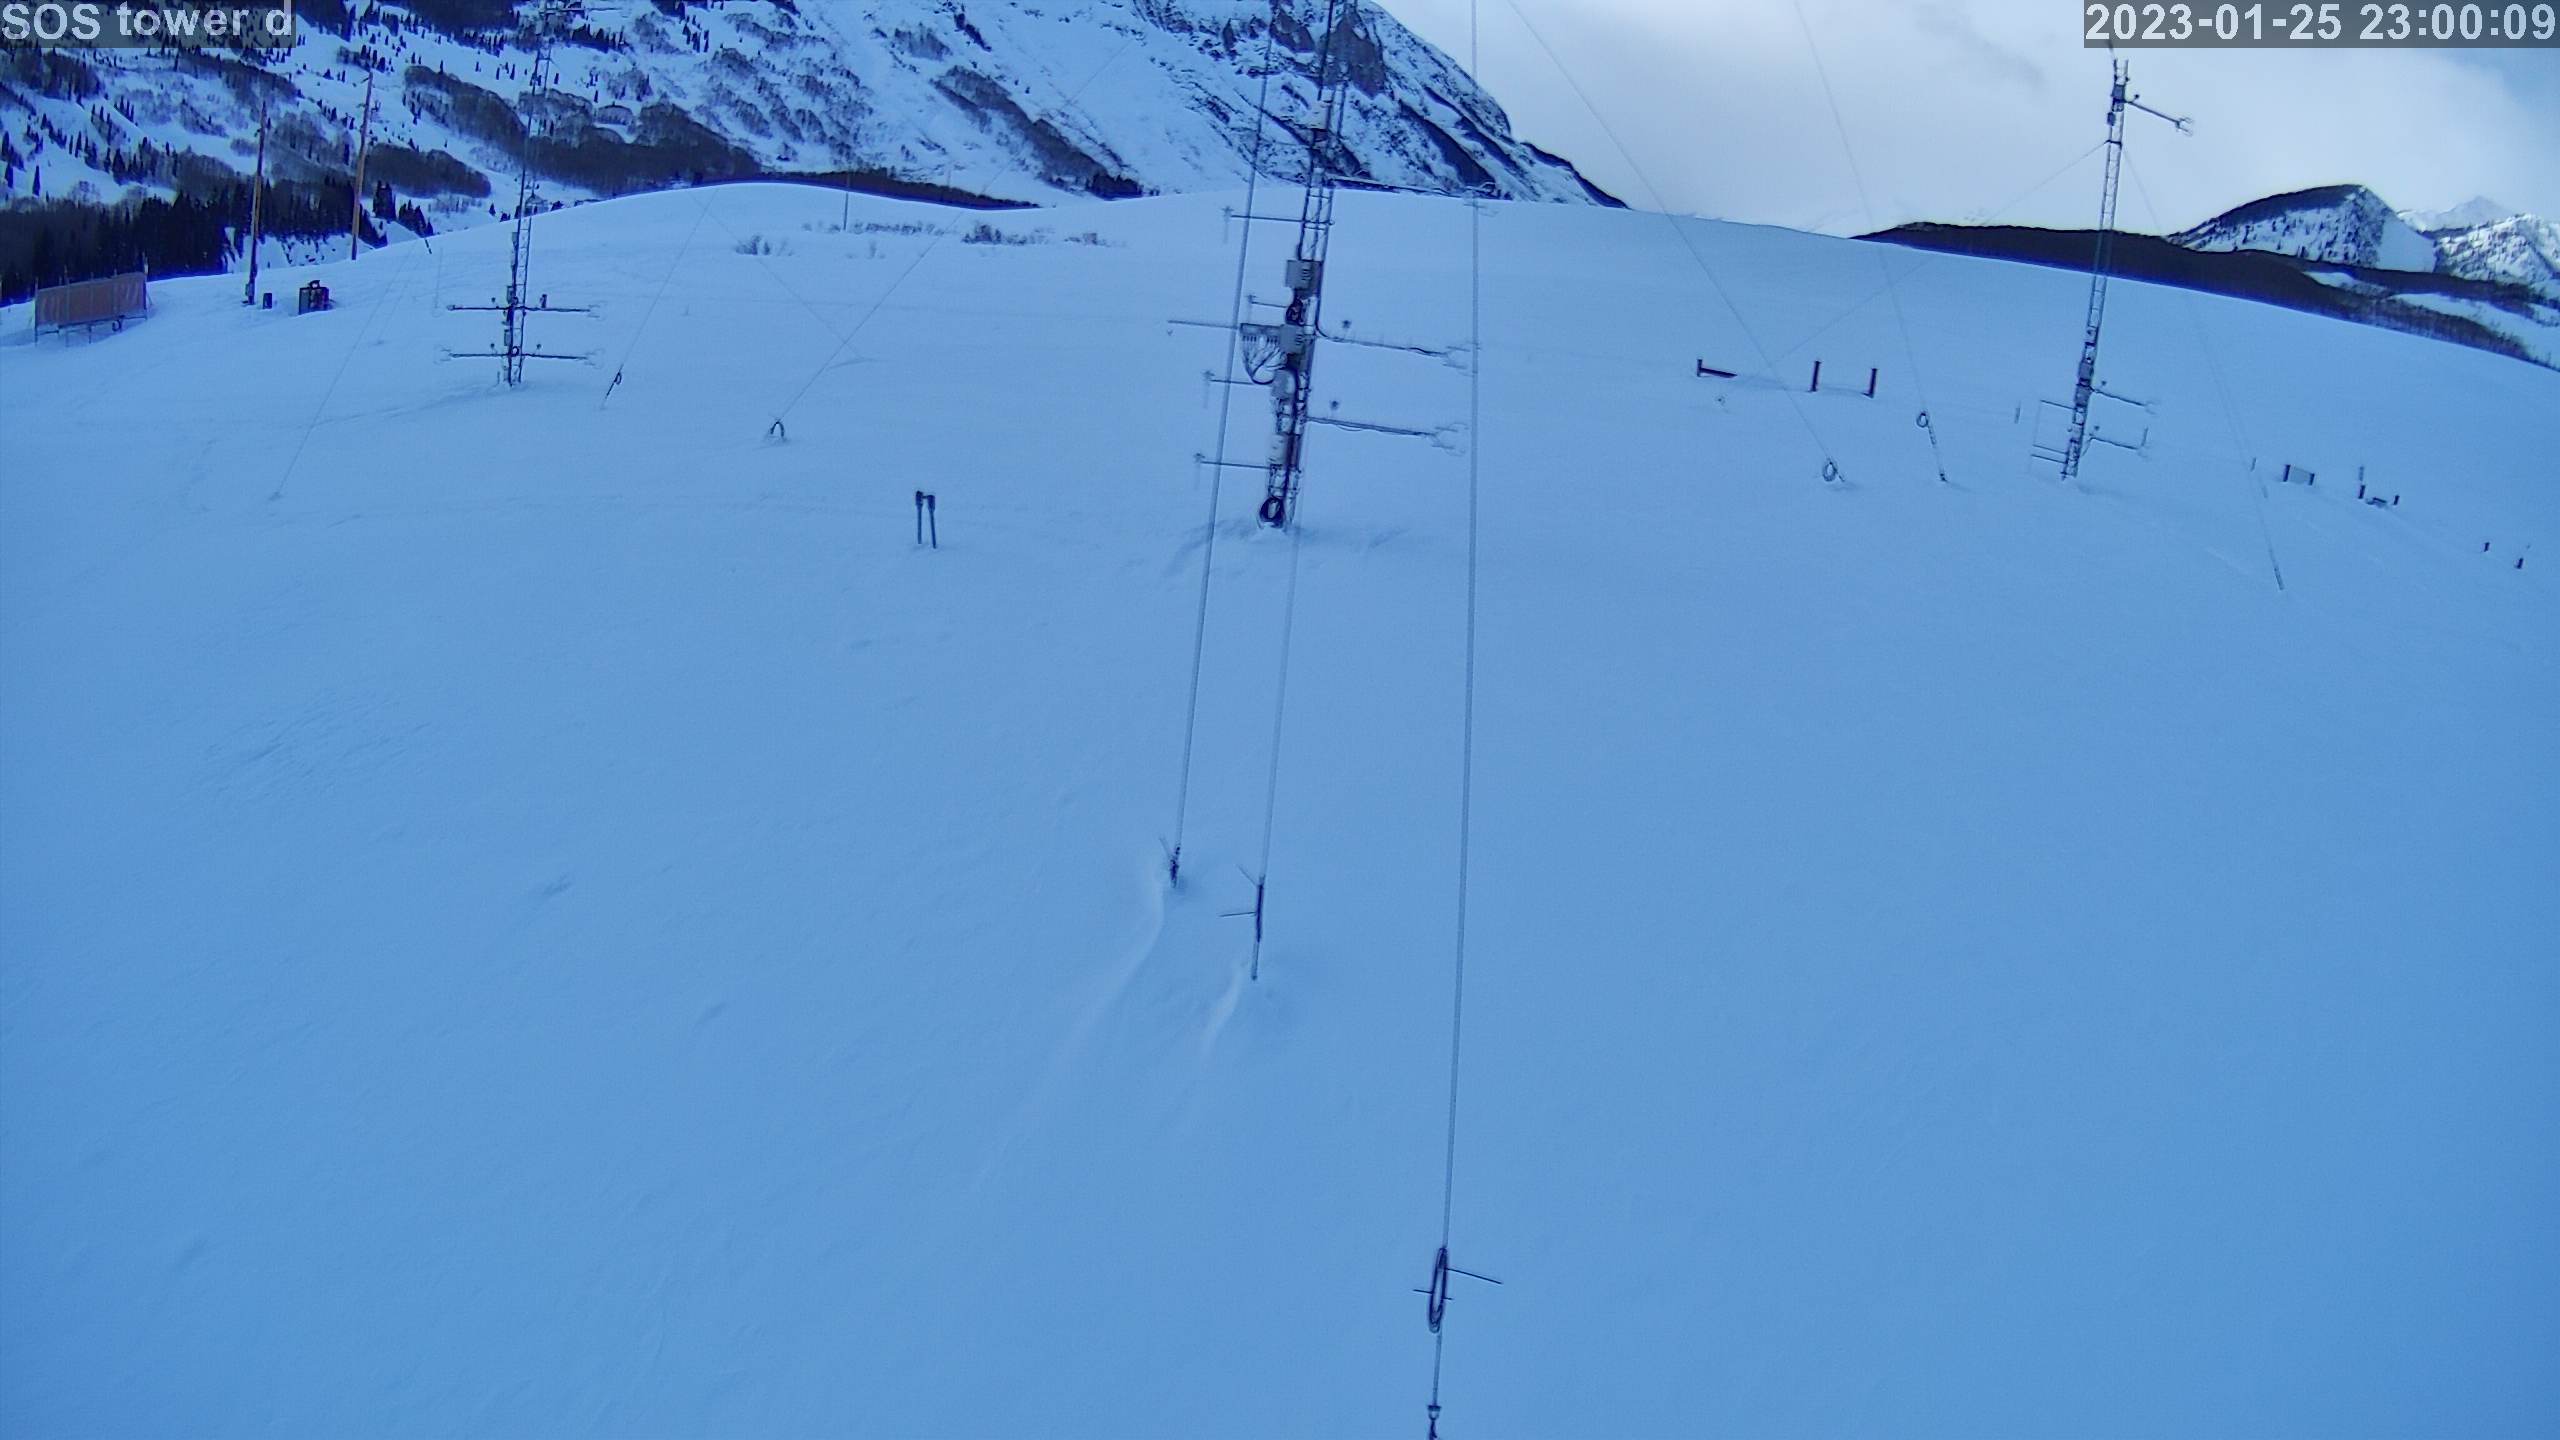
|