| Previous day | Select day | Next day |
The most recent plots are generally updated every 15 minutes. Use the browser reload button to make sure you are seeing the latest version of a plot.
In order to distinquish the traces on the vertical profile plots, a slight offset in X is added to some traces. This is indicated by a "(n)" in the legend for the trace.
If you right-click on an image, most browsers will provide a menu to download or display the plot in another window.
photo 202211100002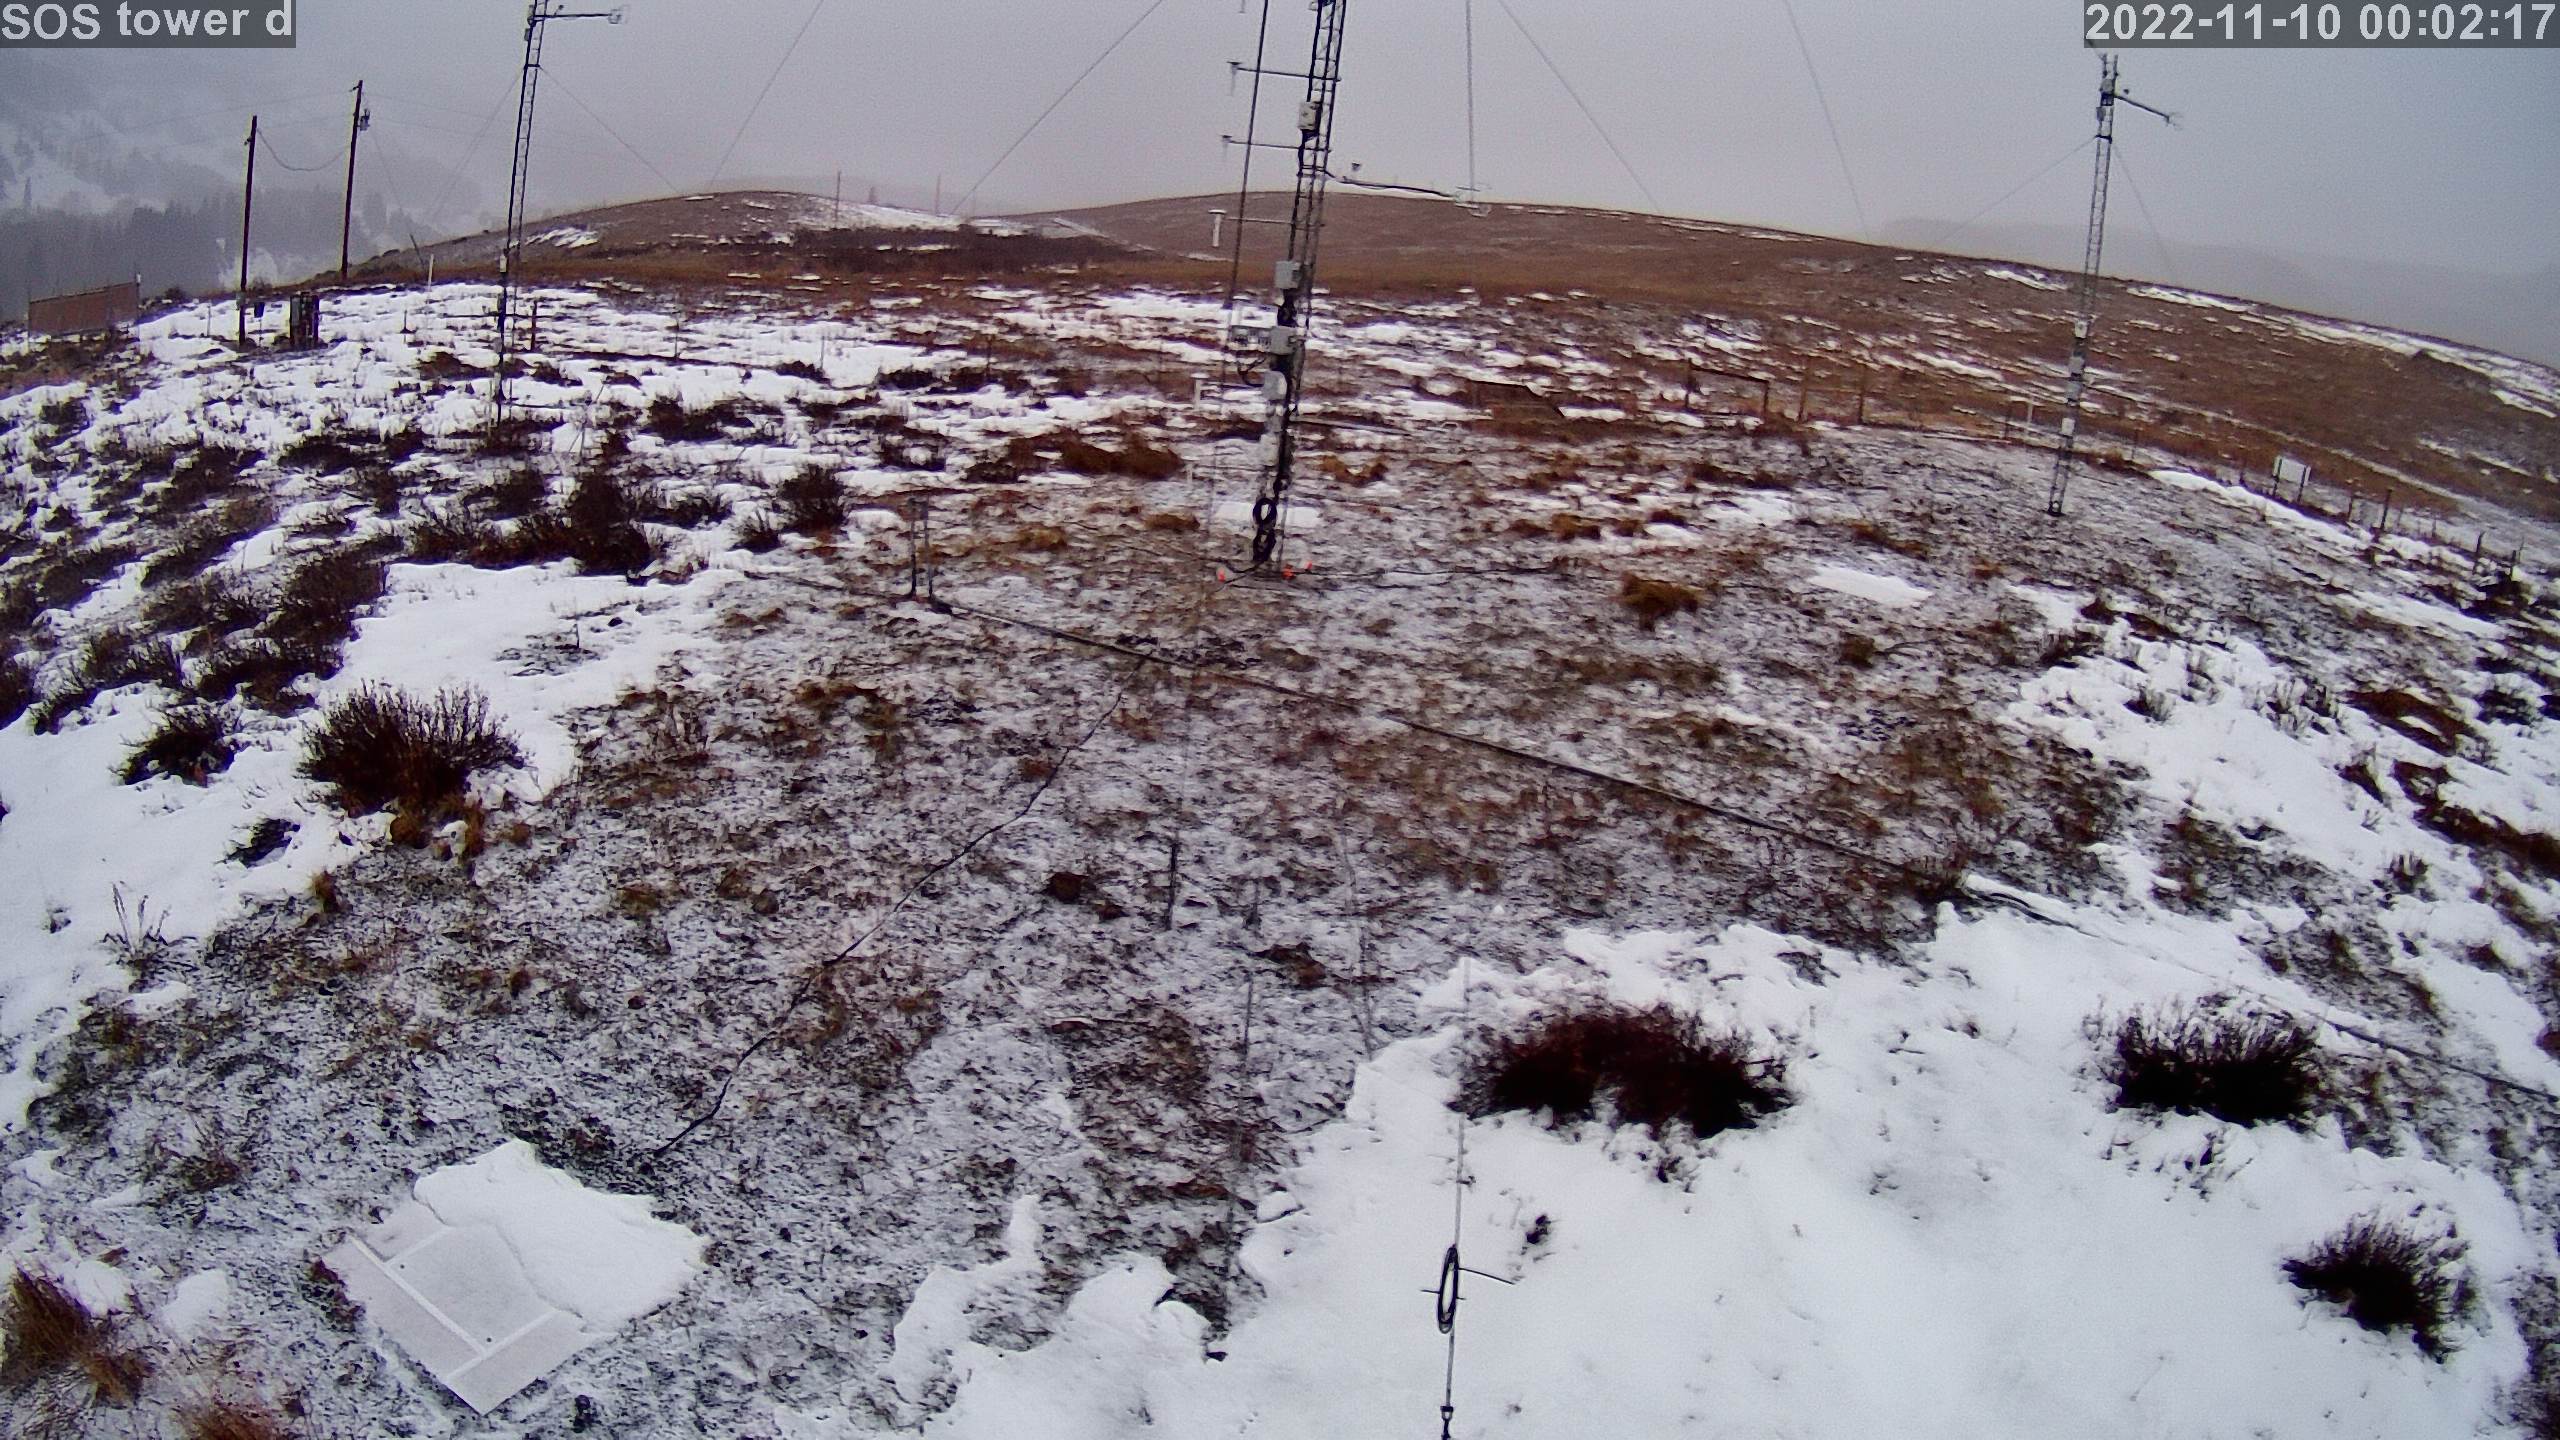
|
photo 202211100102
|
photo 202211100202
|
photo 202211100302
|
photo 202211100402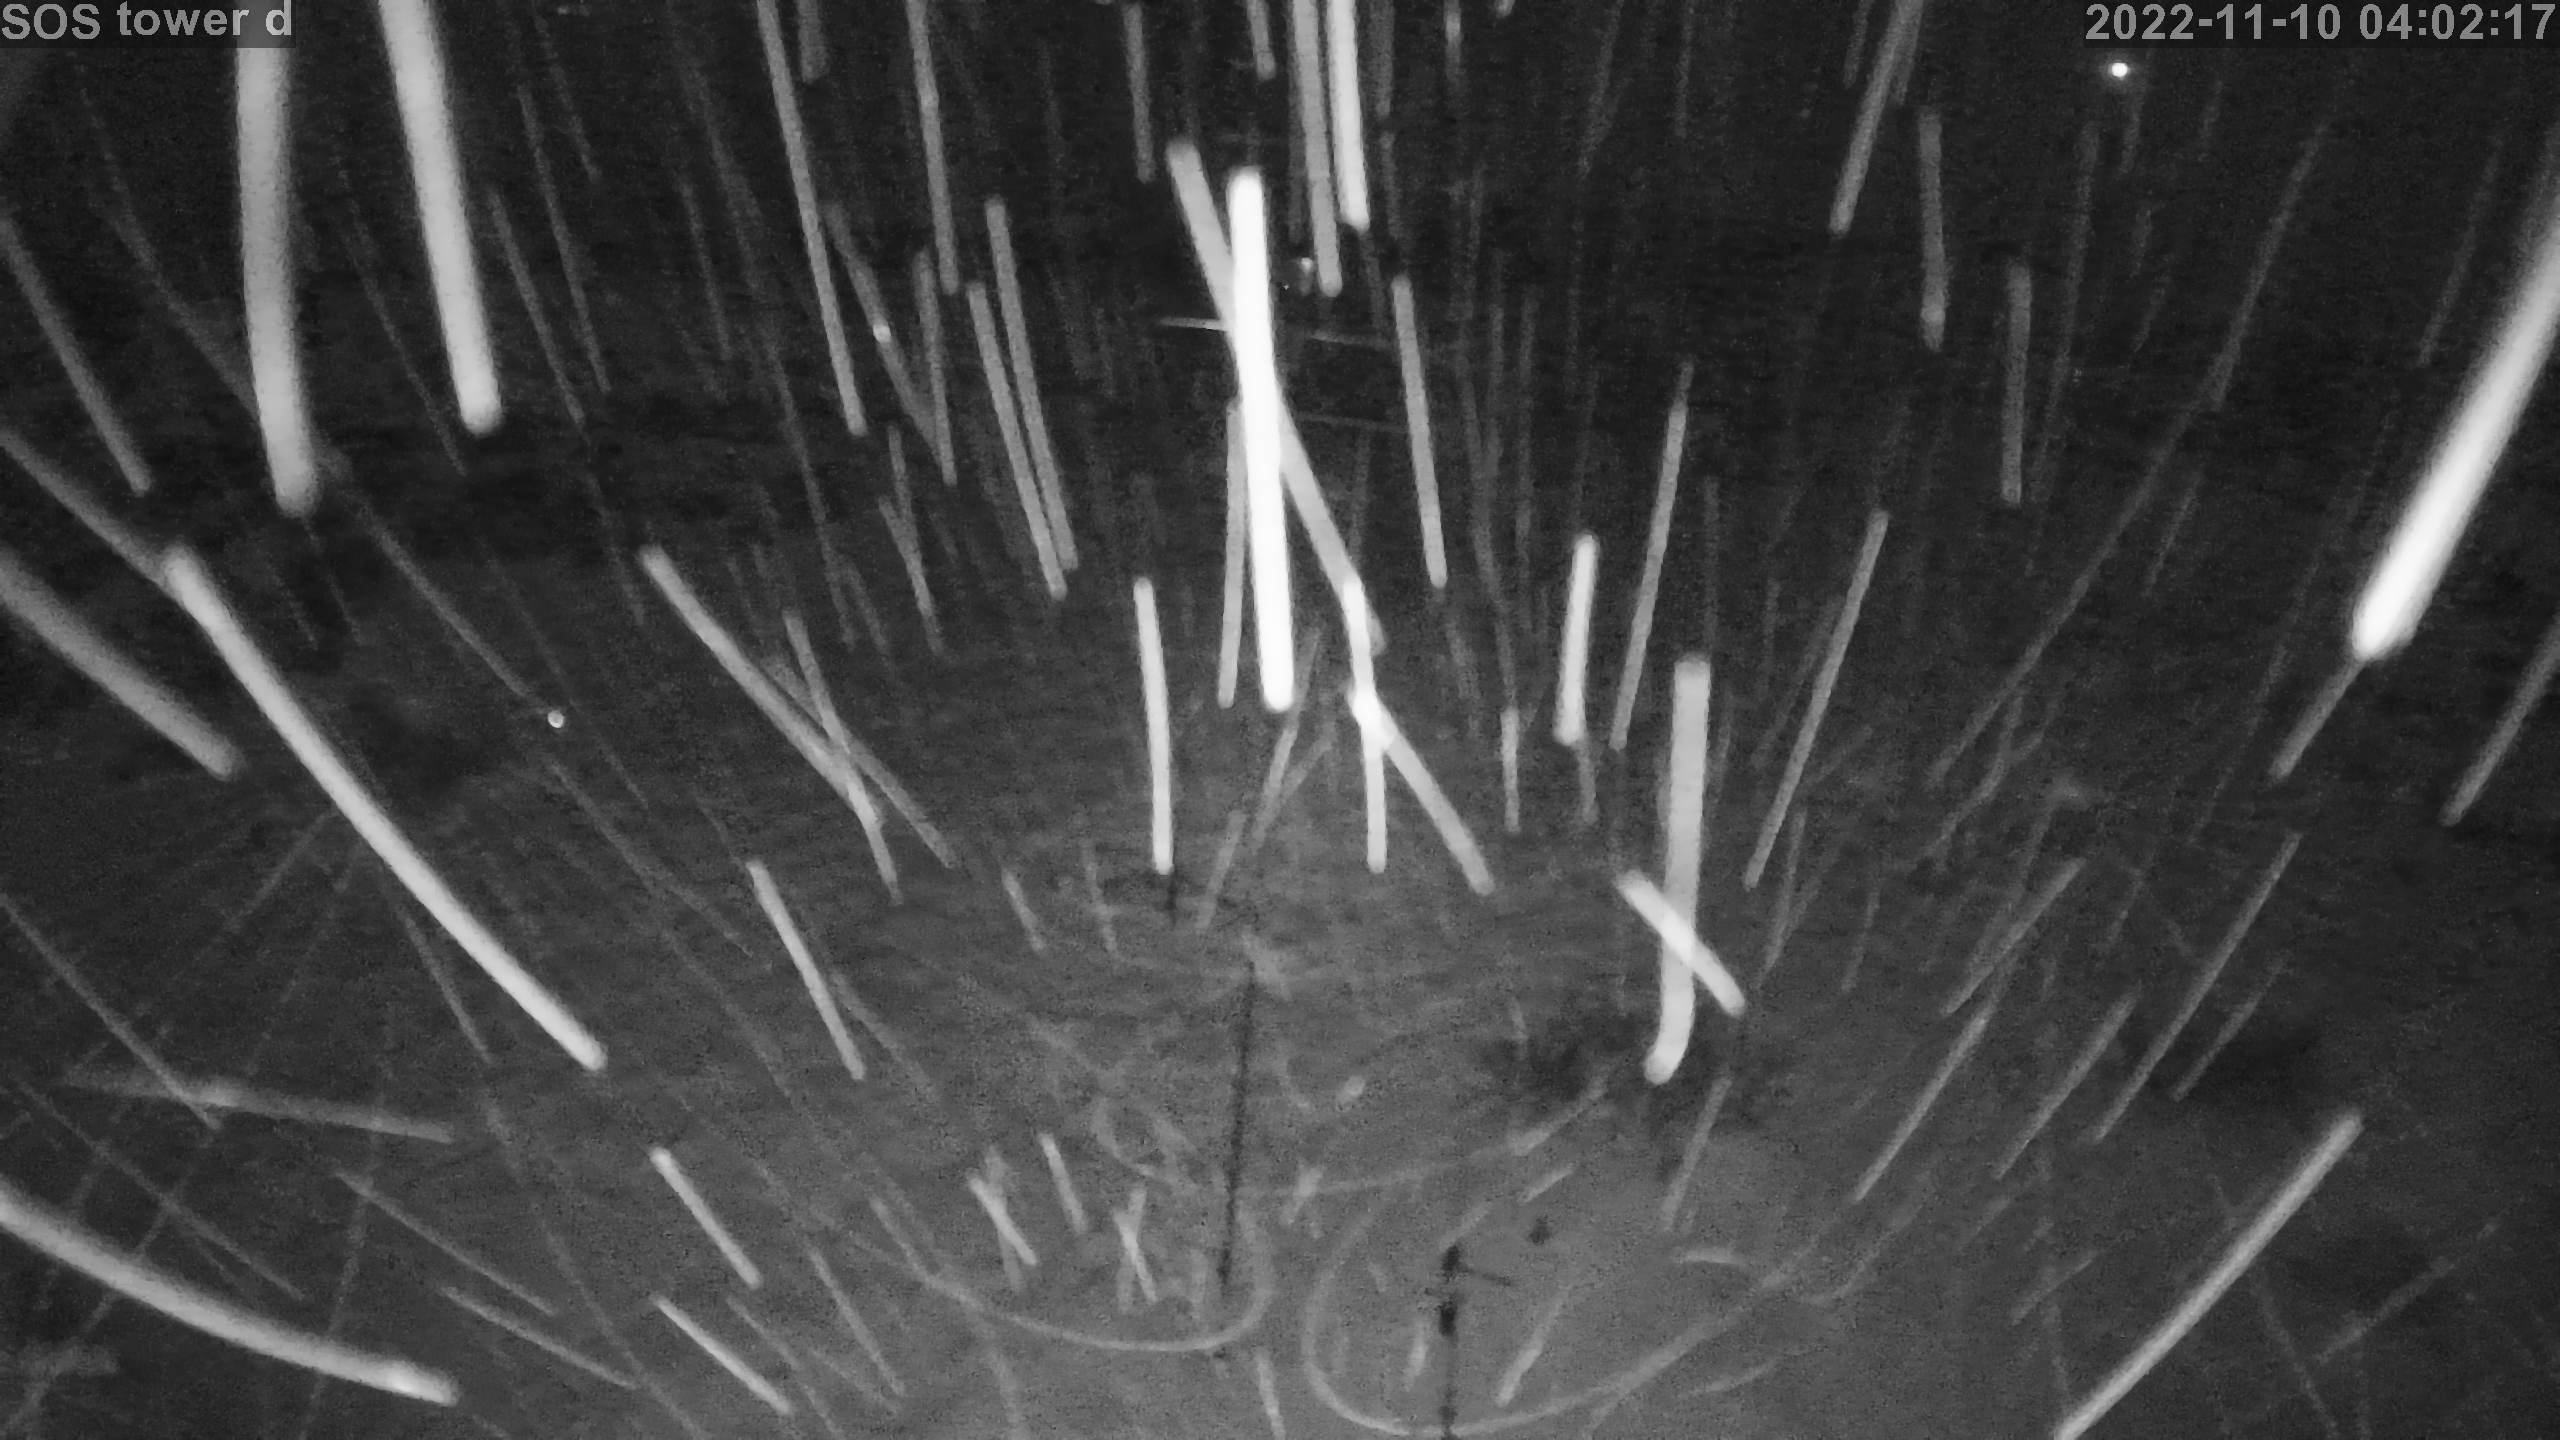
|
photo 202211100502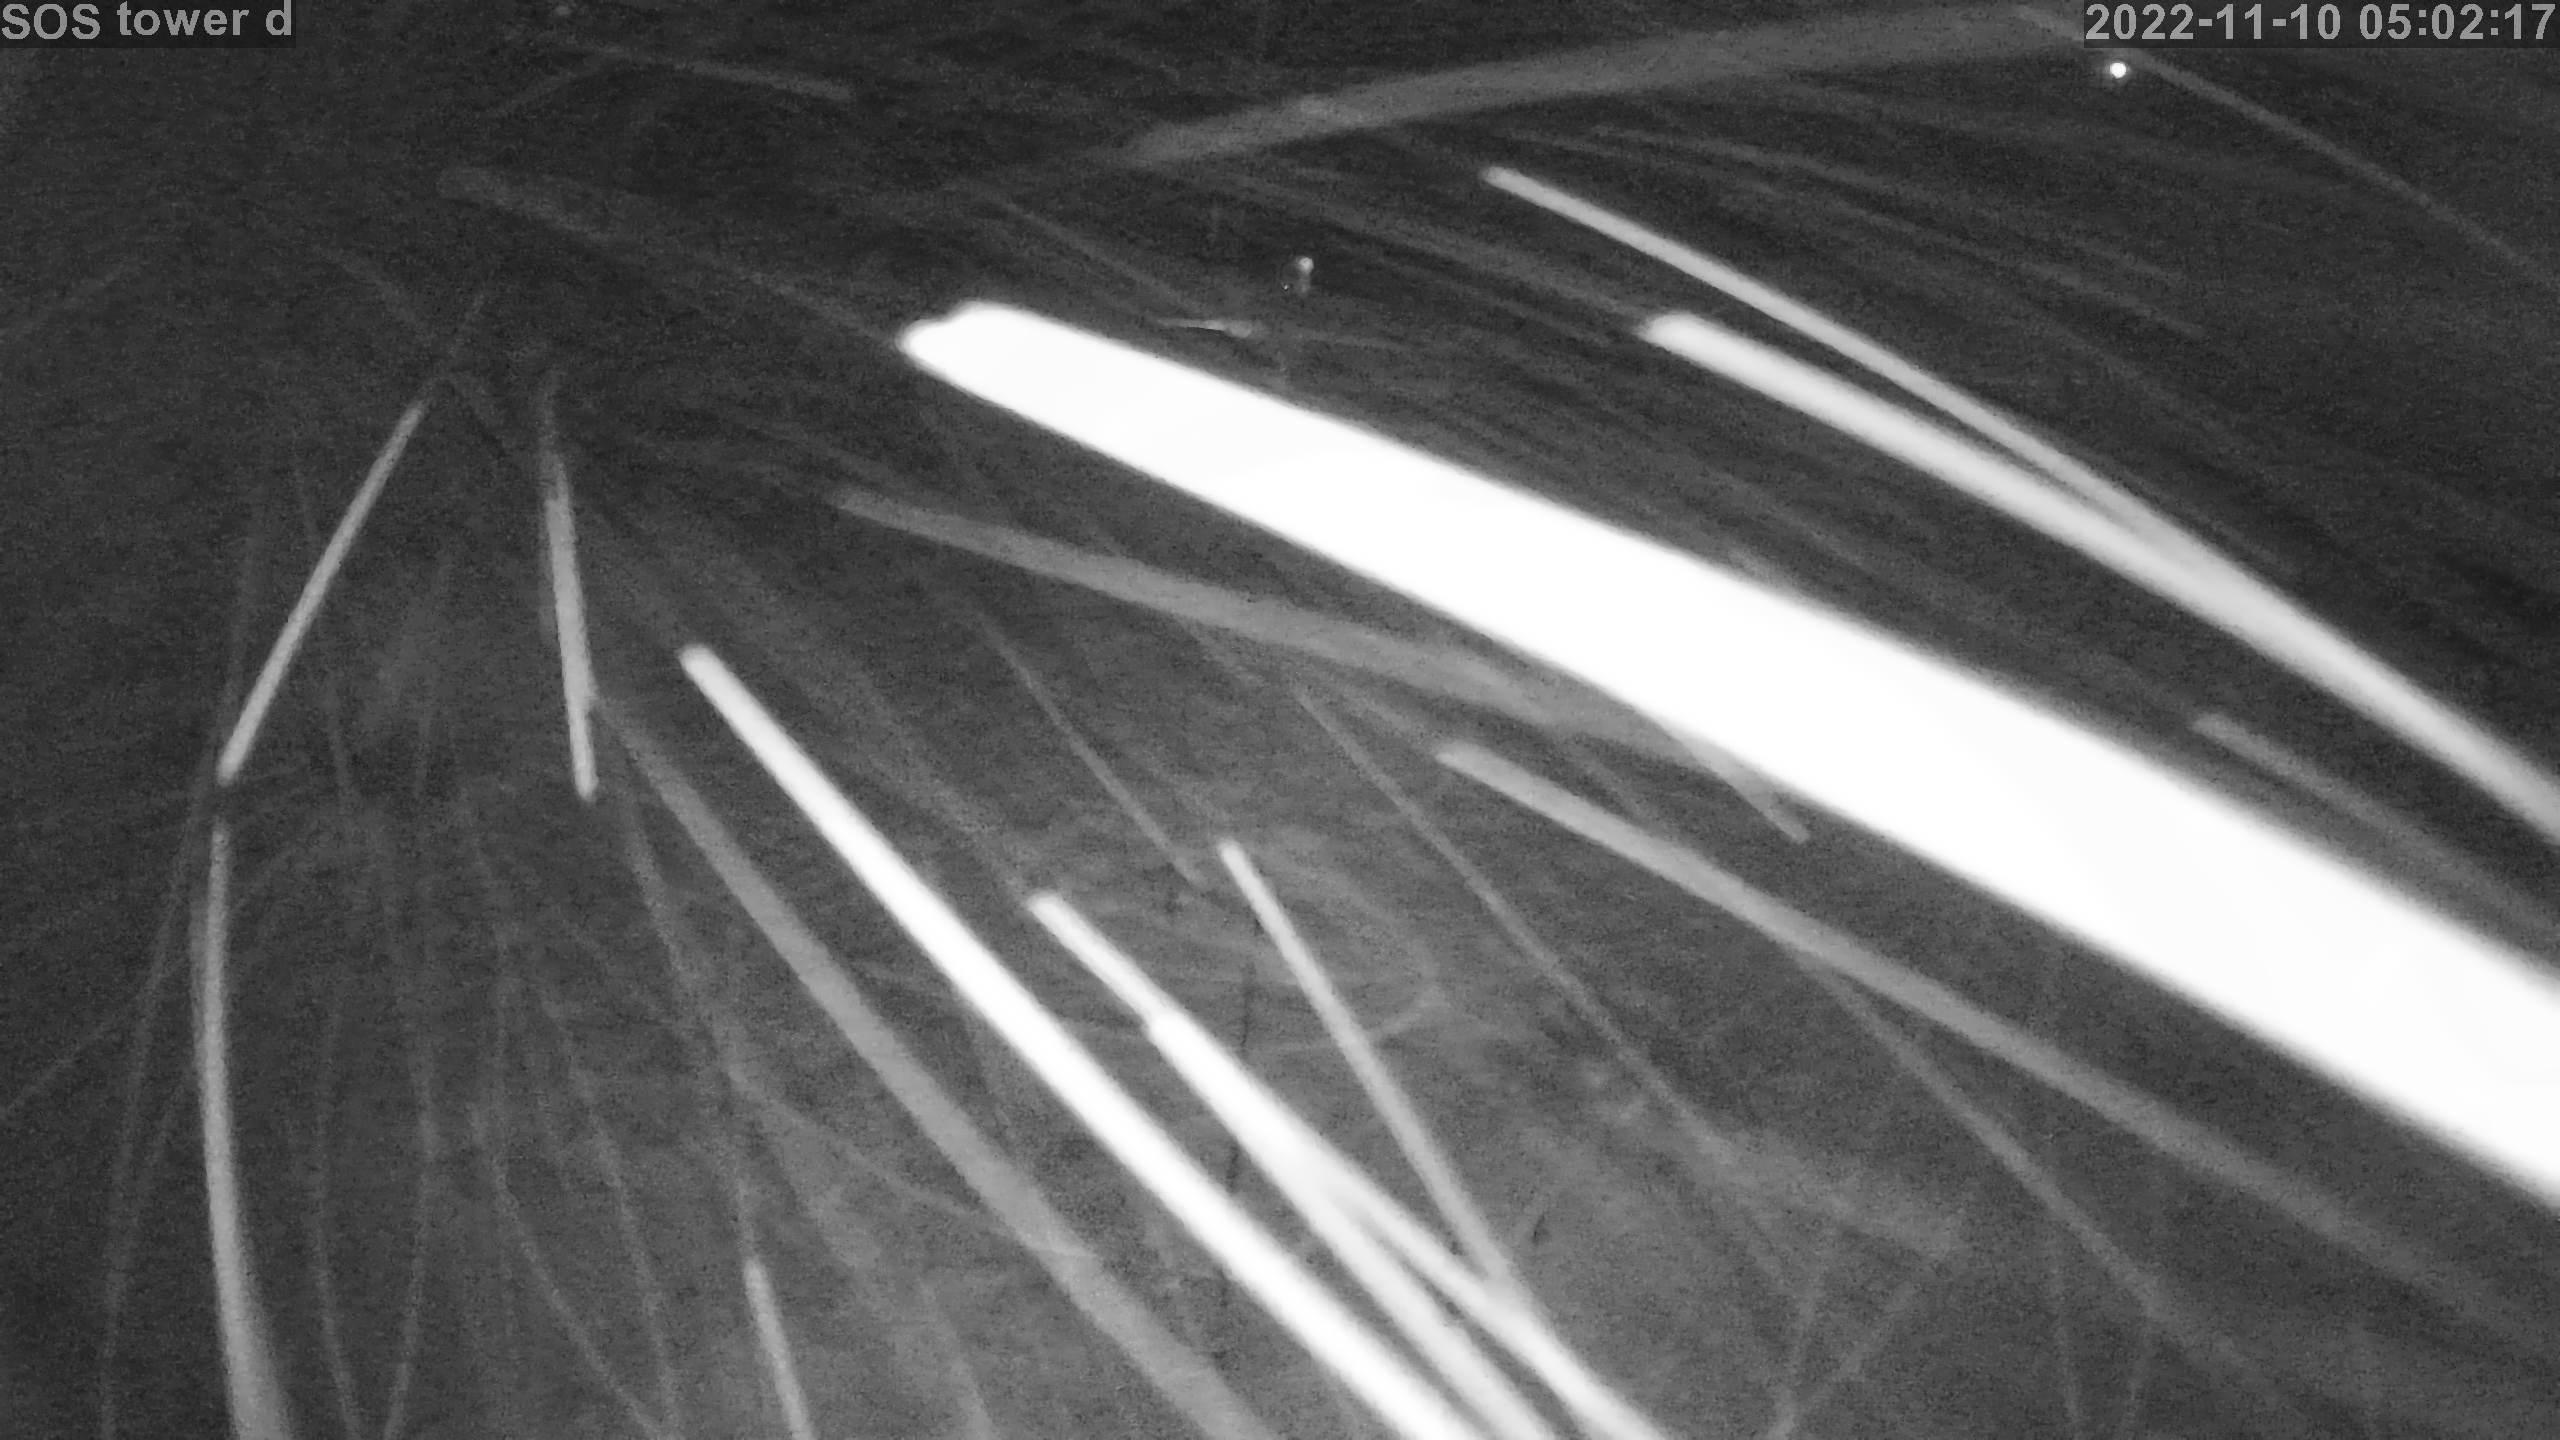
|
photo 202211100602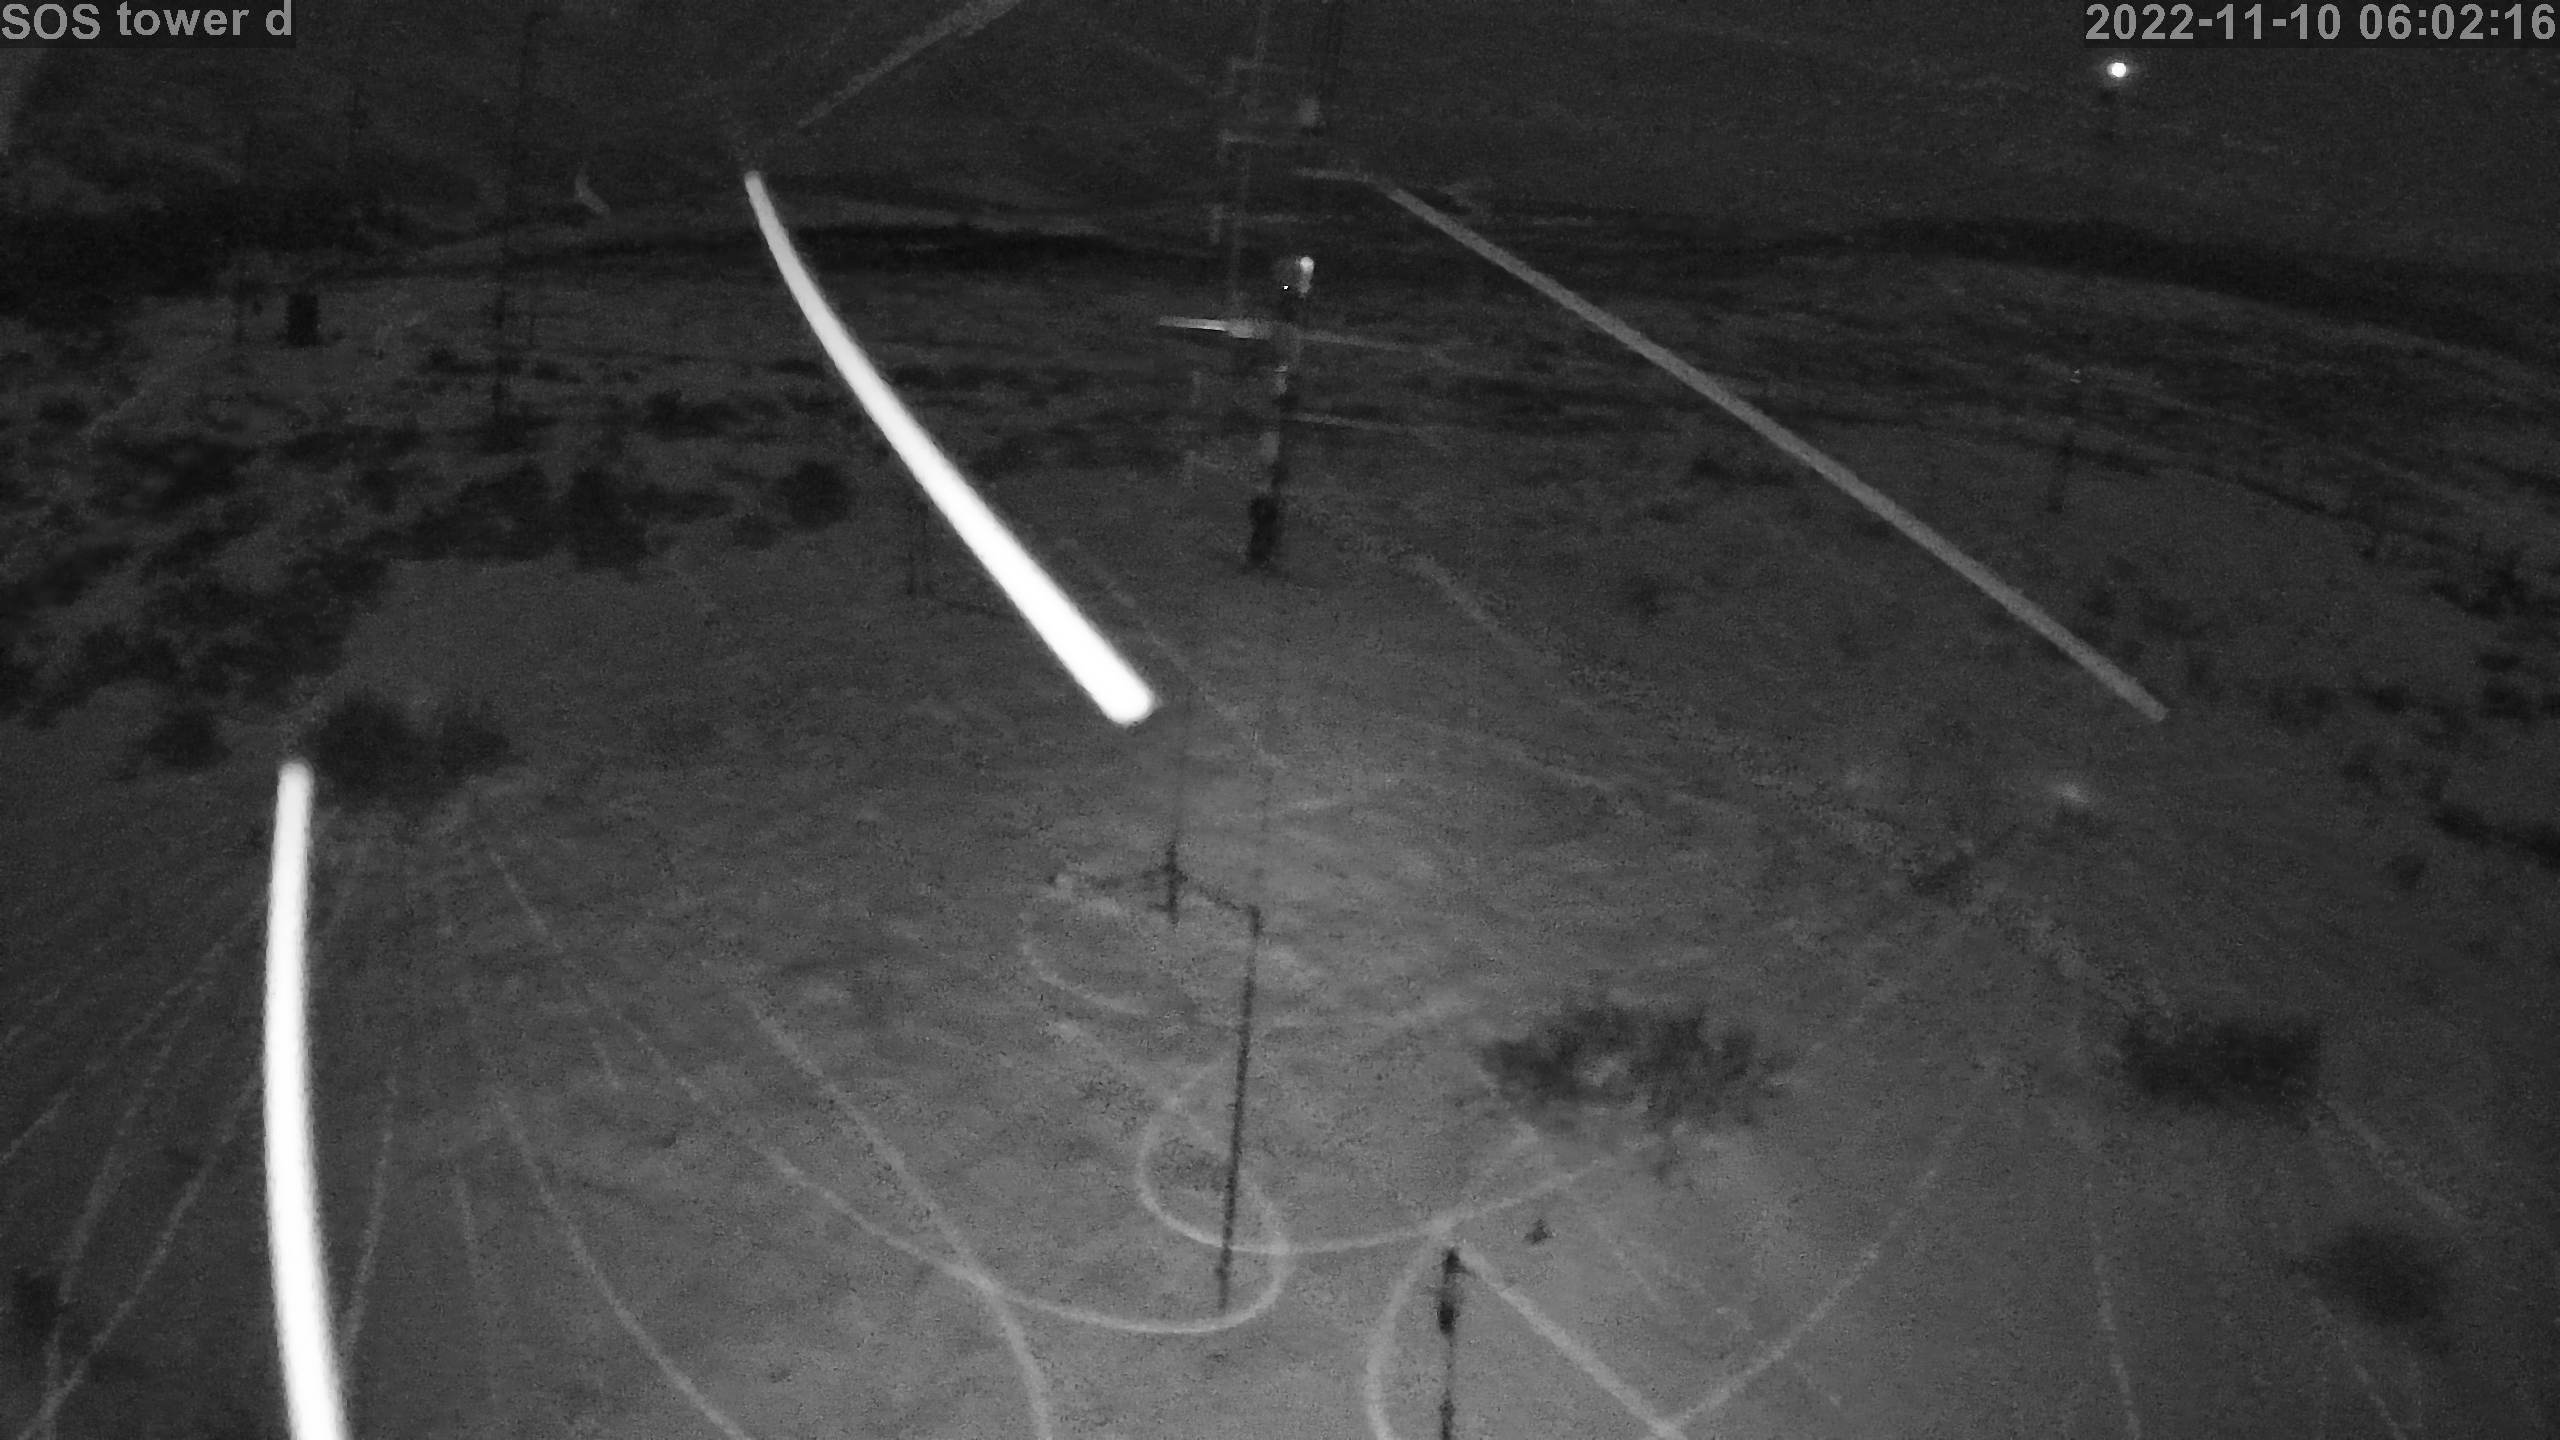
|
photo 202211100702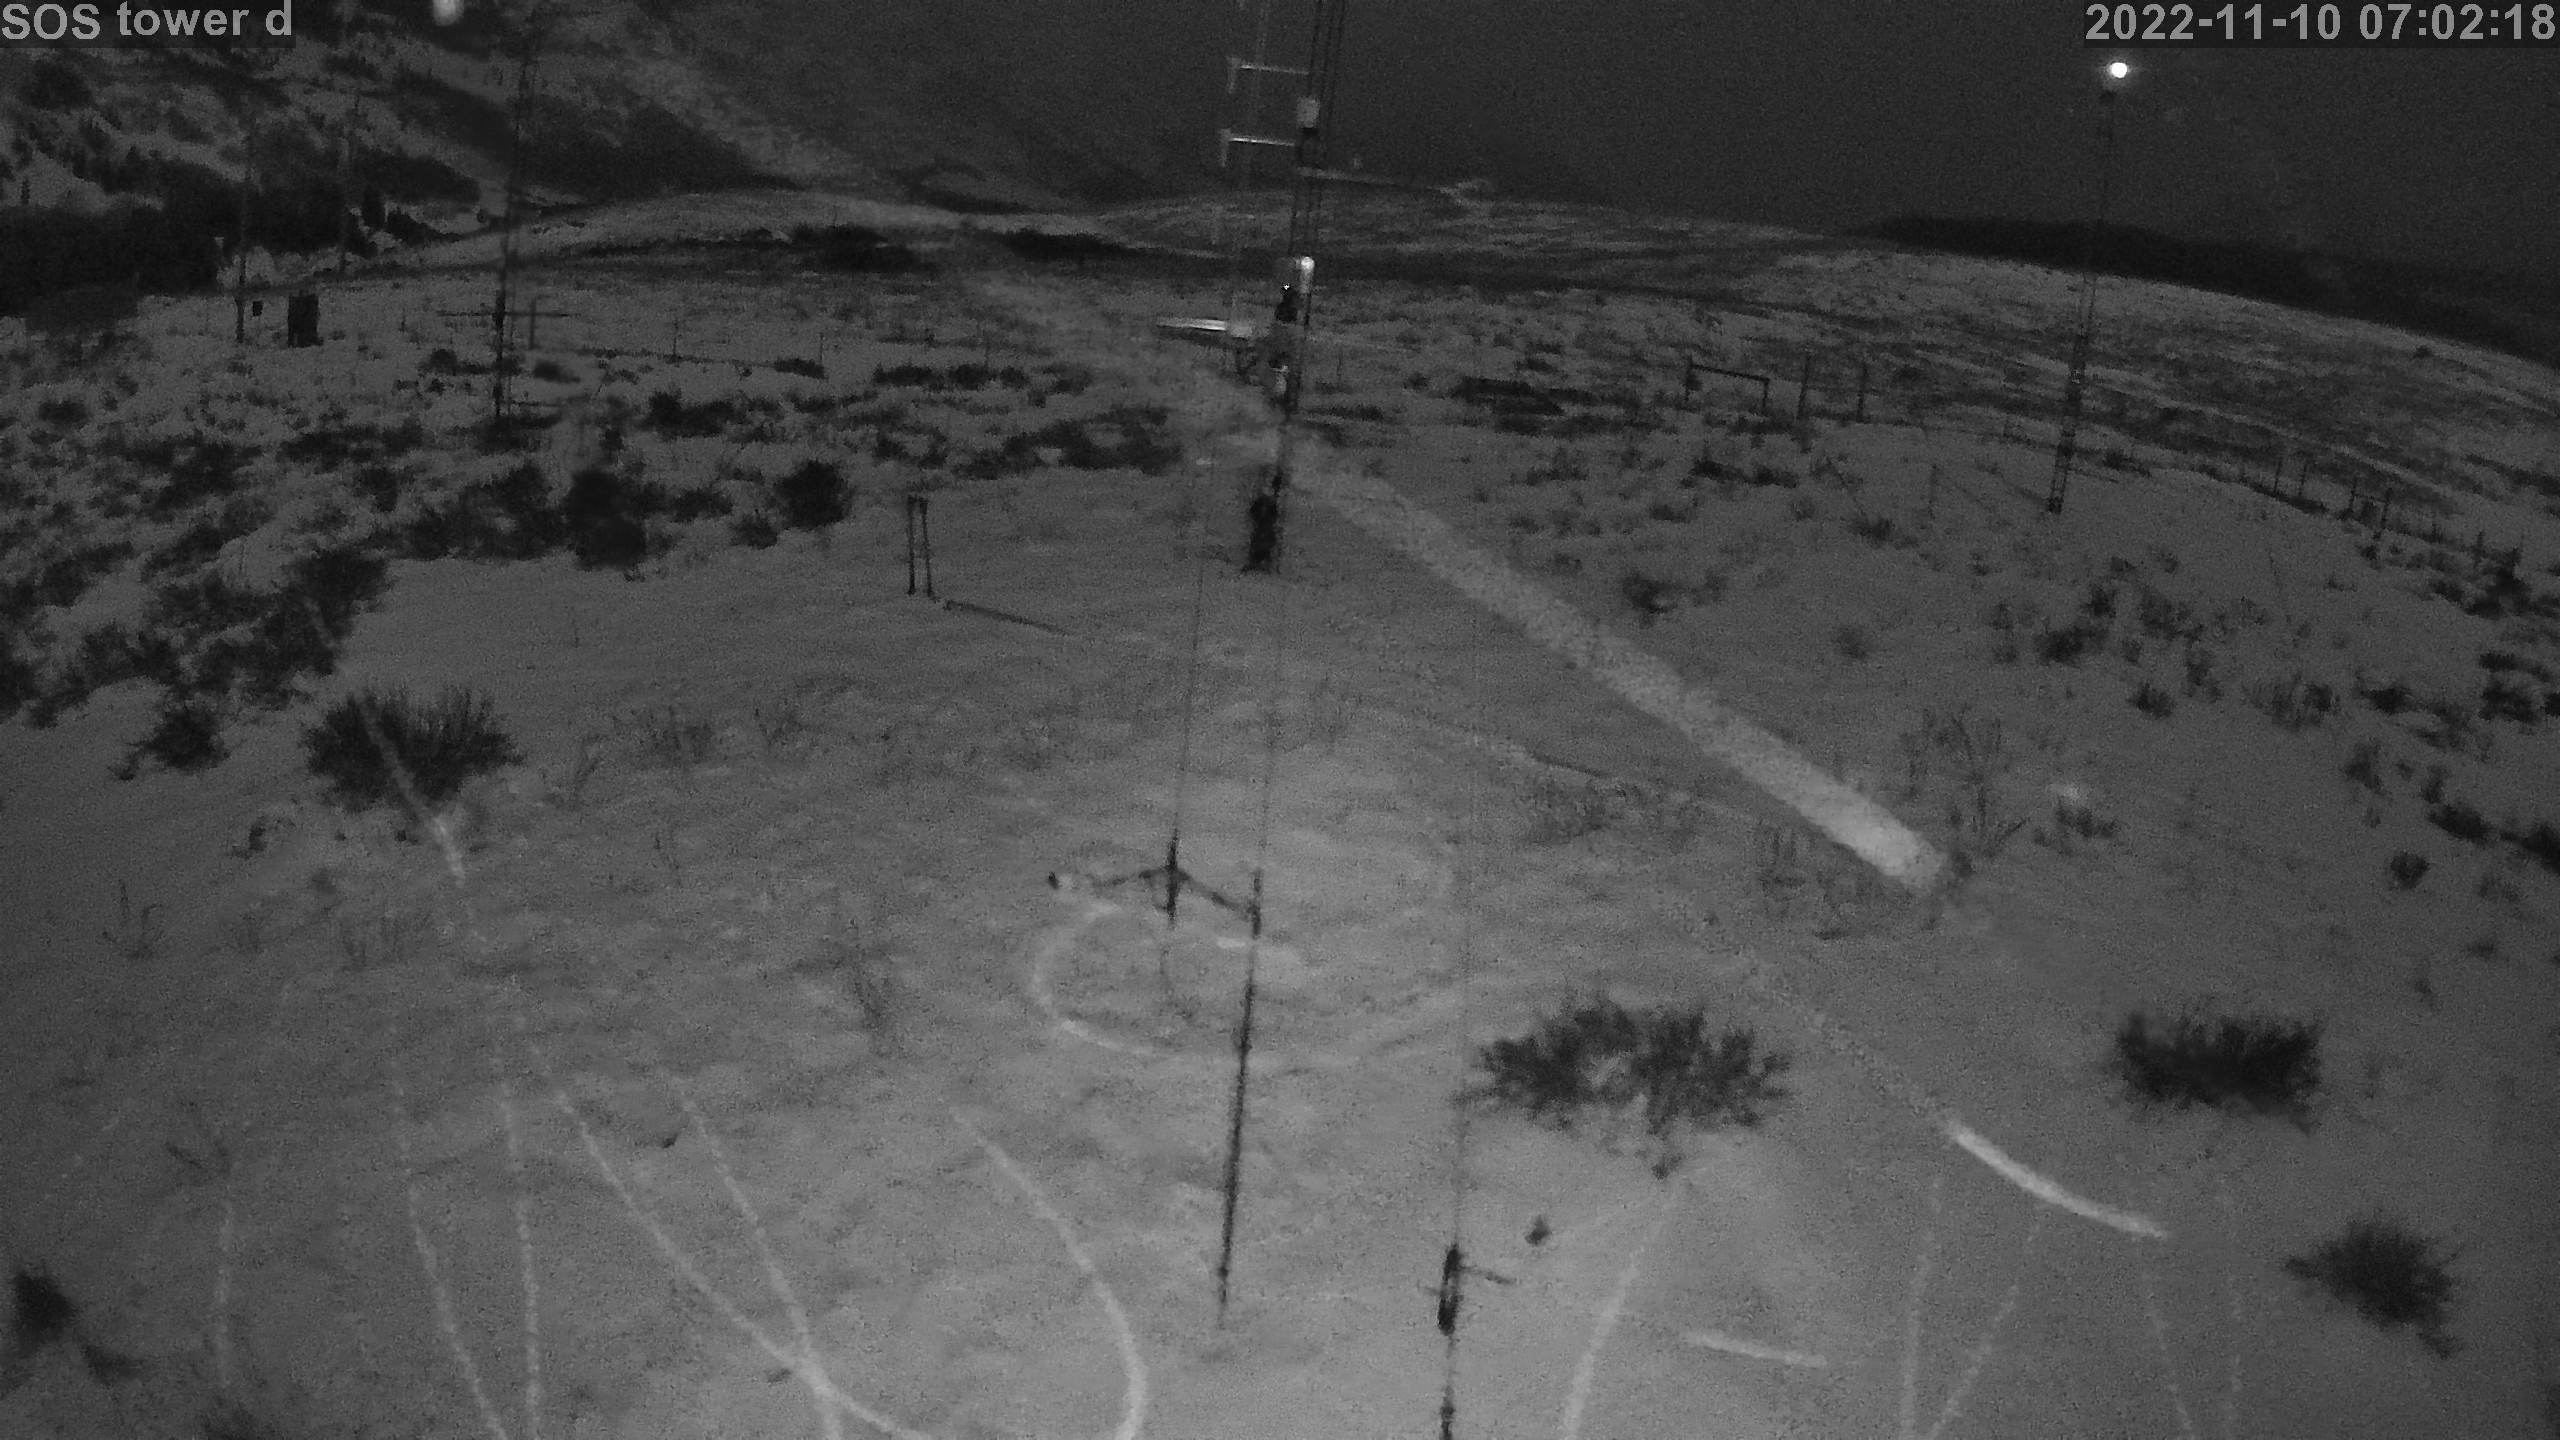
|
photo 202211100802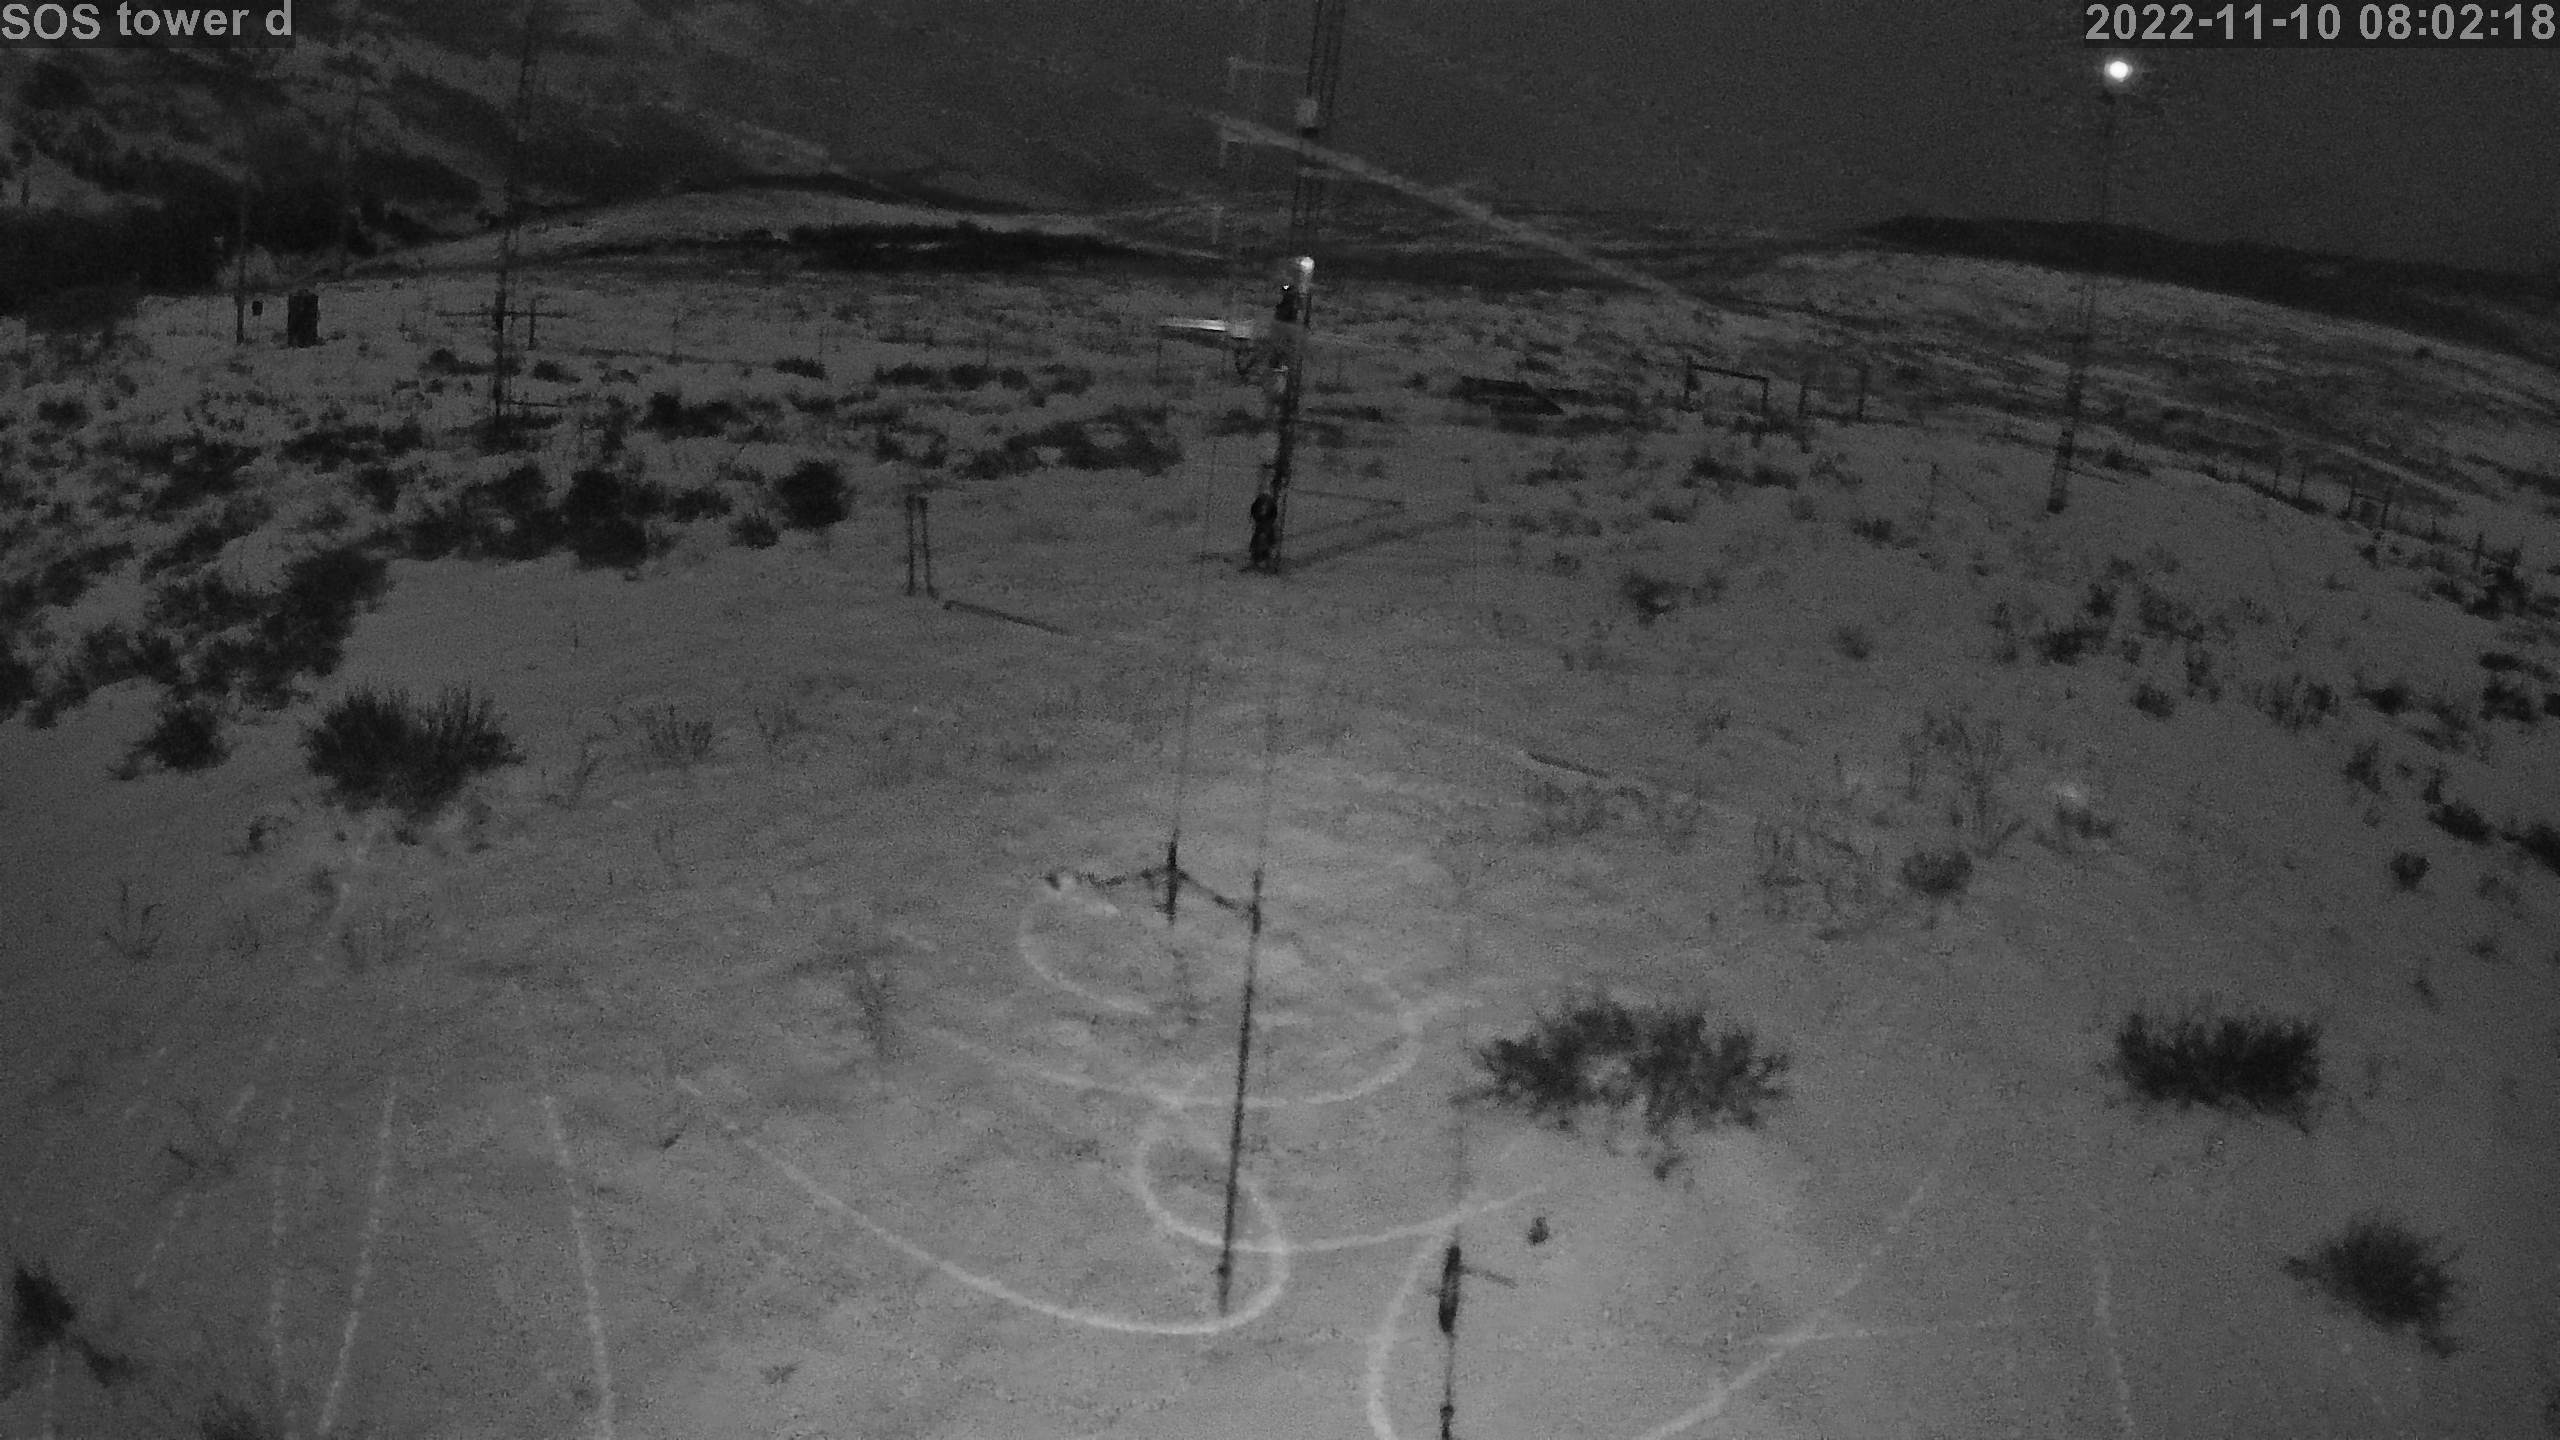
|
photo 202211100902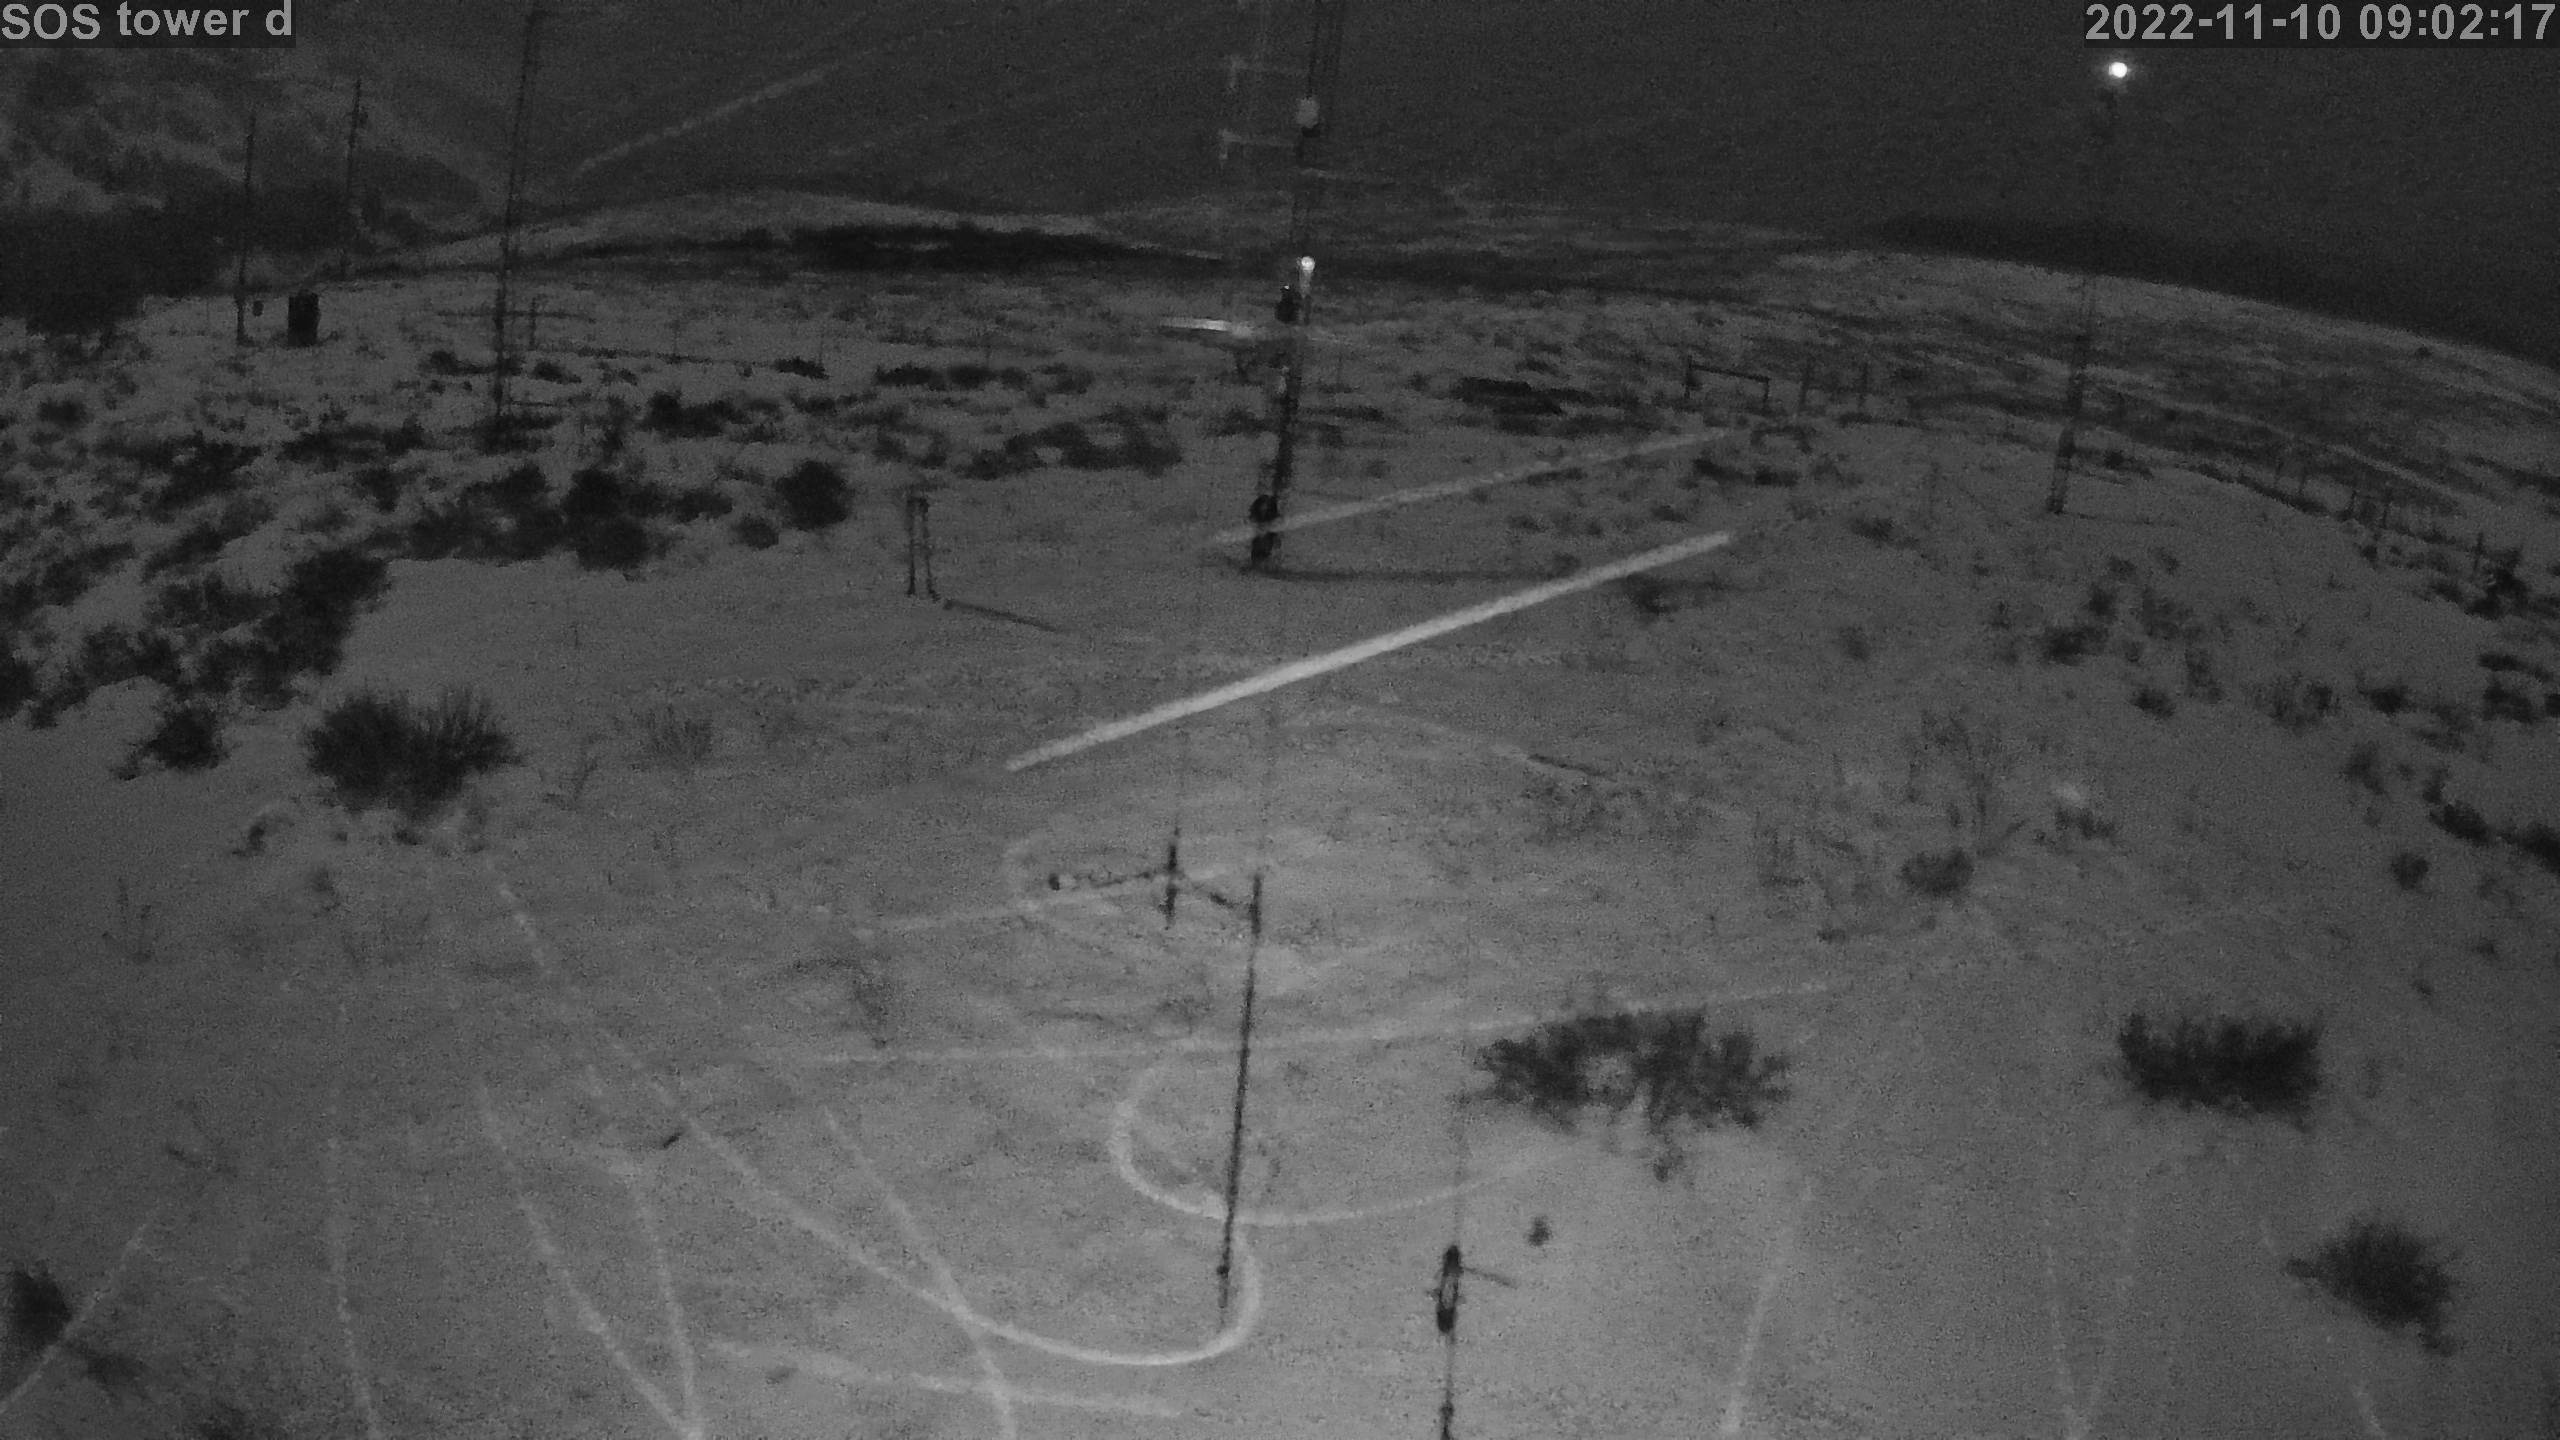
|
photo 202211101002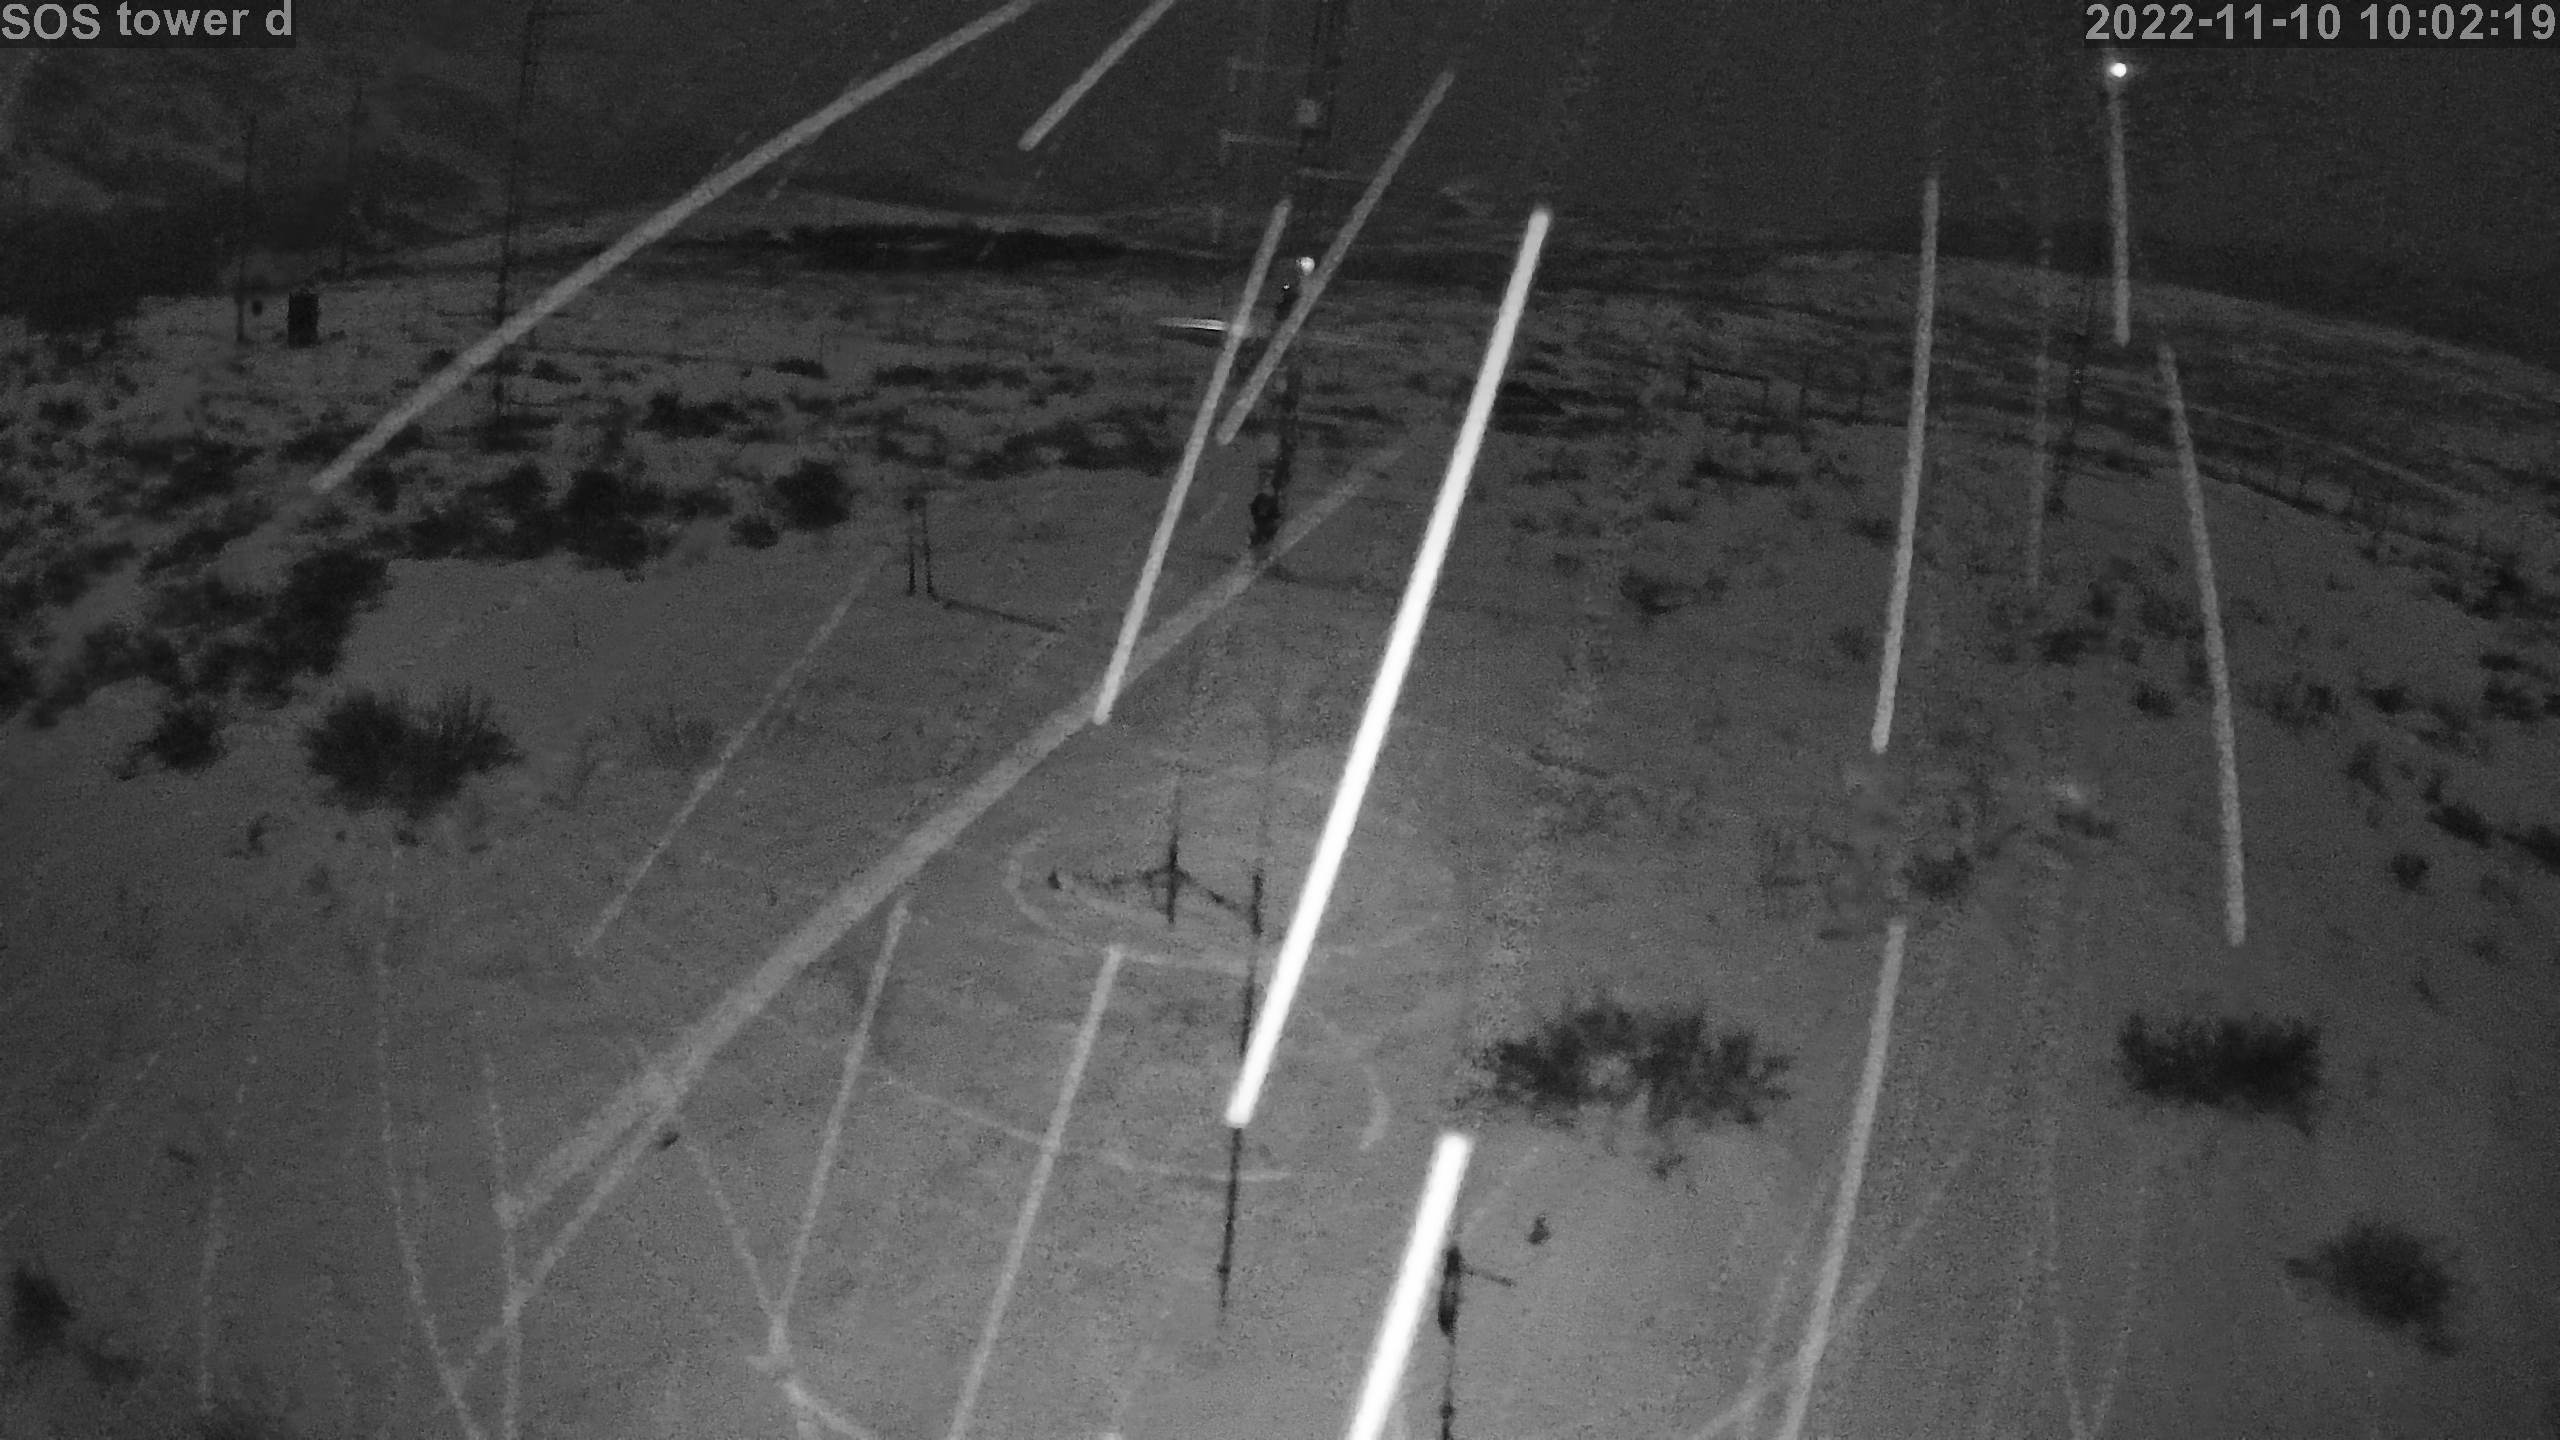
|
photo 202211101102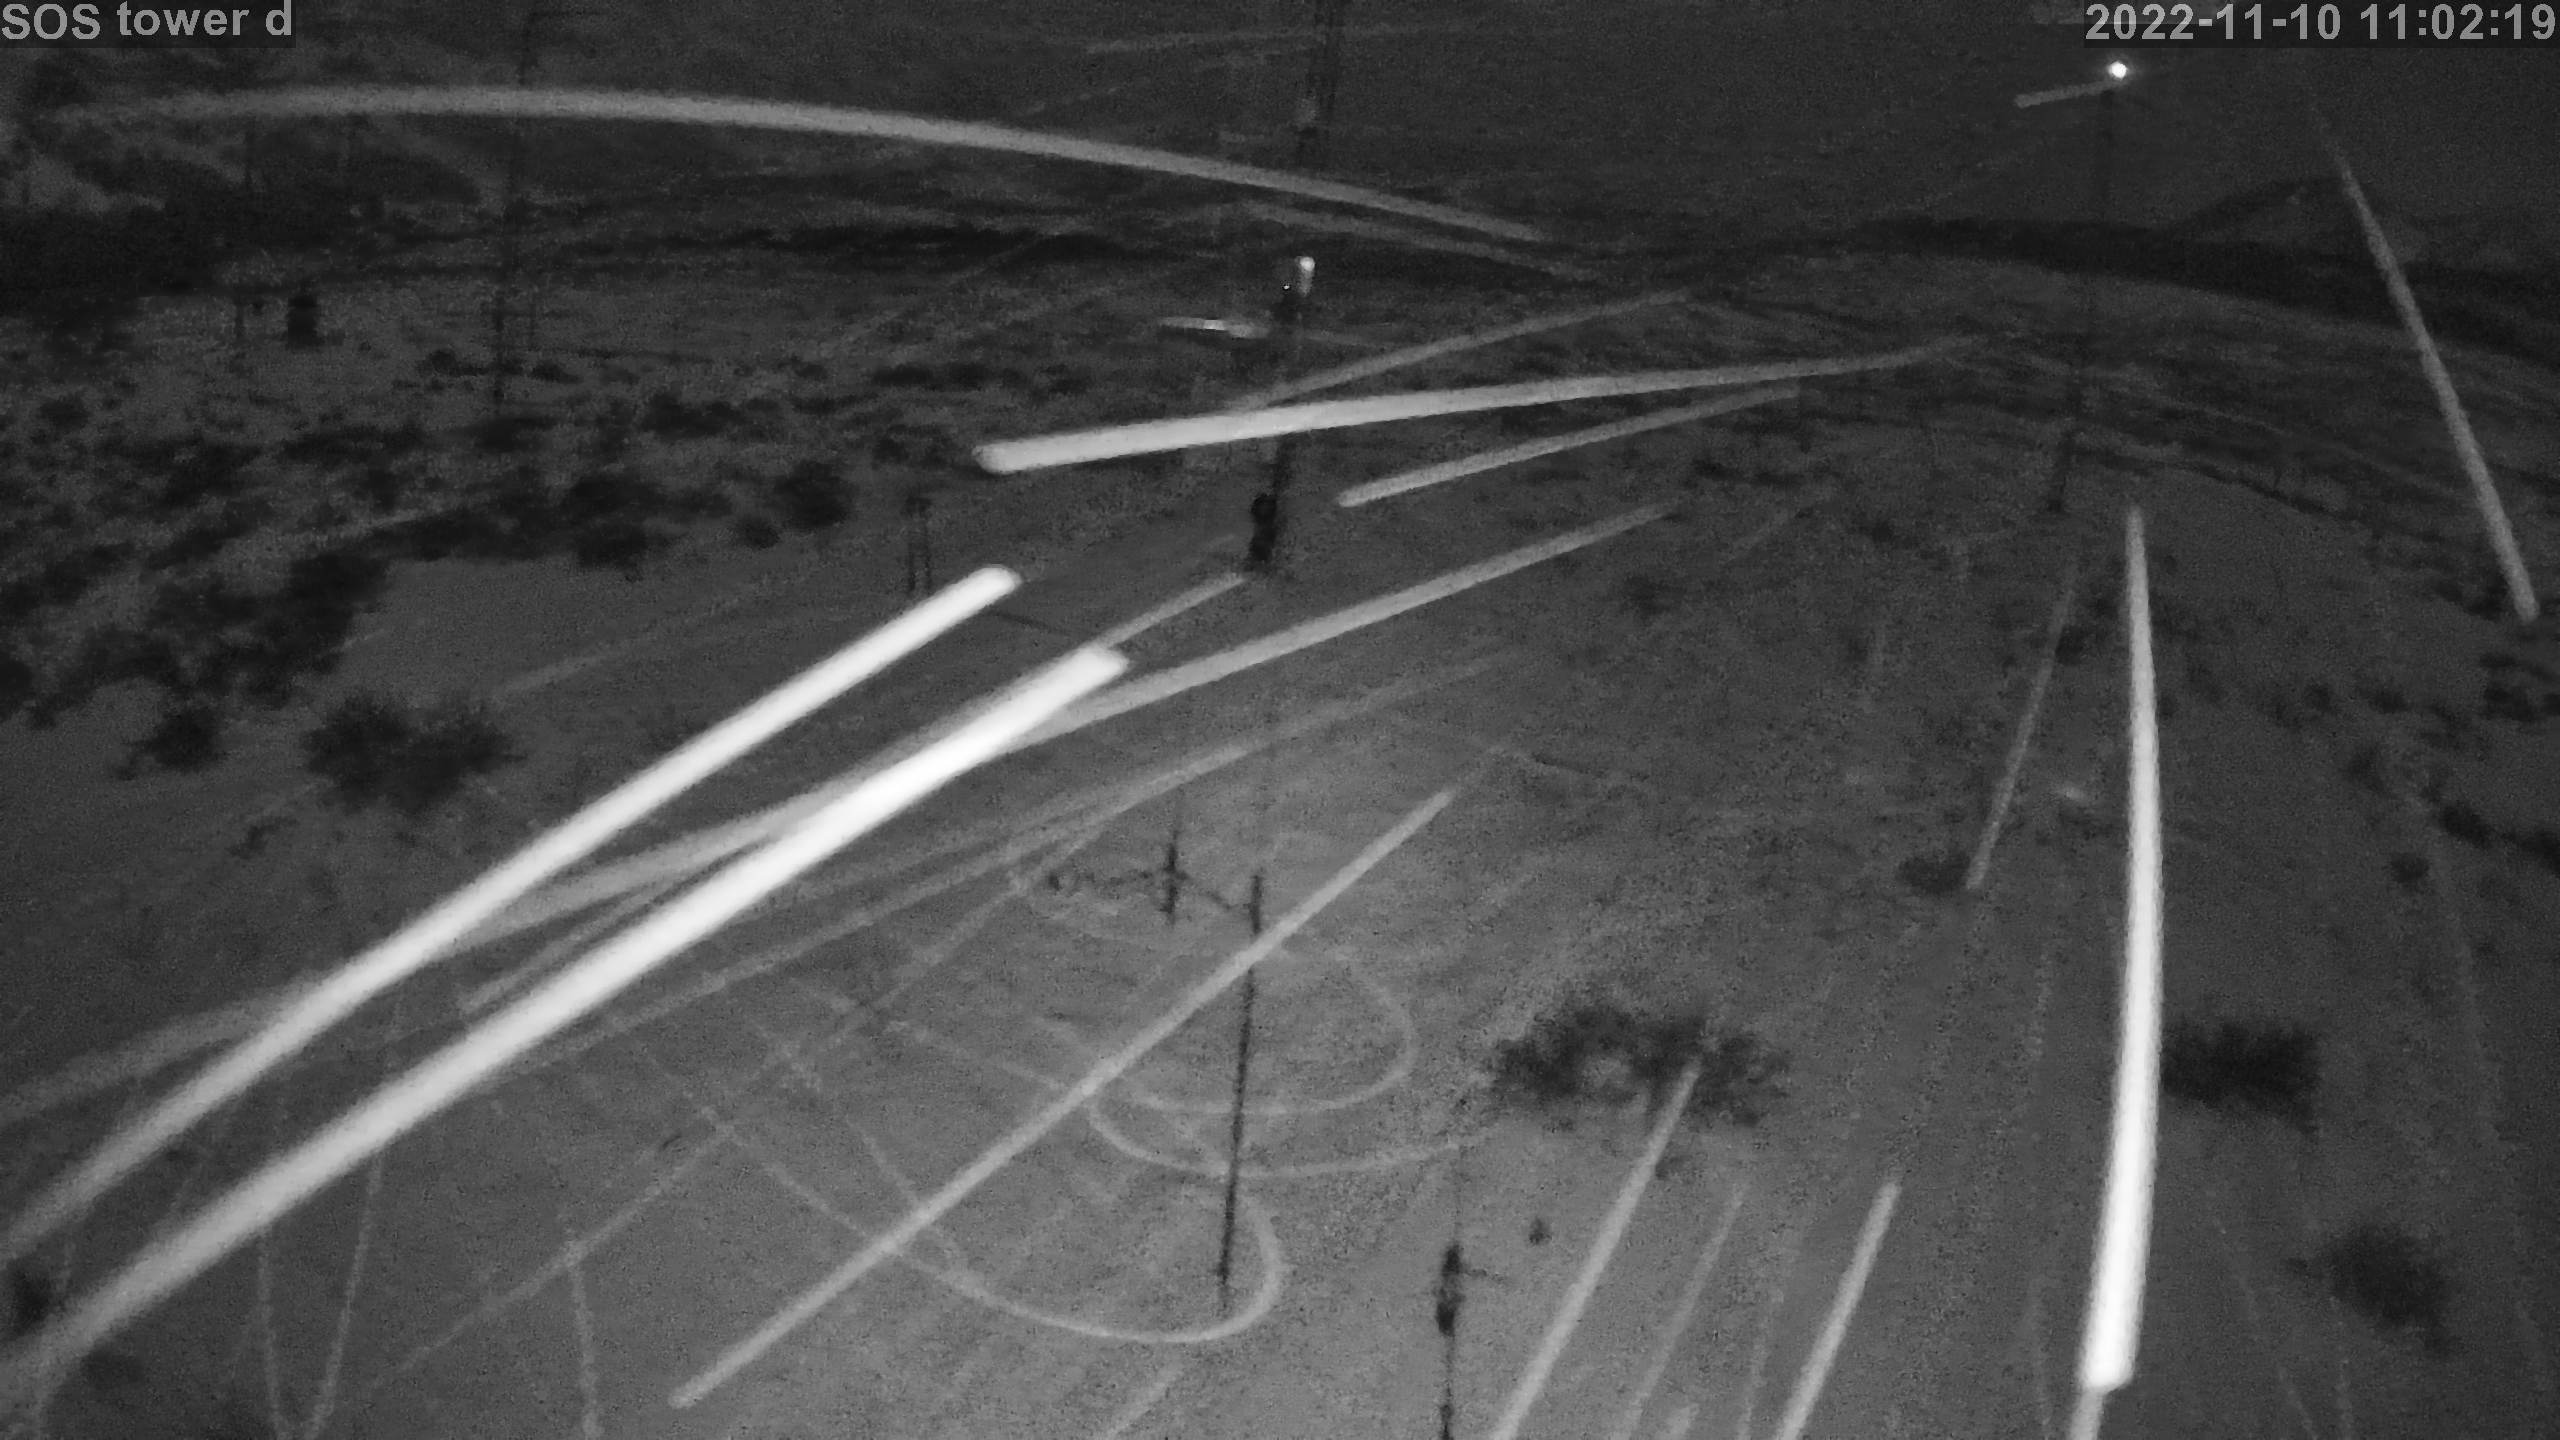
|
photo 202211101202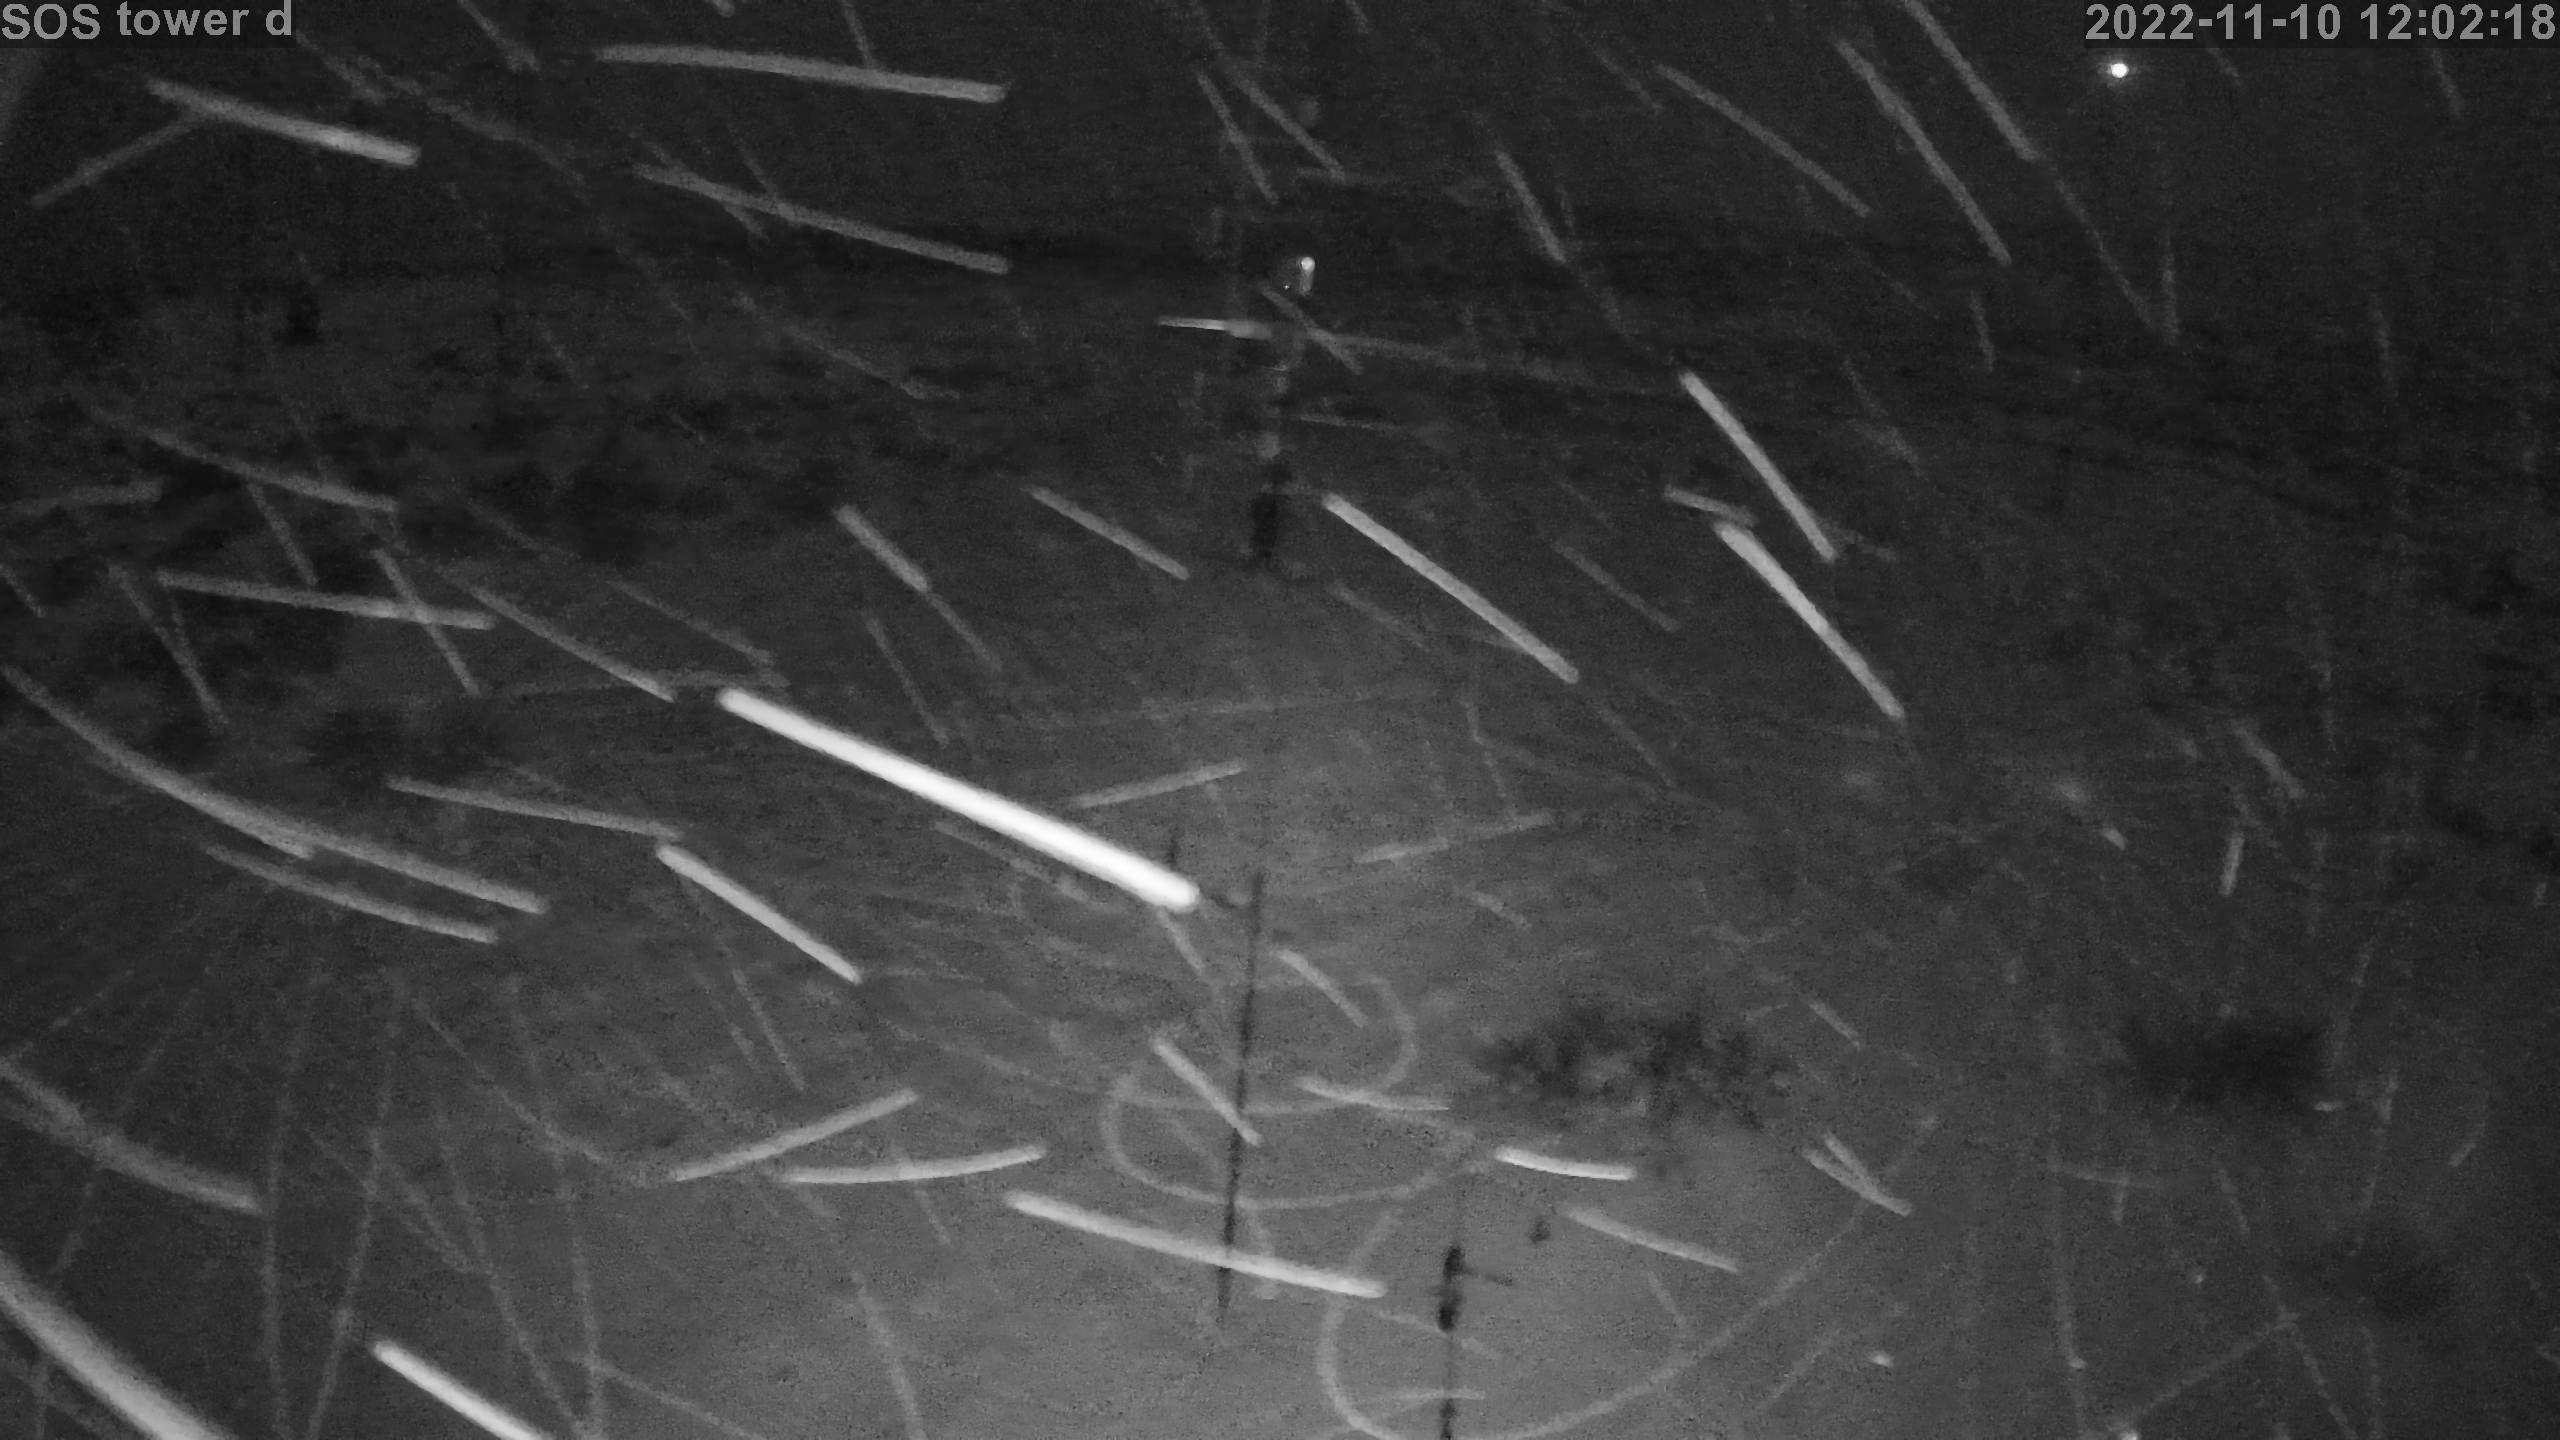
|
photo 202211101302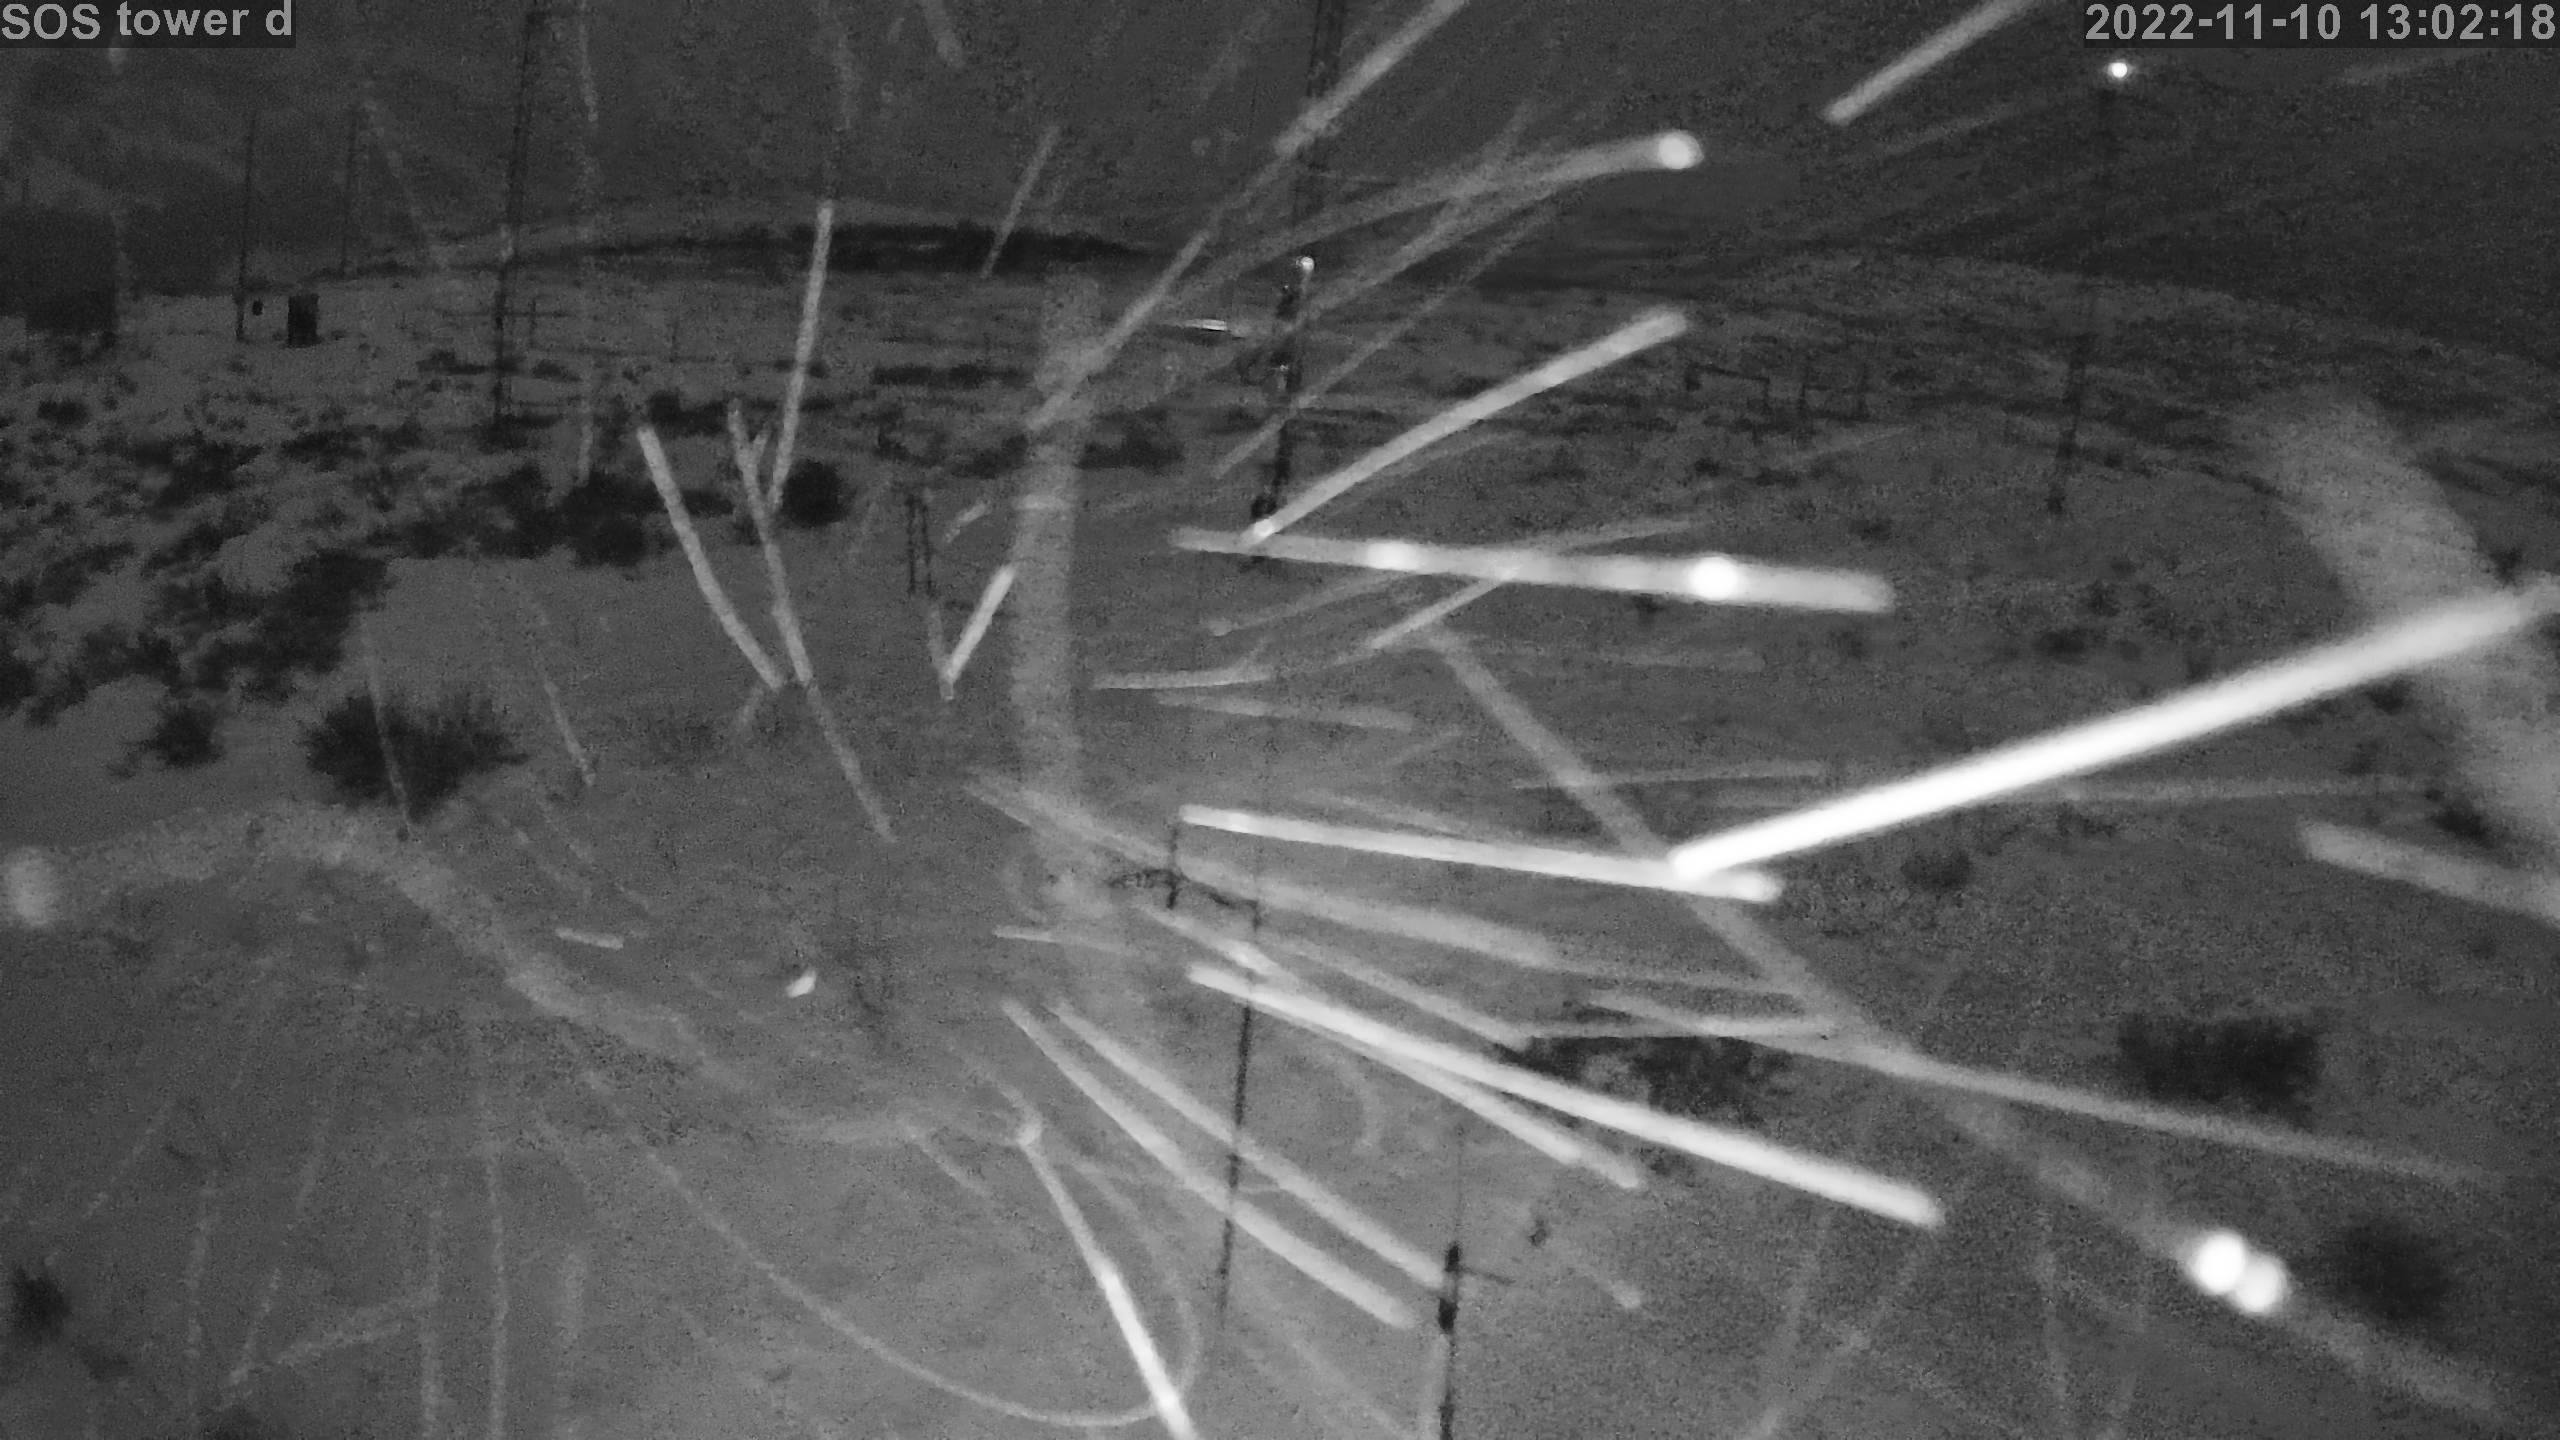
|
photo 202211101402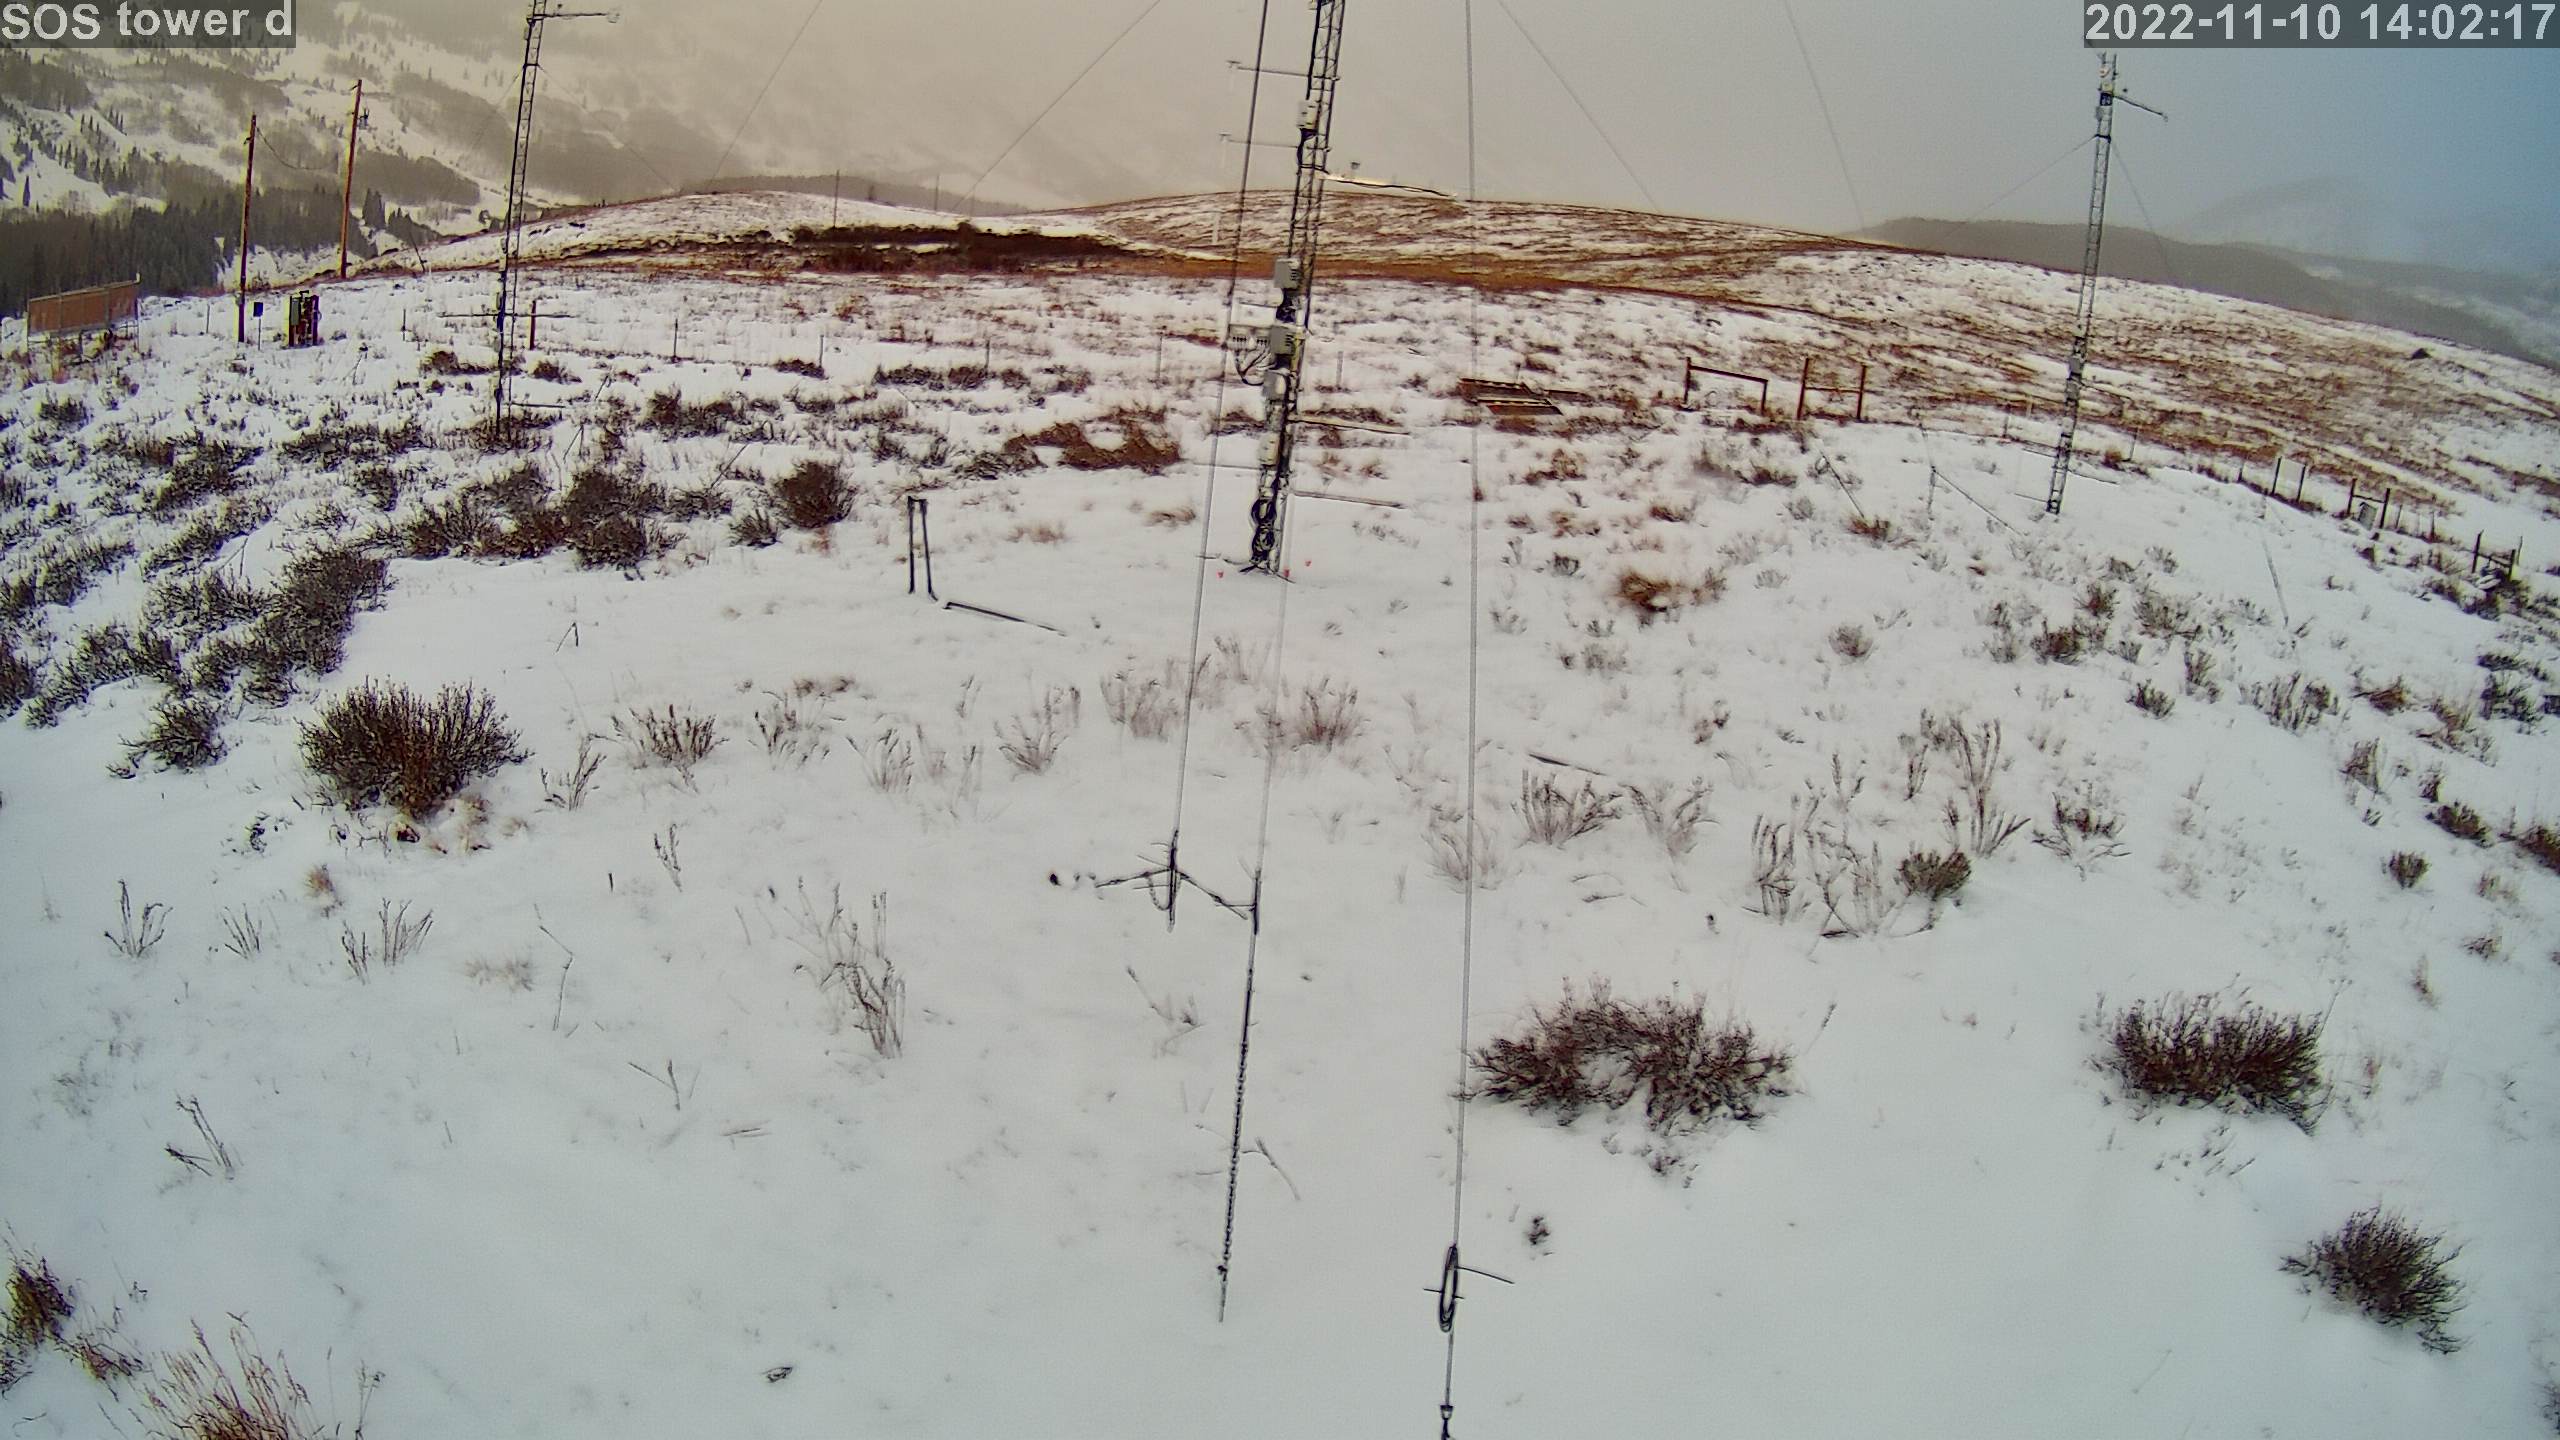
|
photo 202211101502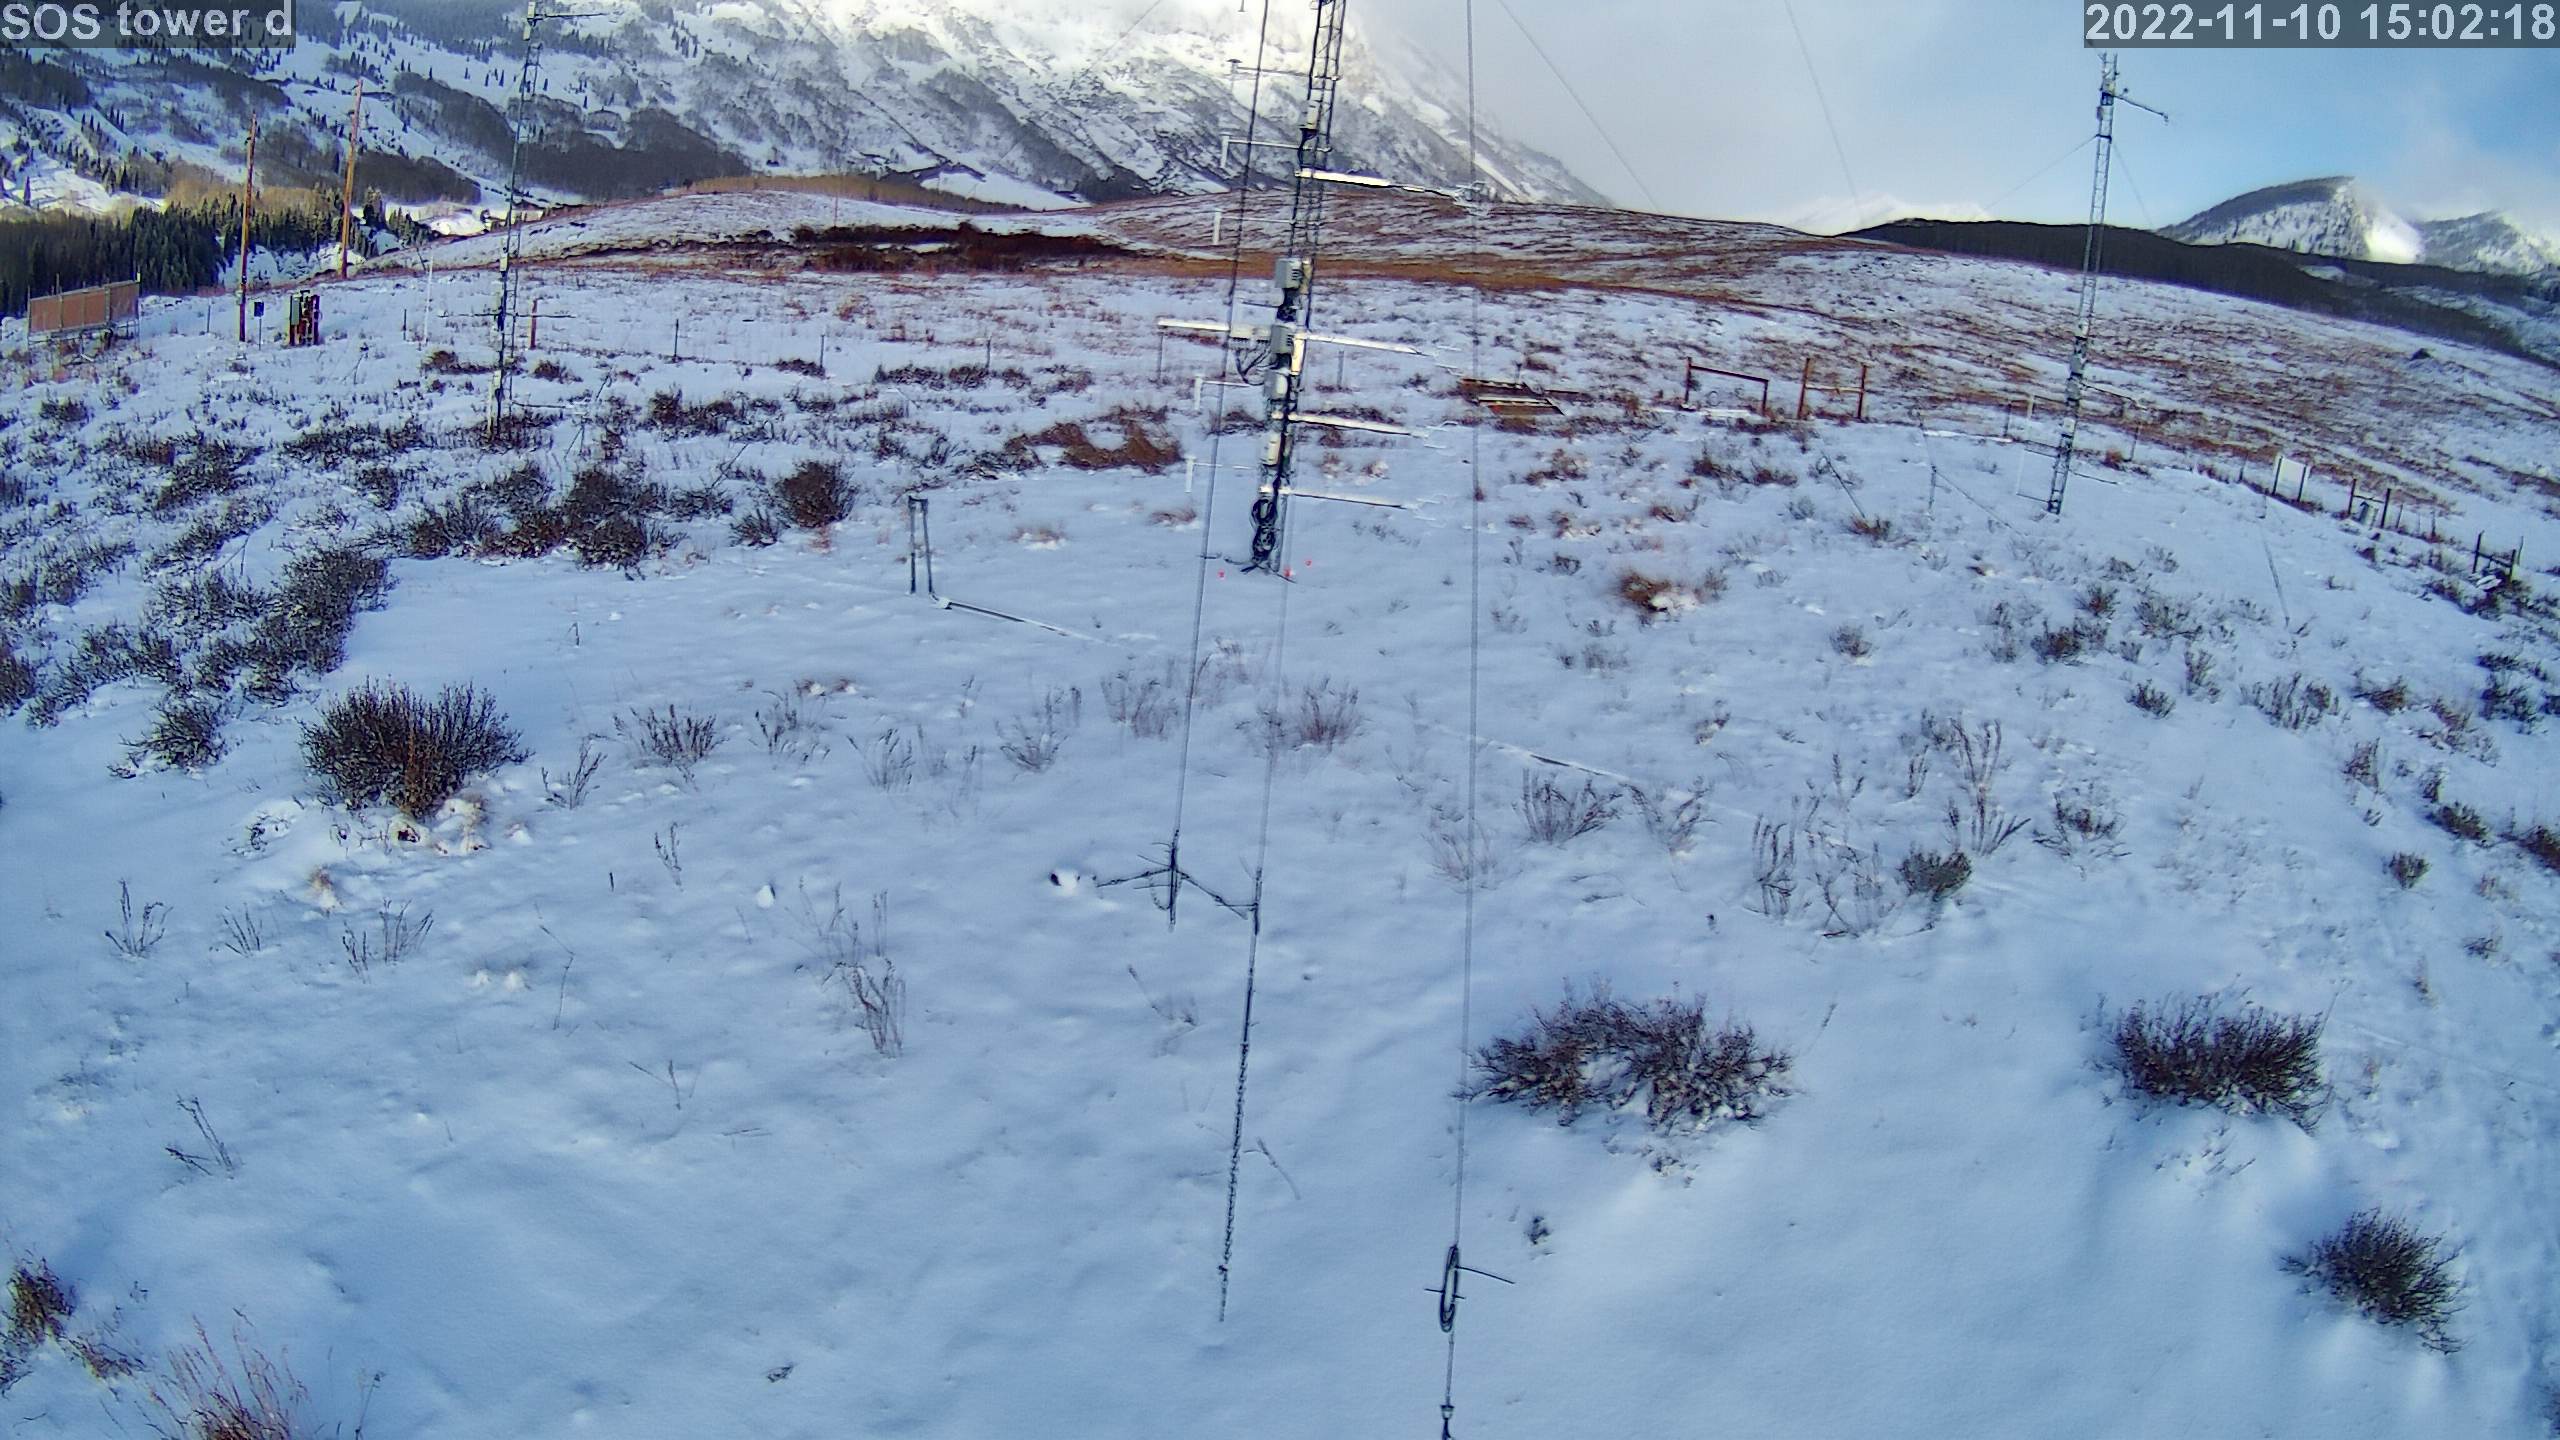
|
photo 202211101602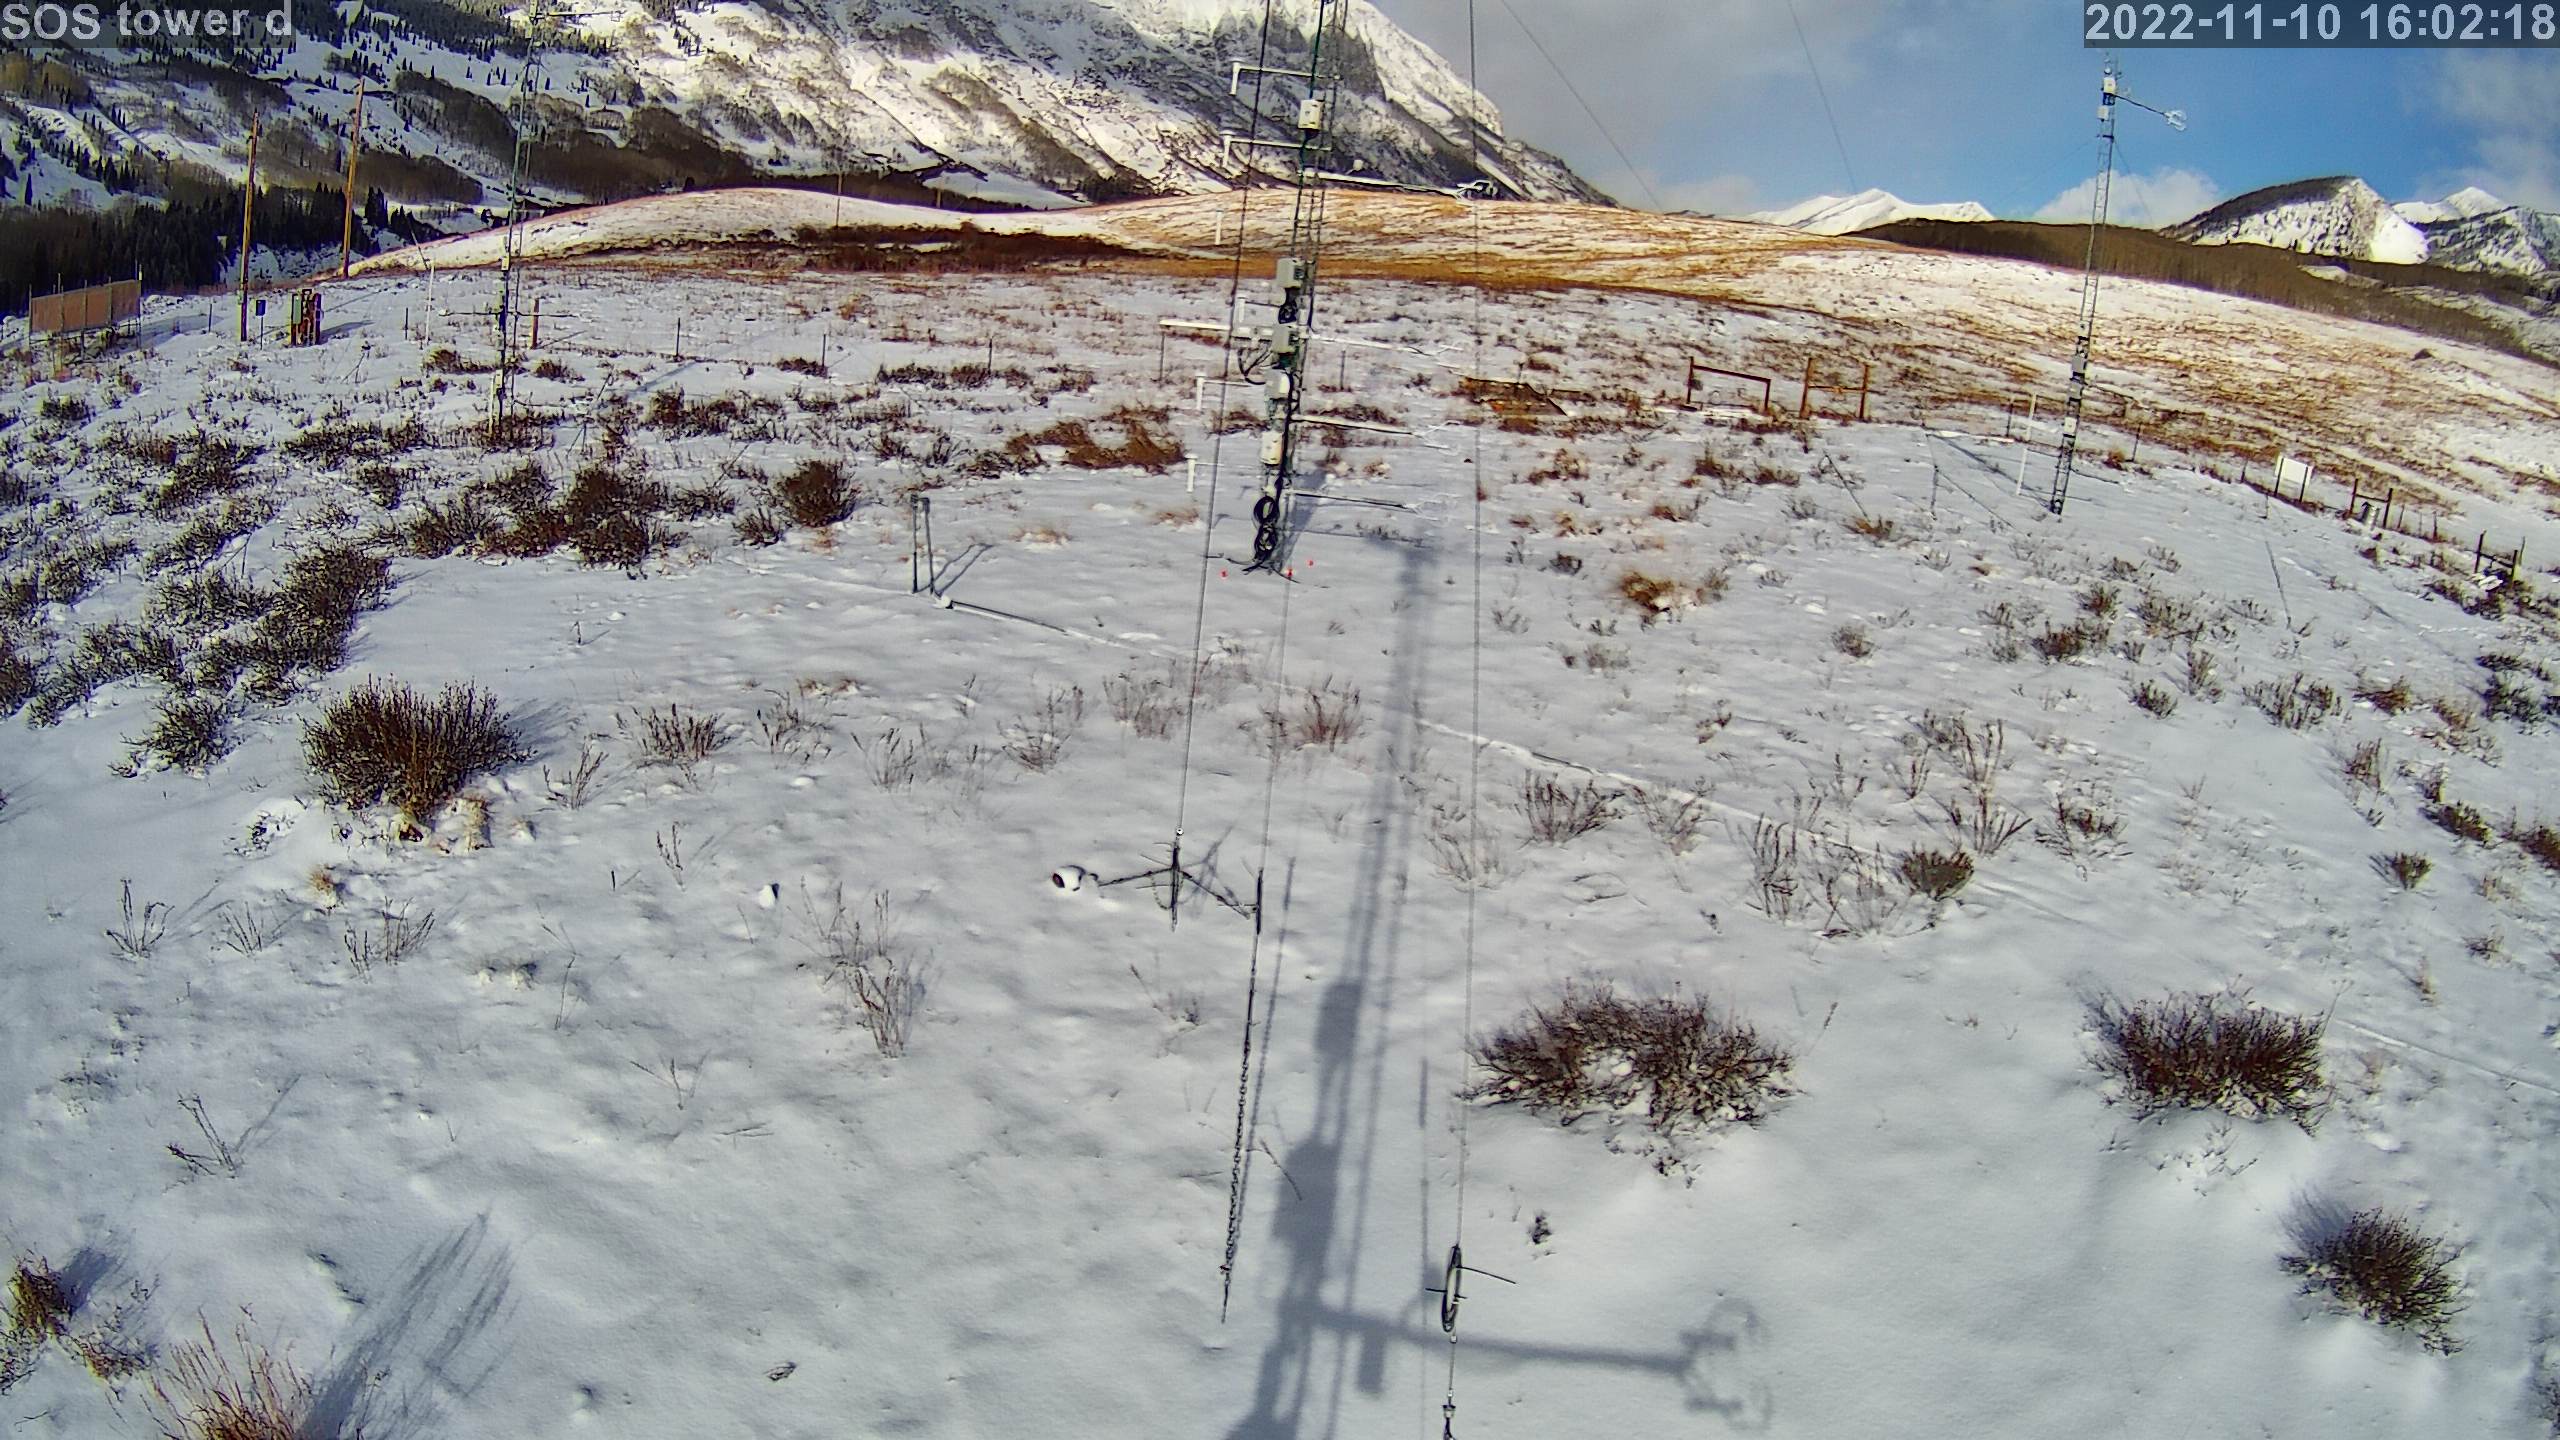
|
photo 202211101702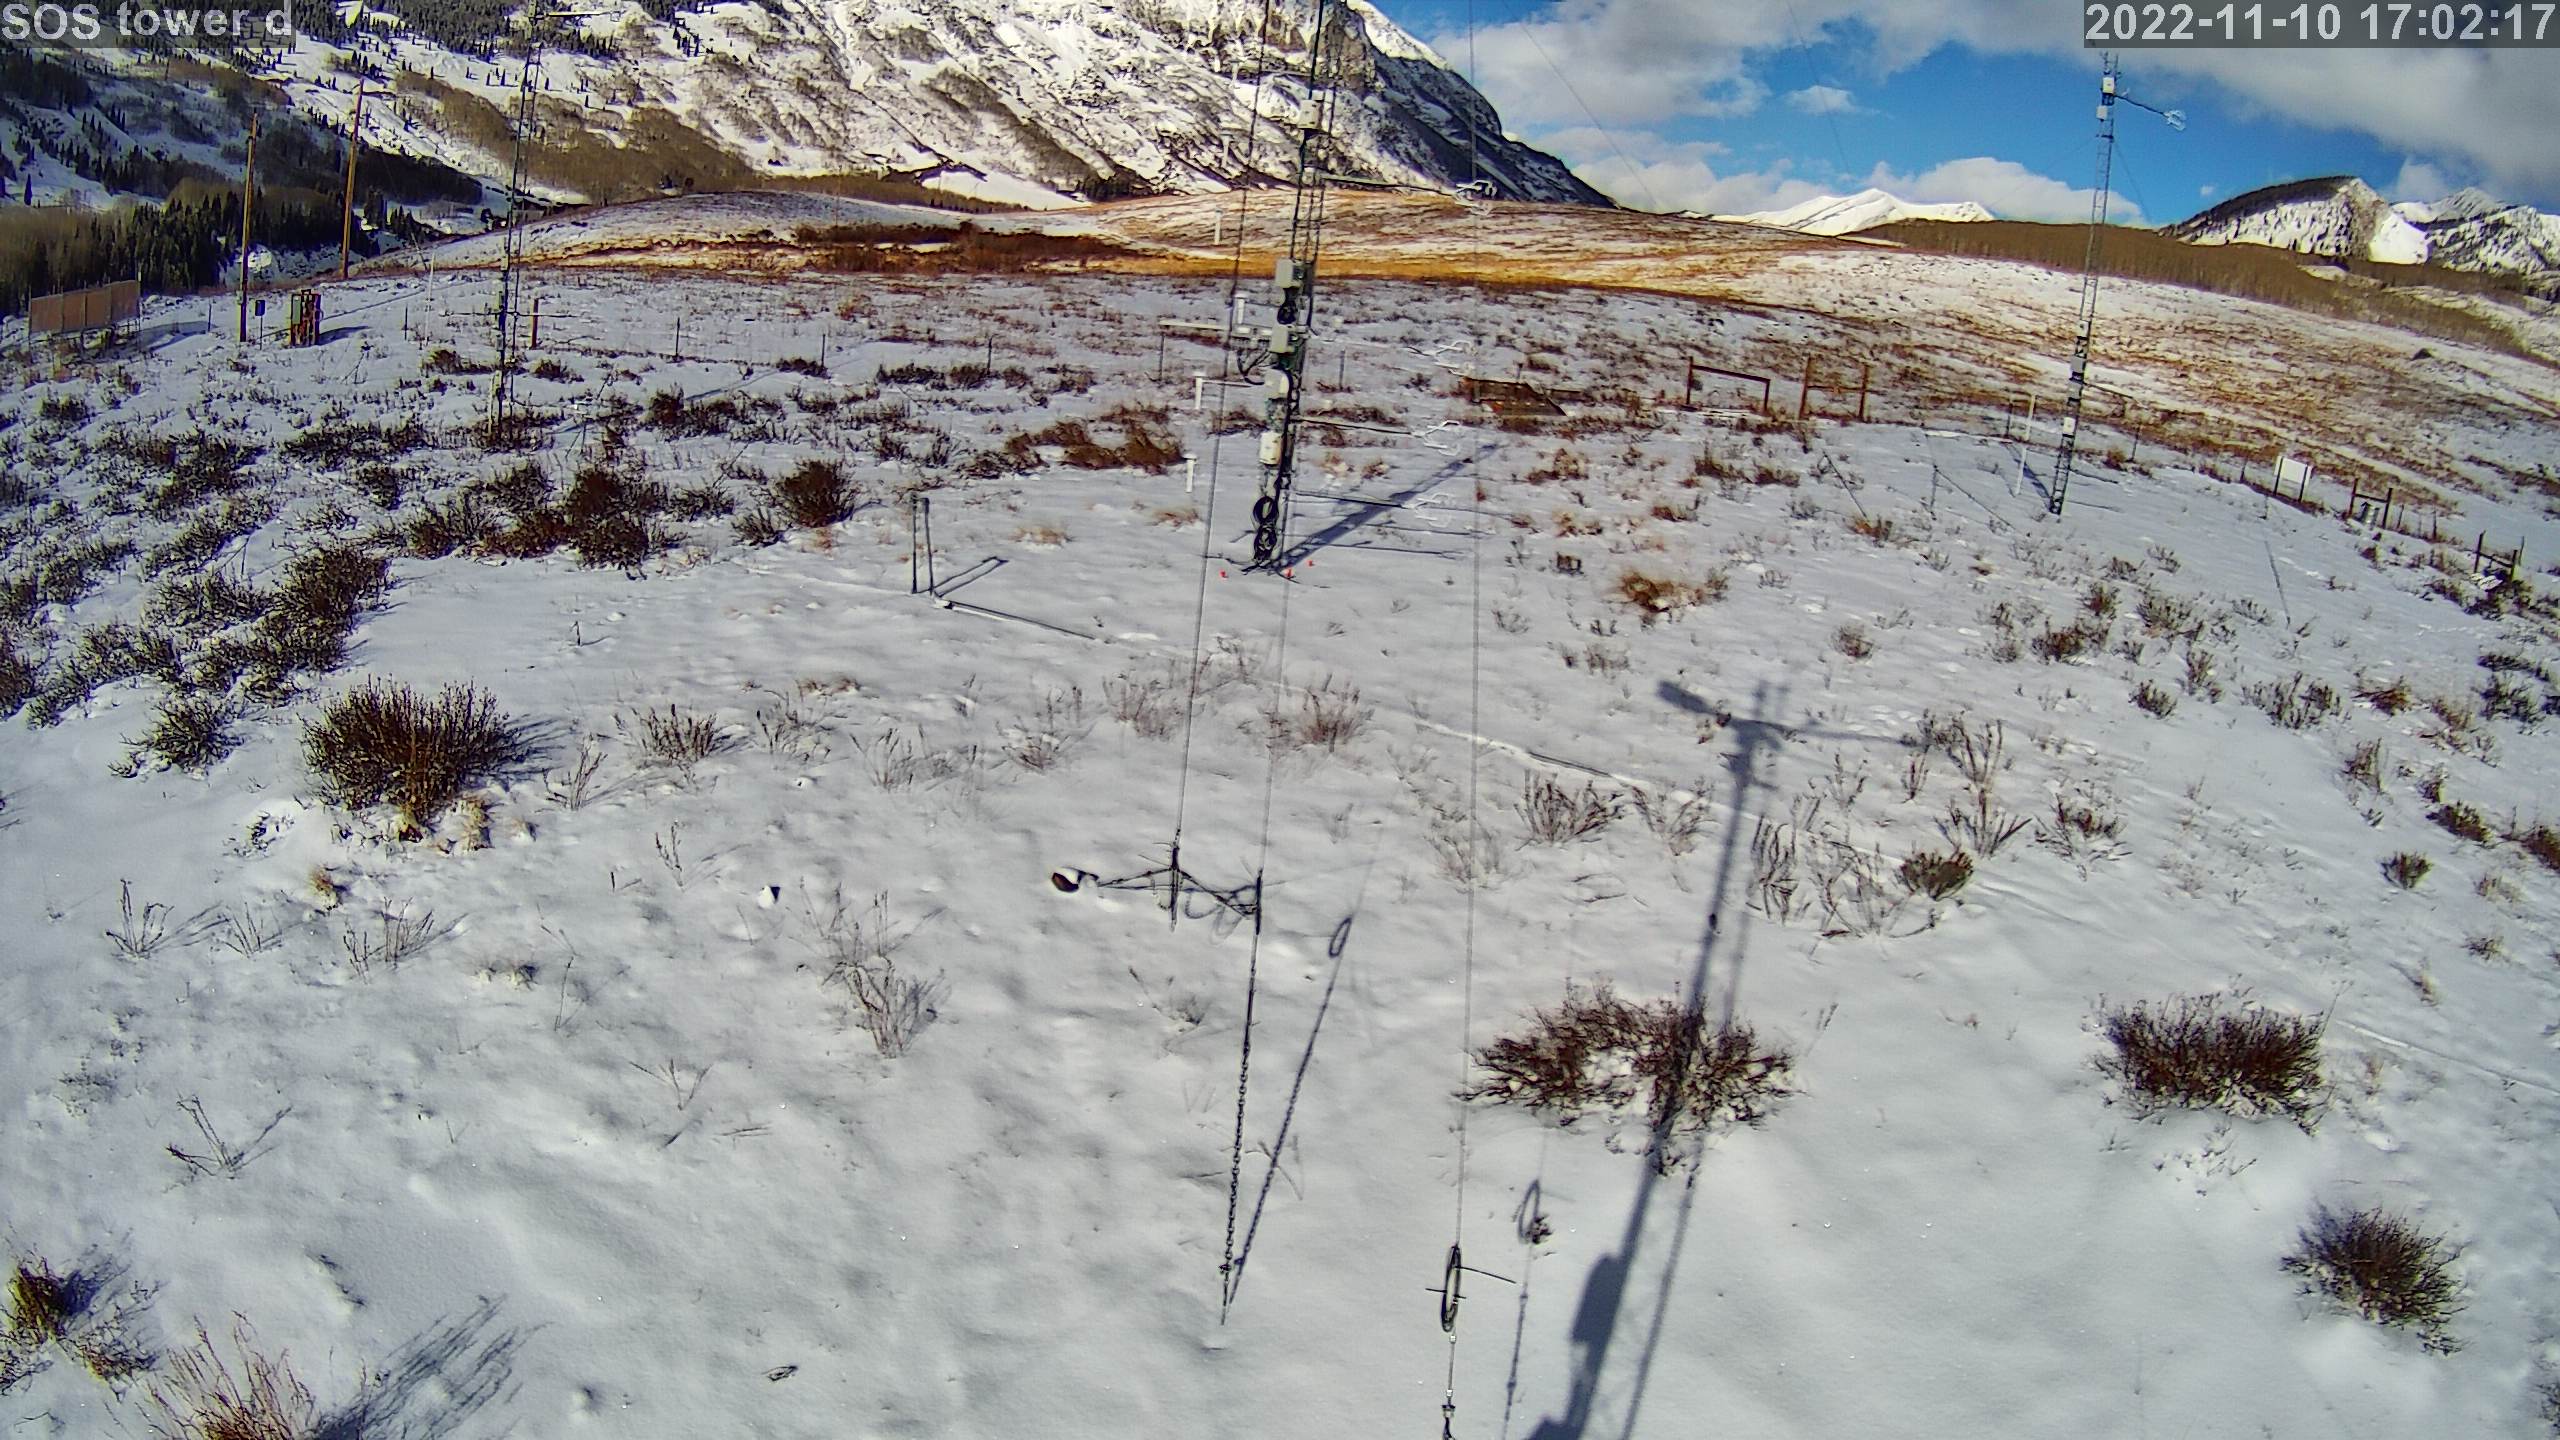
|
photo 202211101802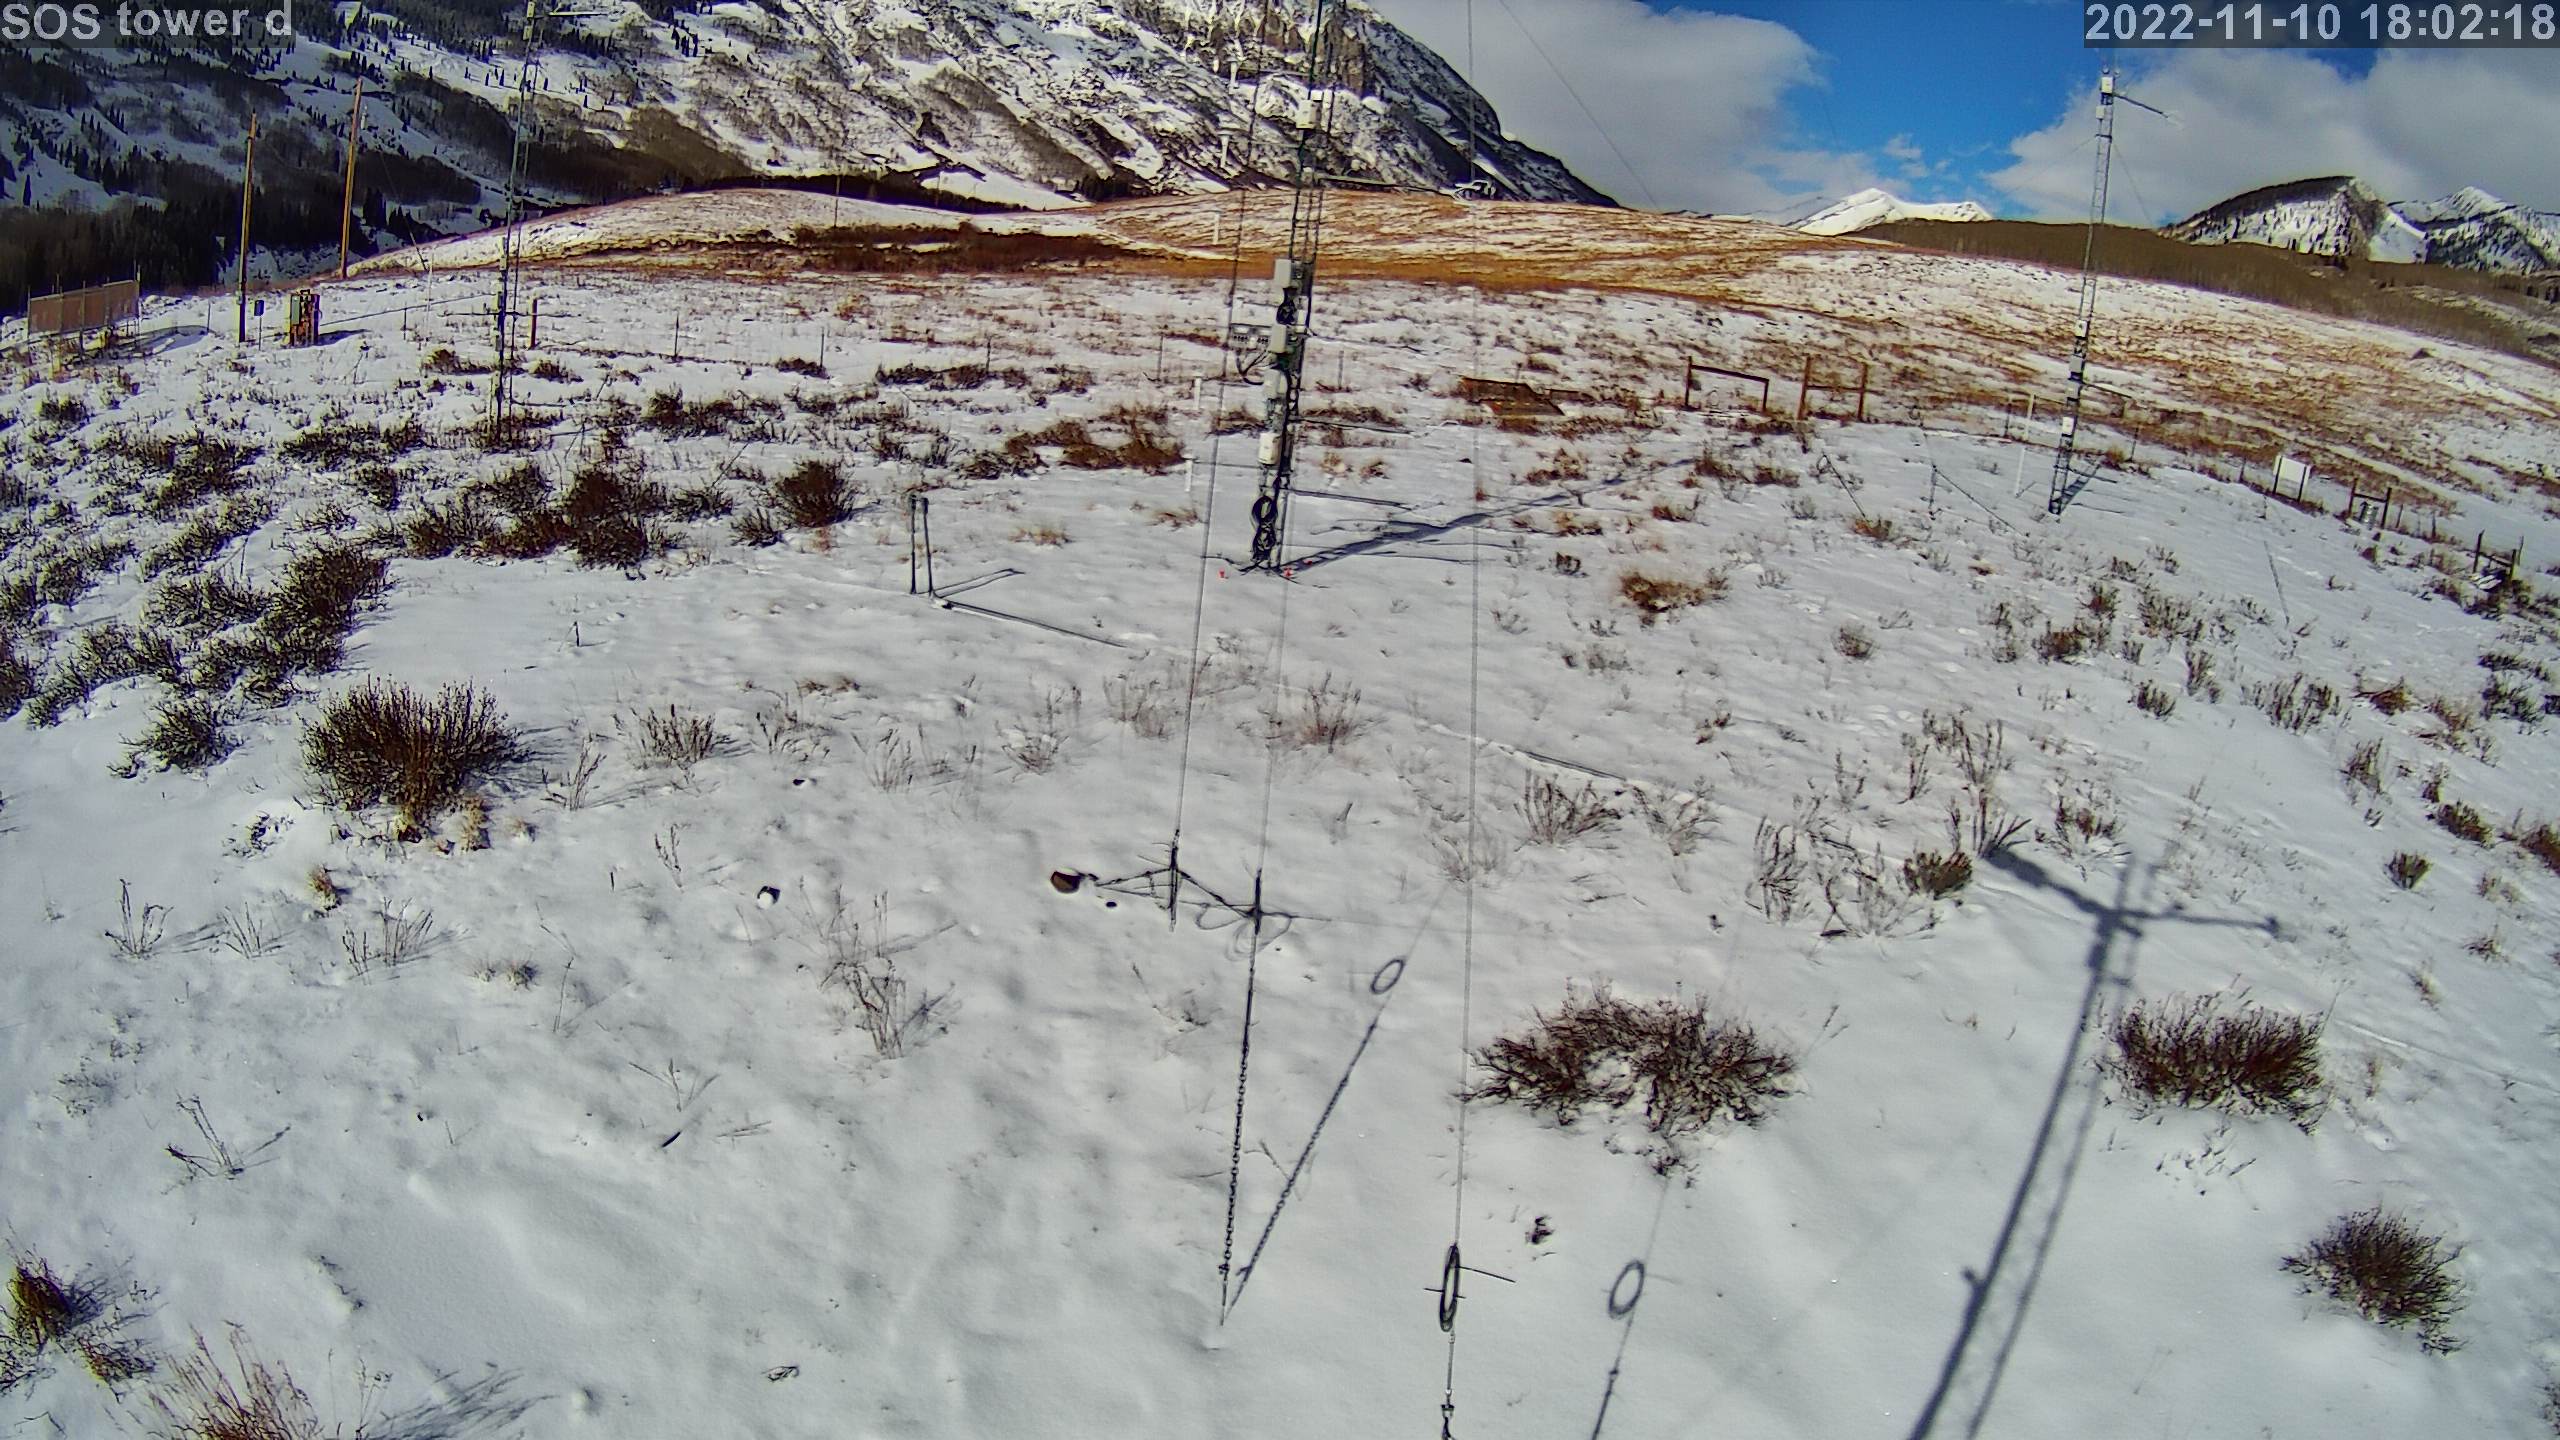
|
photo 202211101902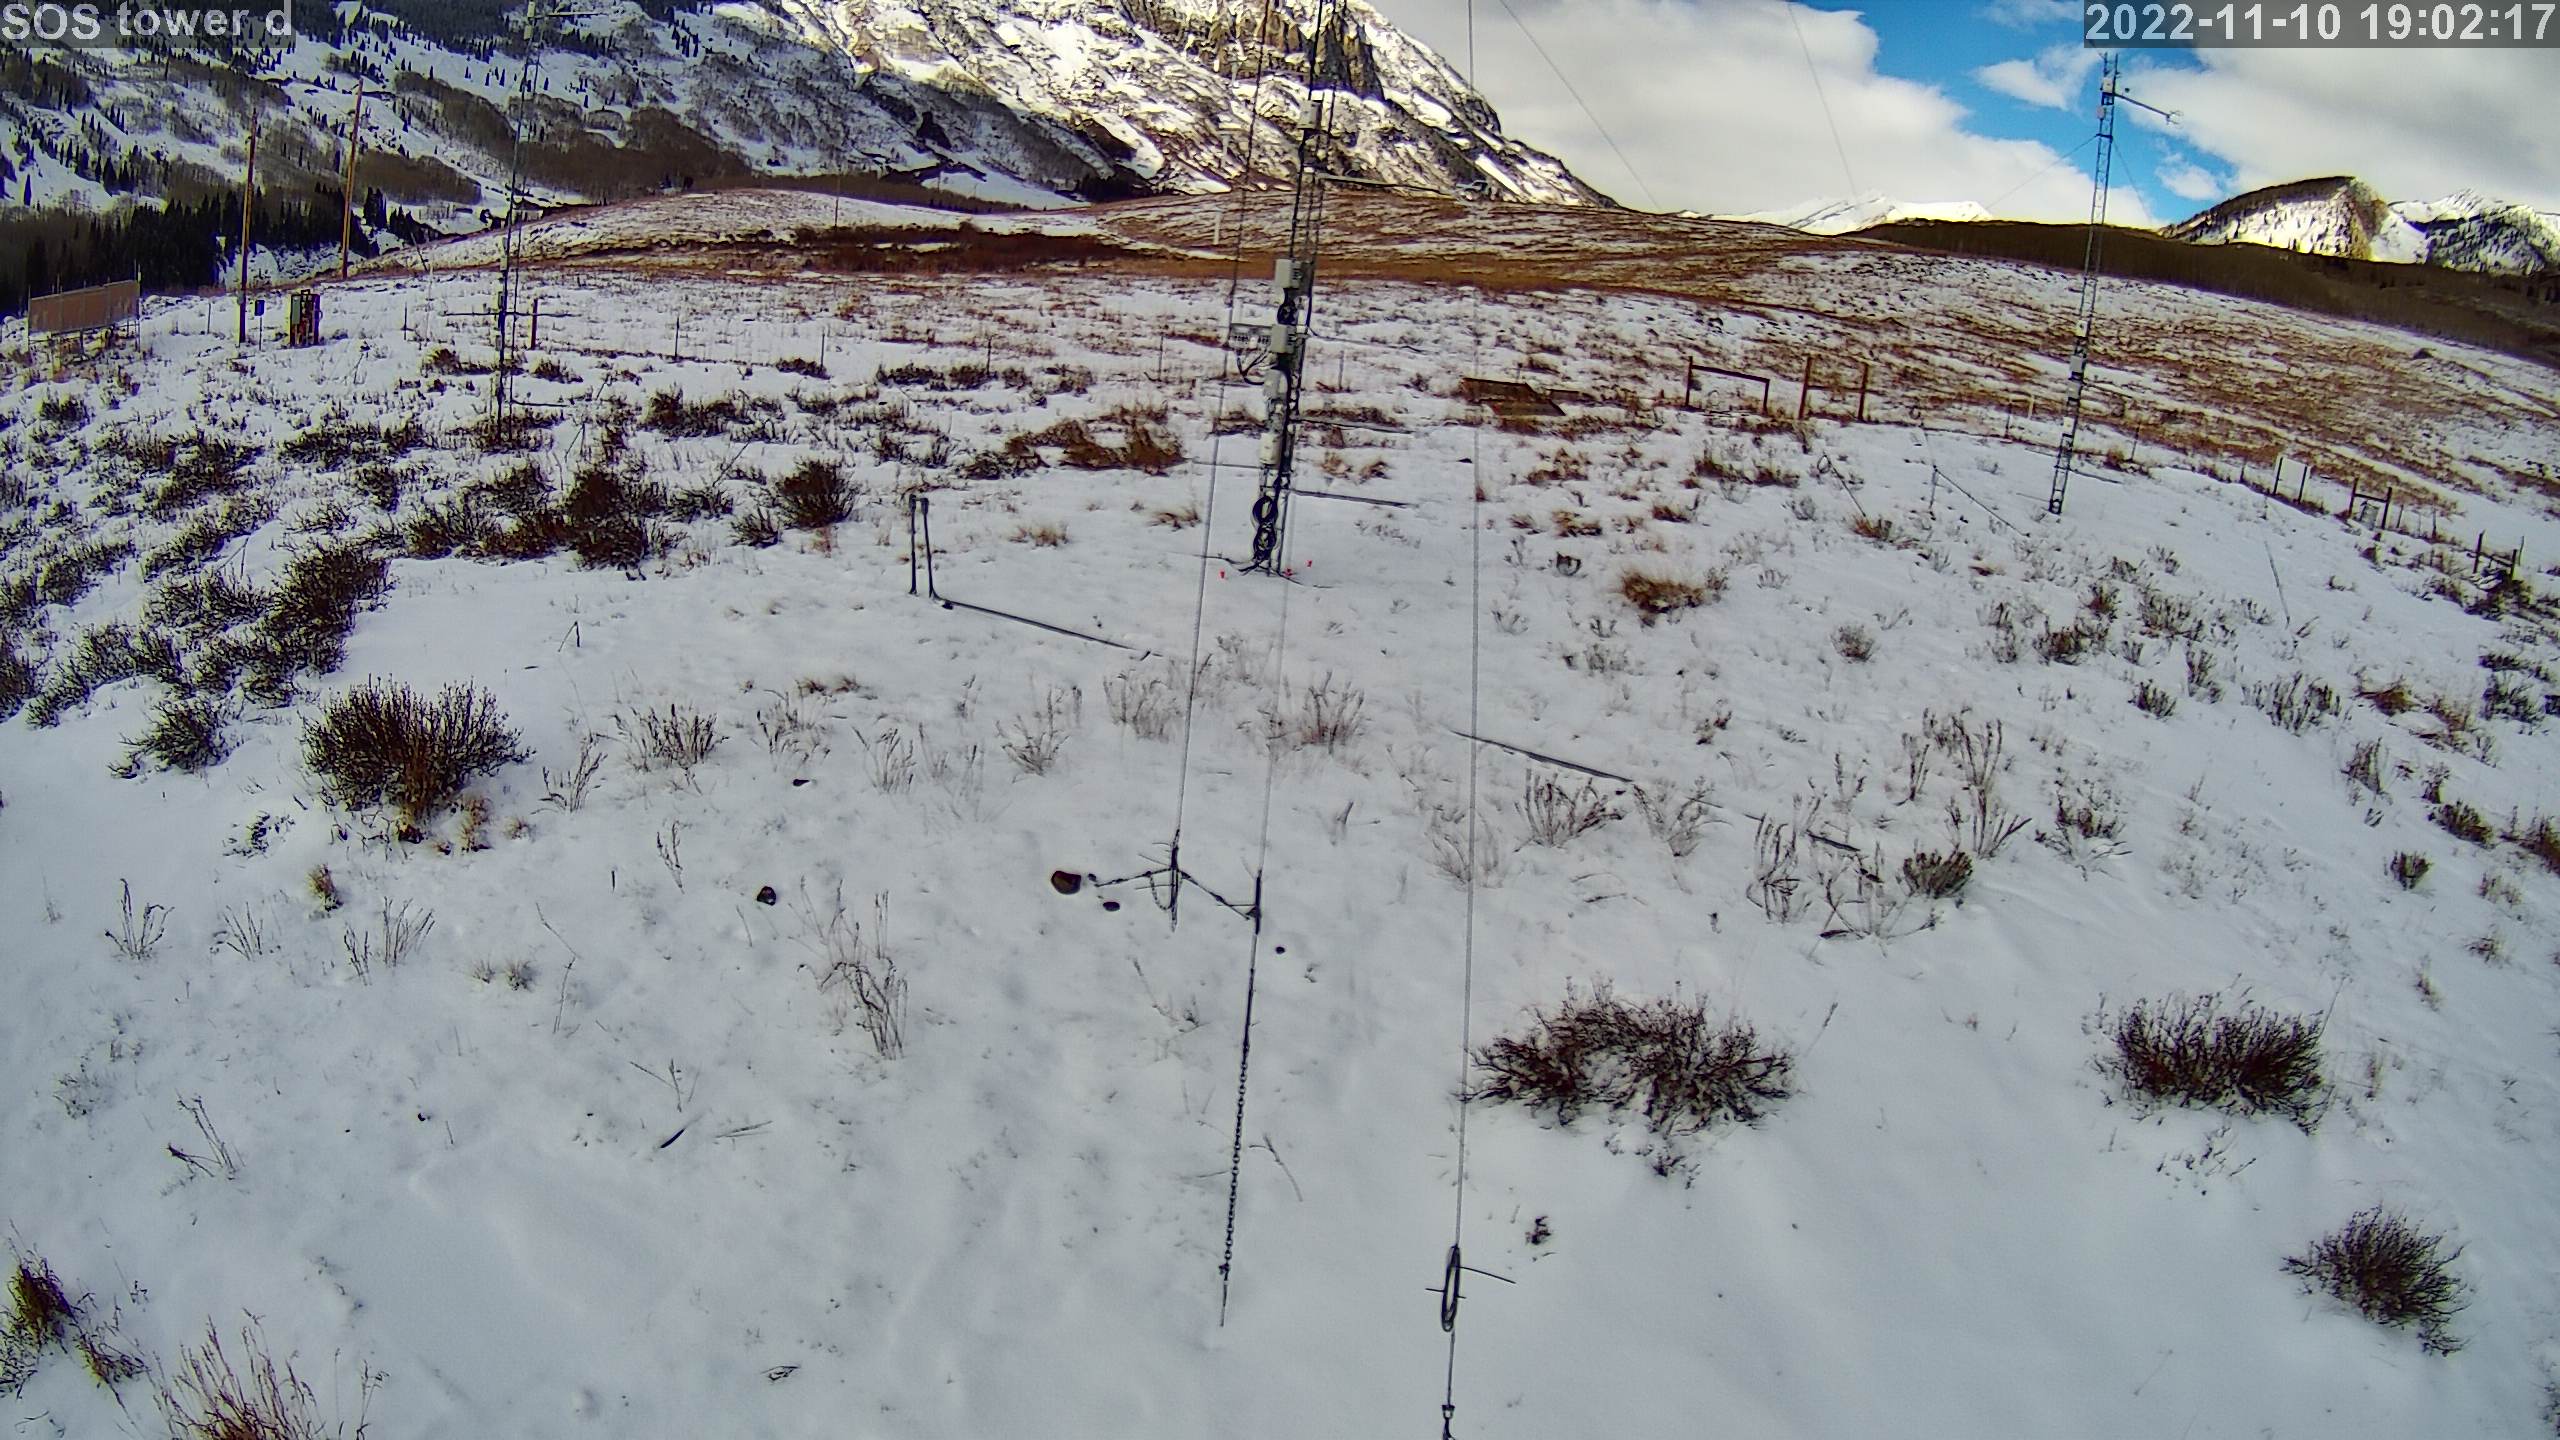
|
photo 202211102002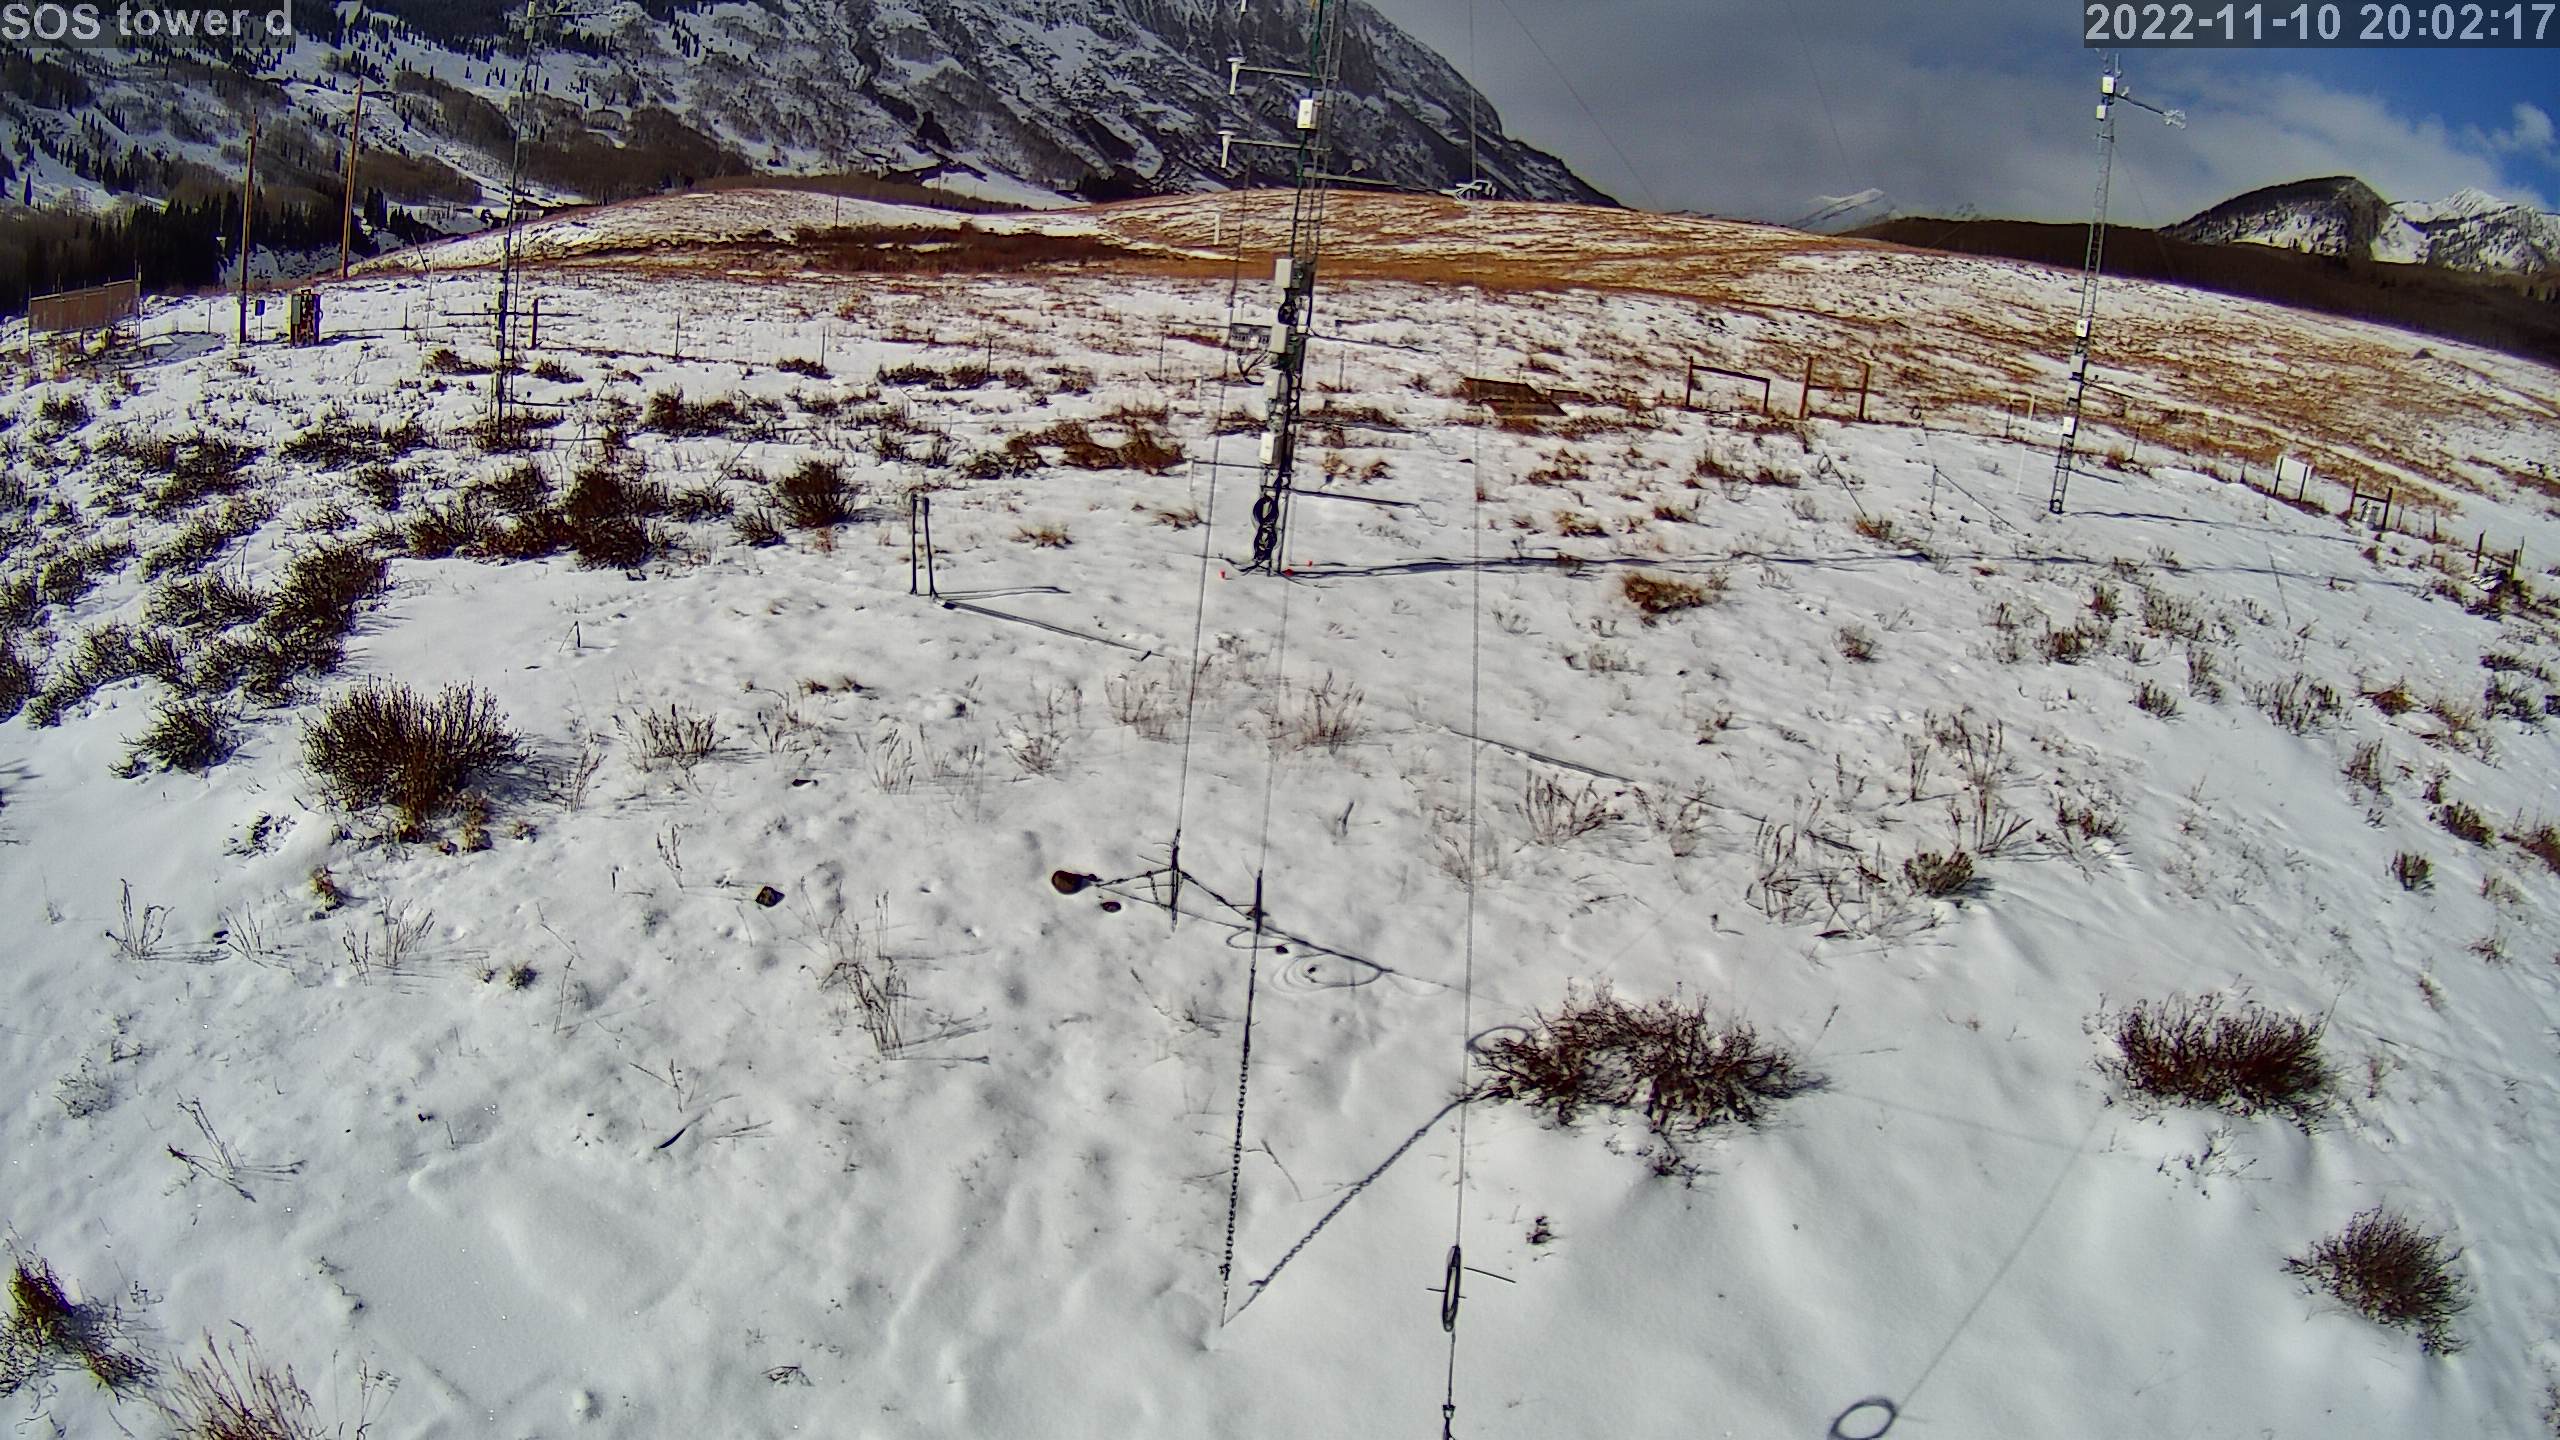
|
photo 202211102102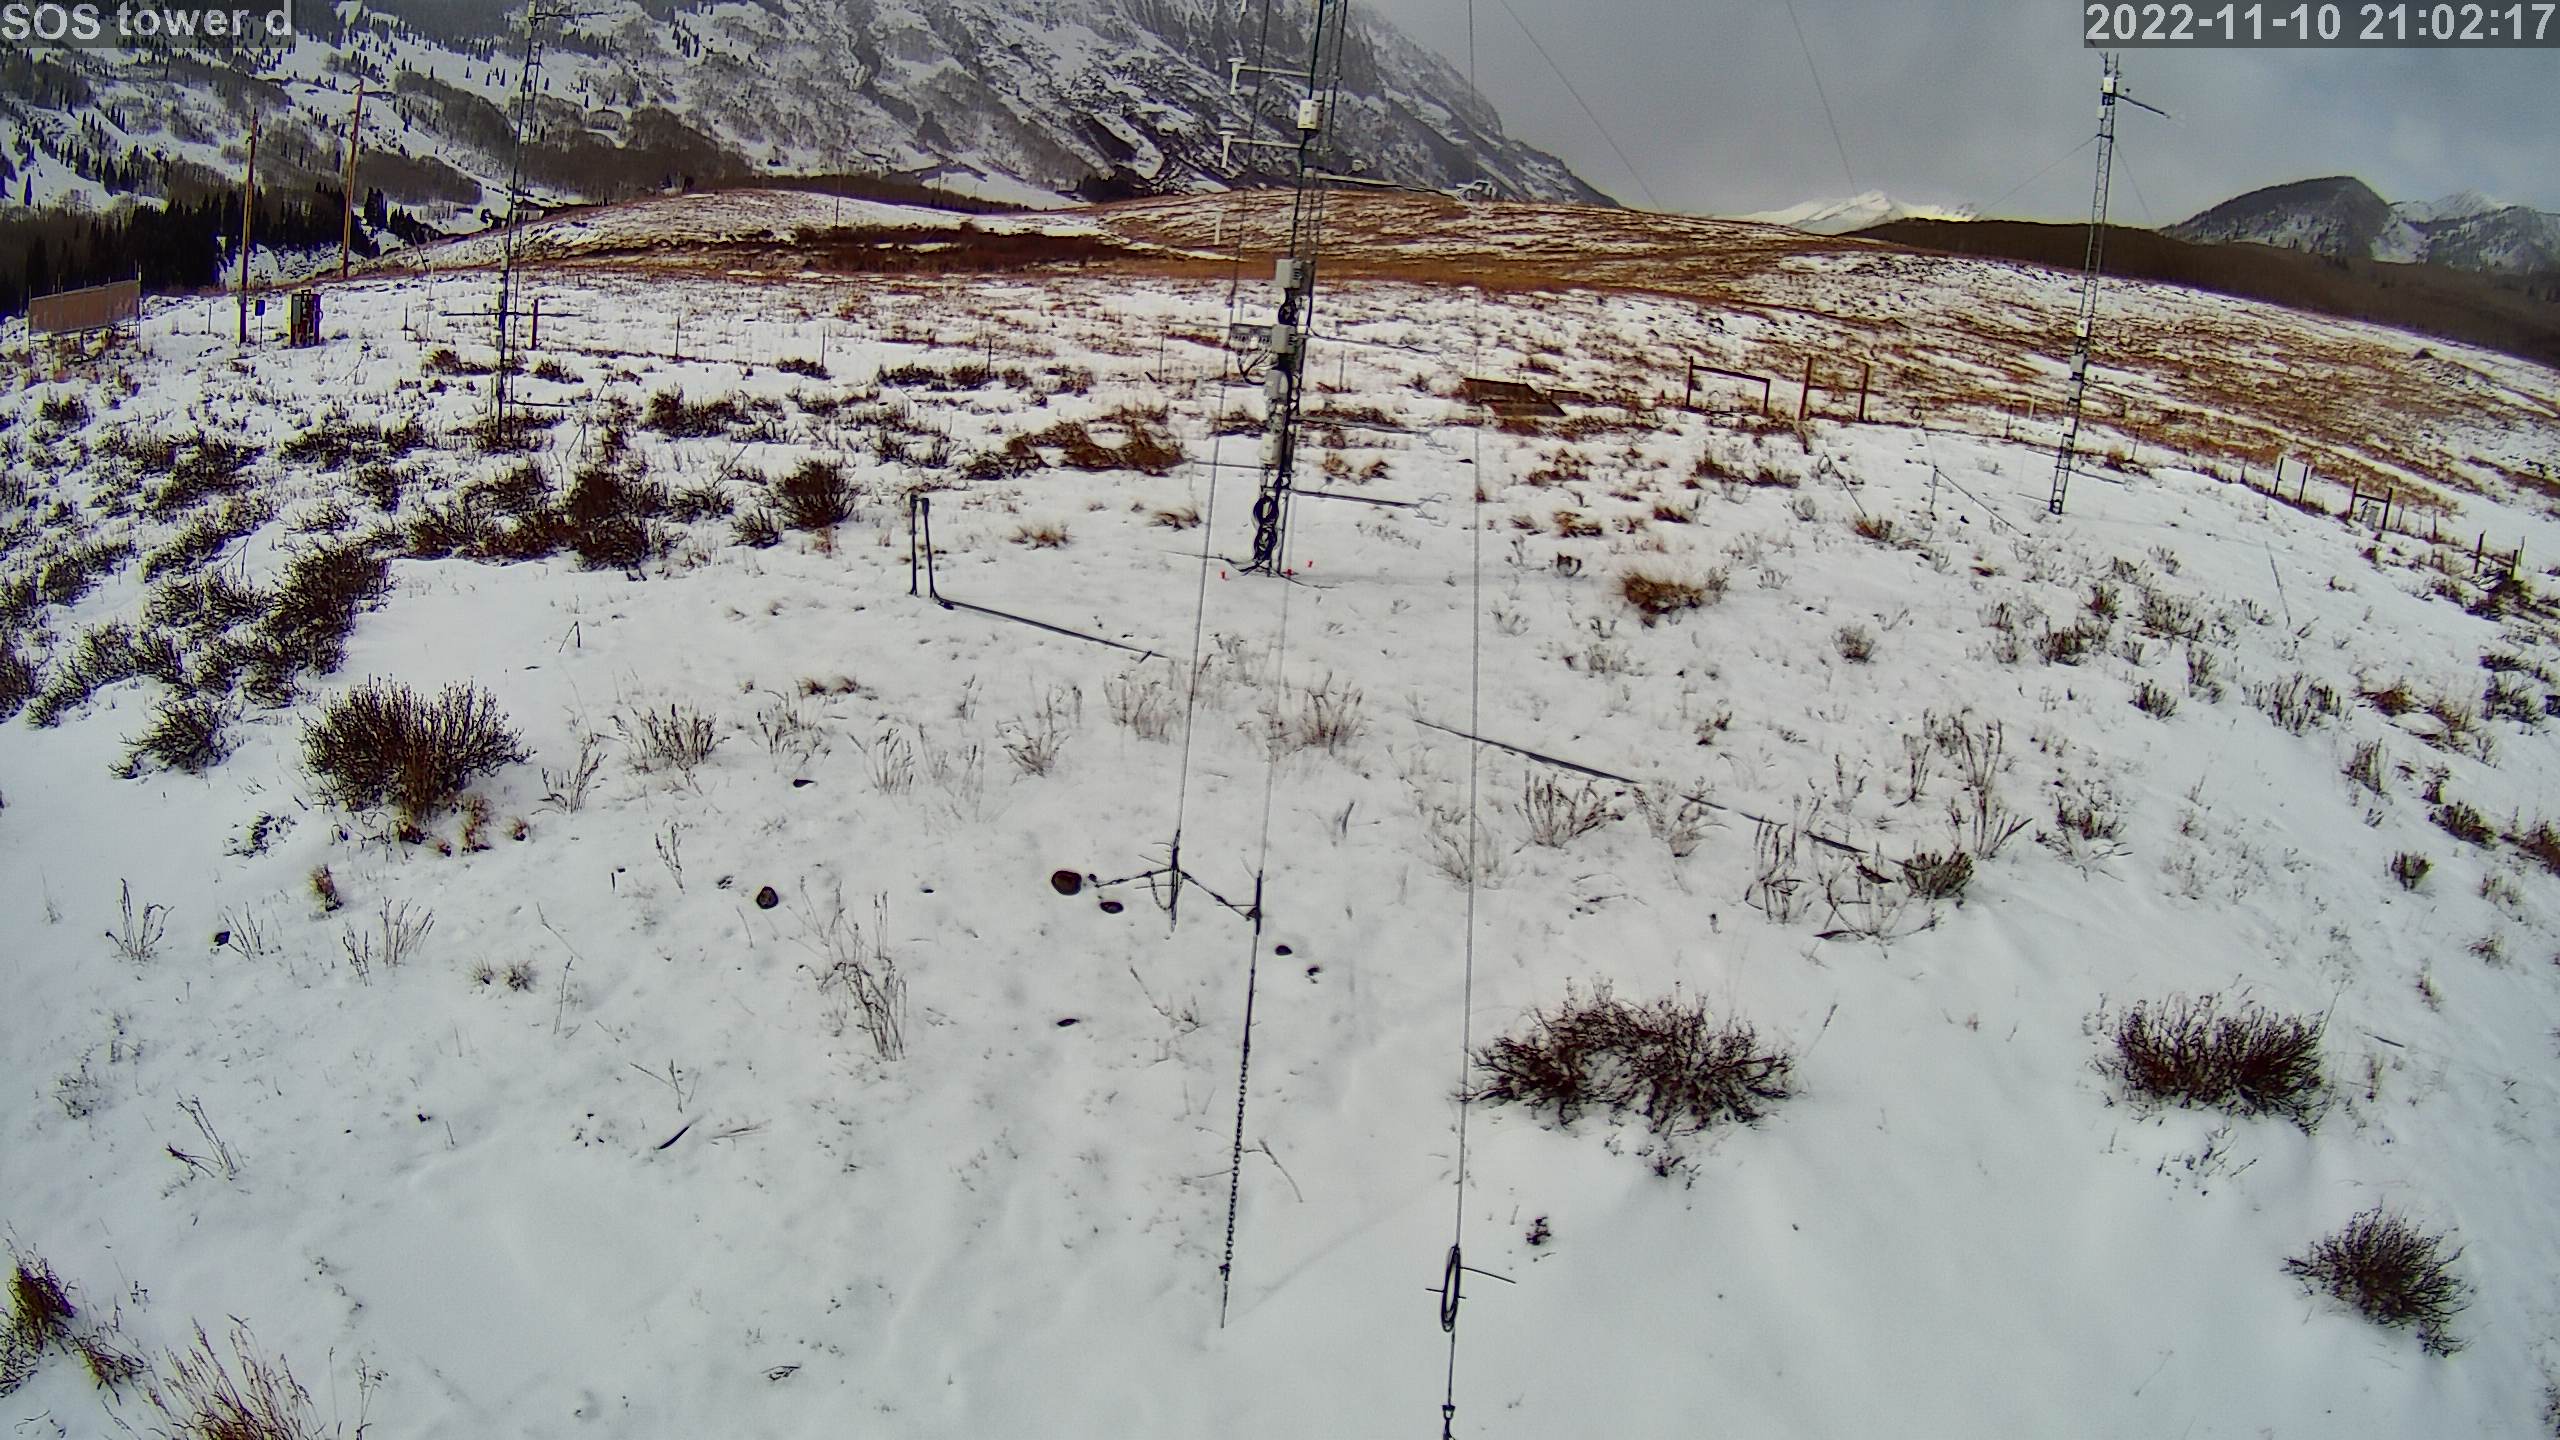
|
photo 202211102202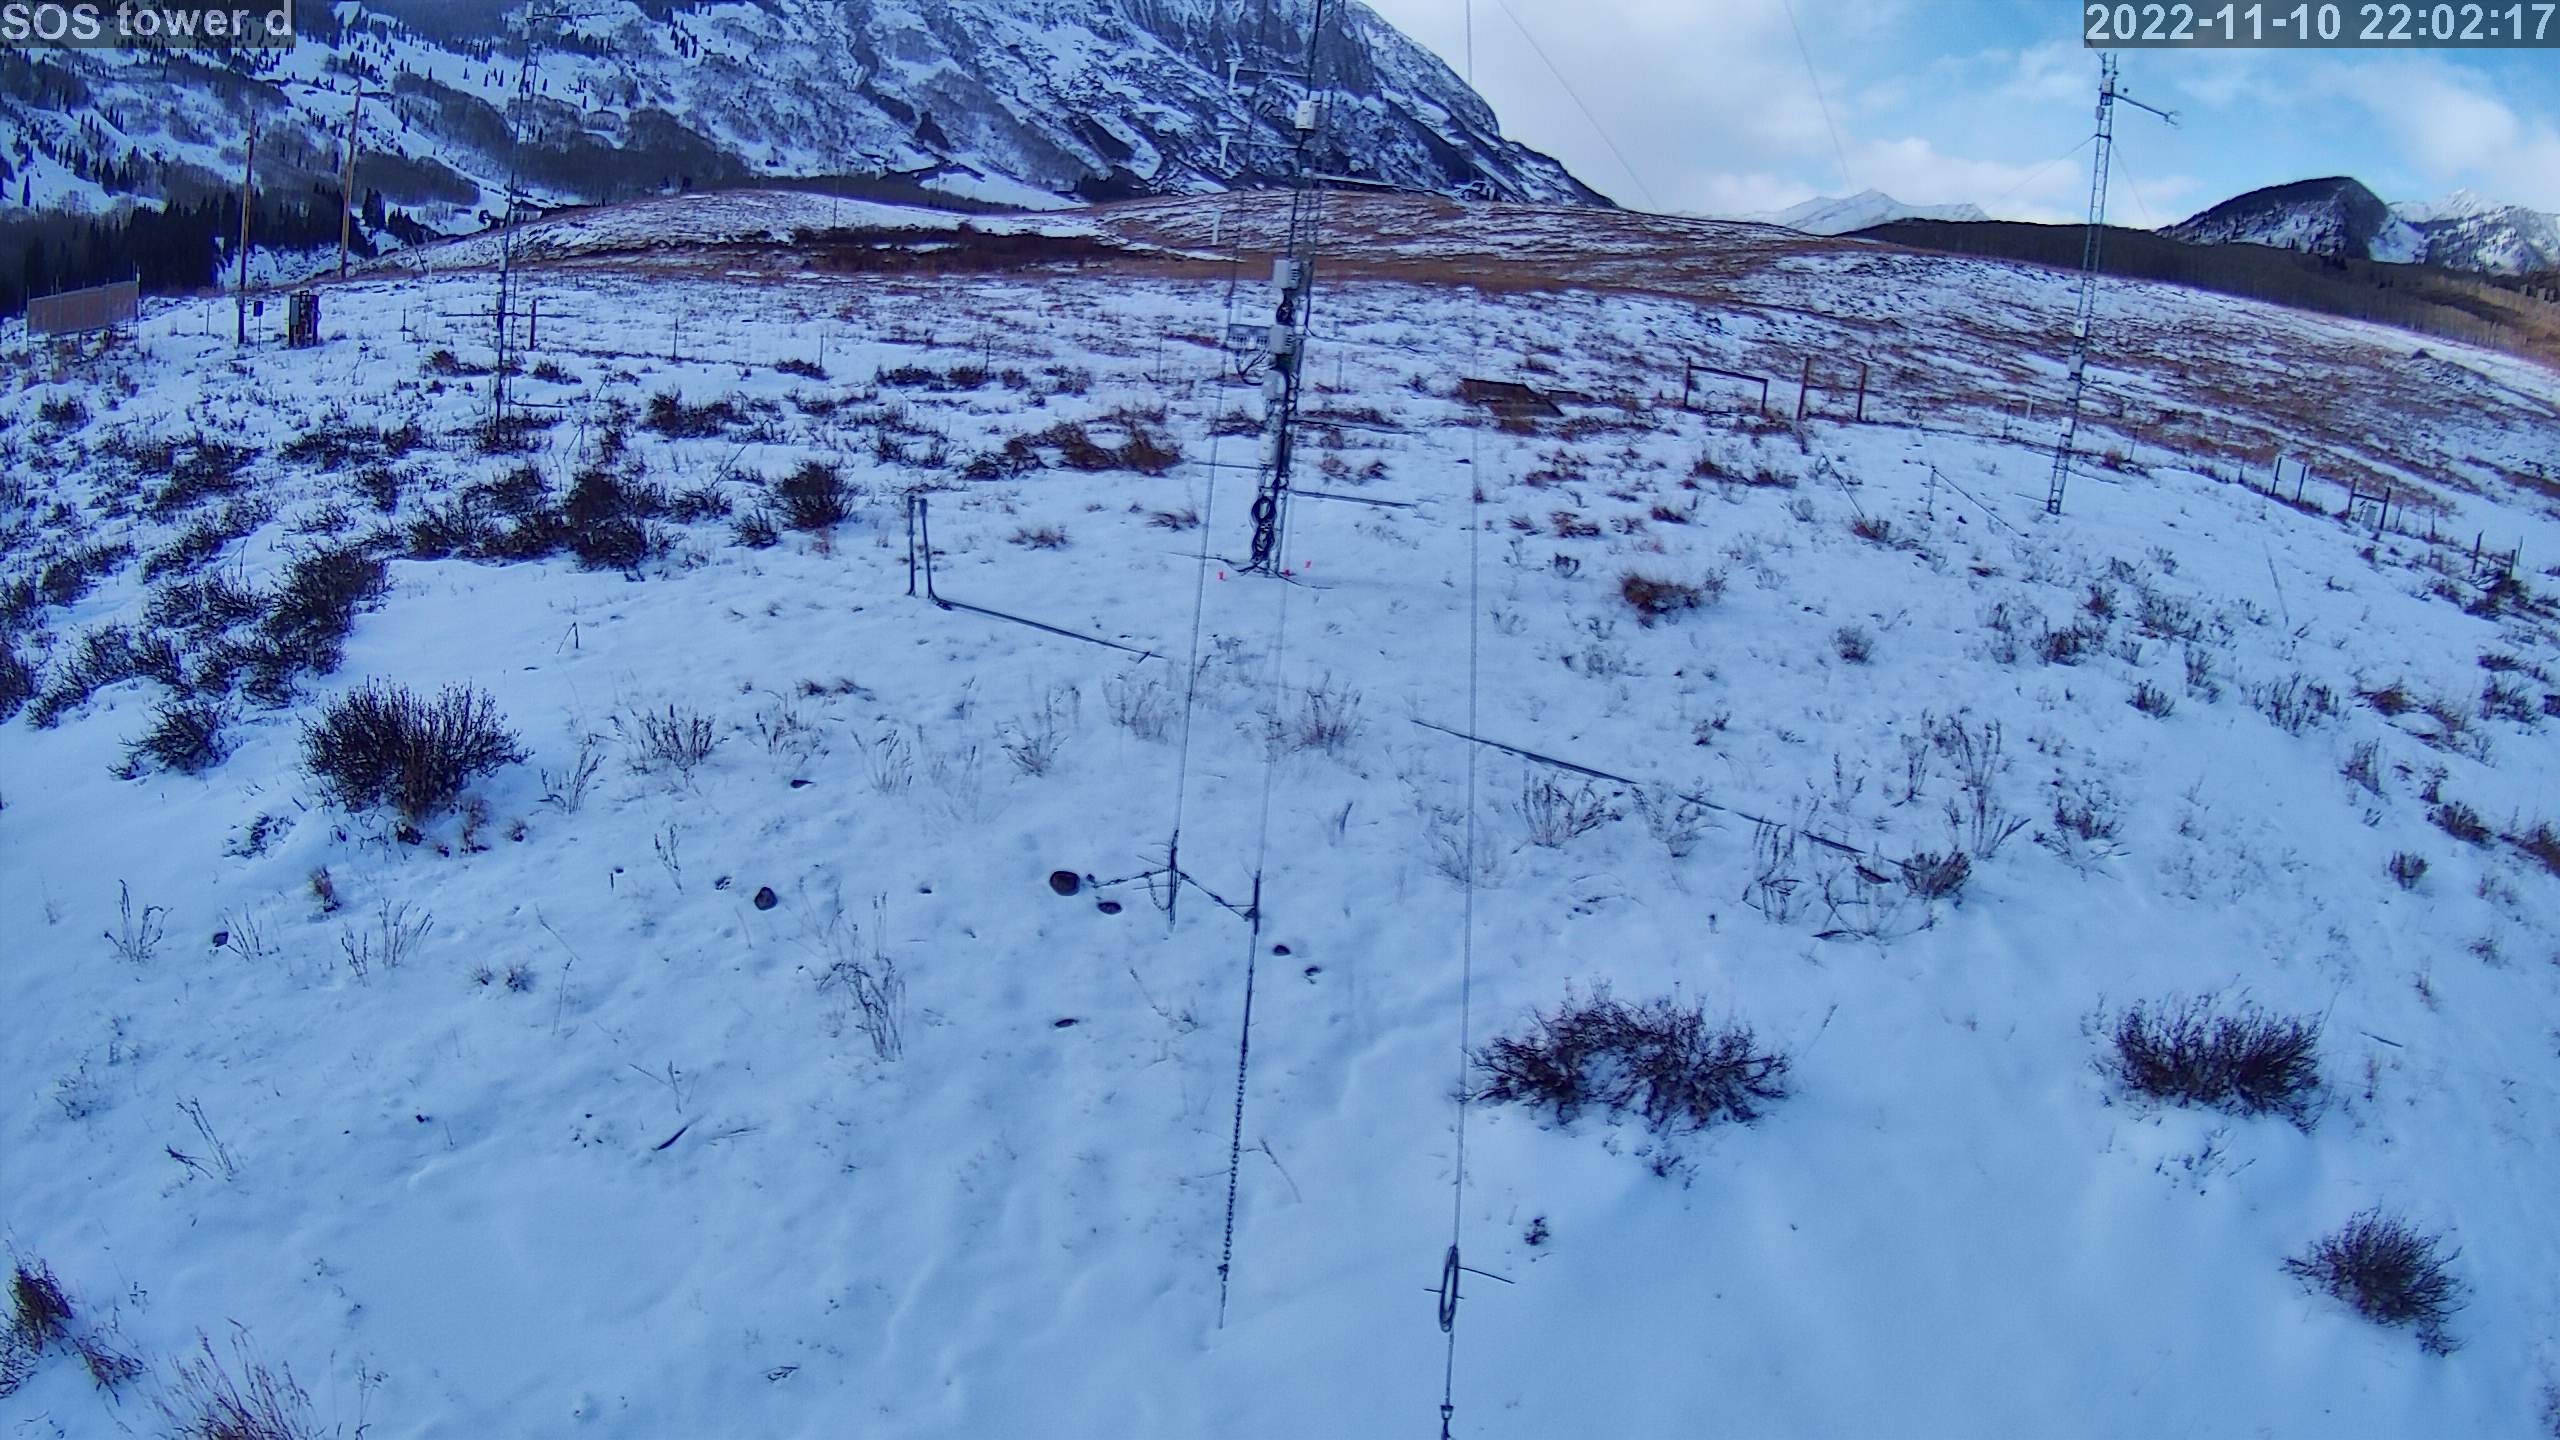
|
photo 202211102302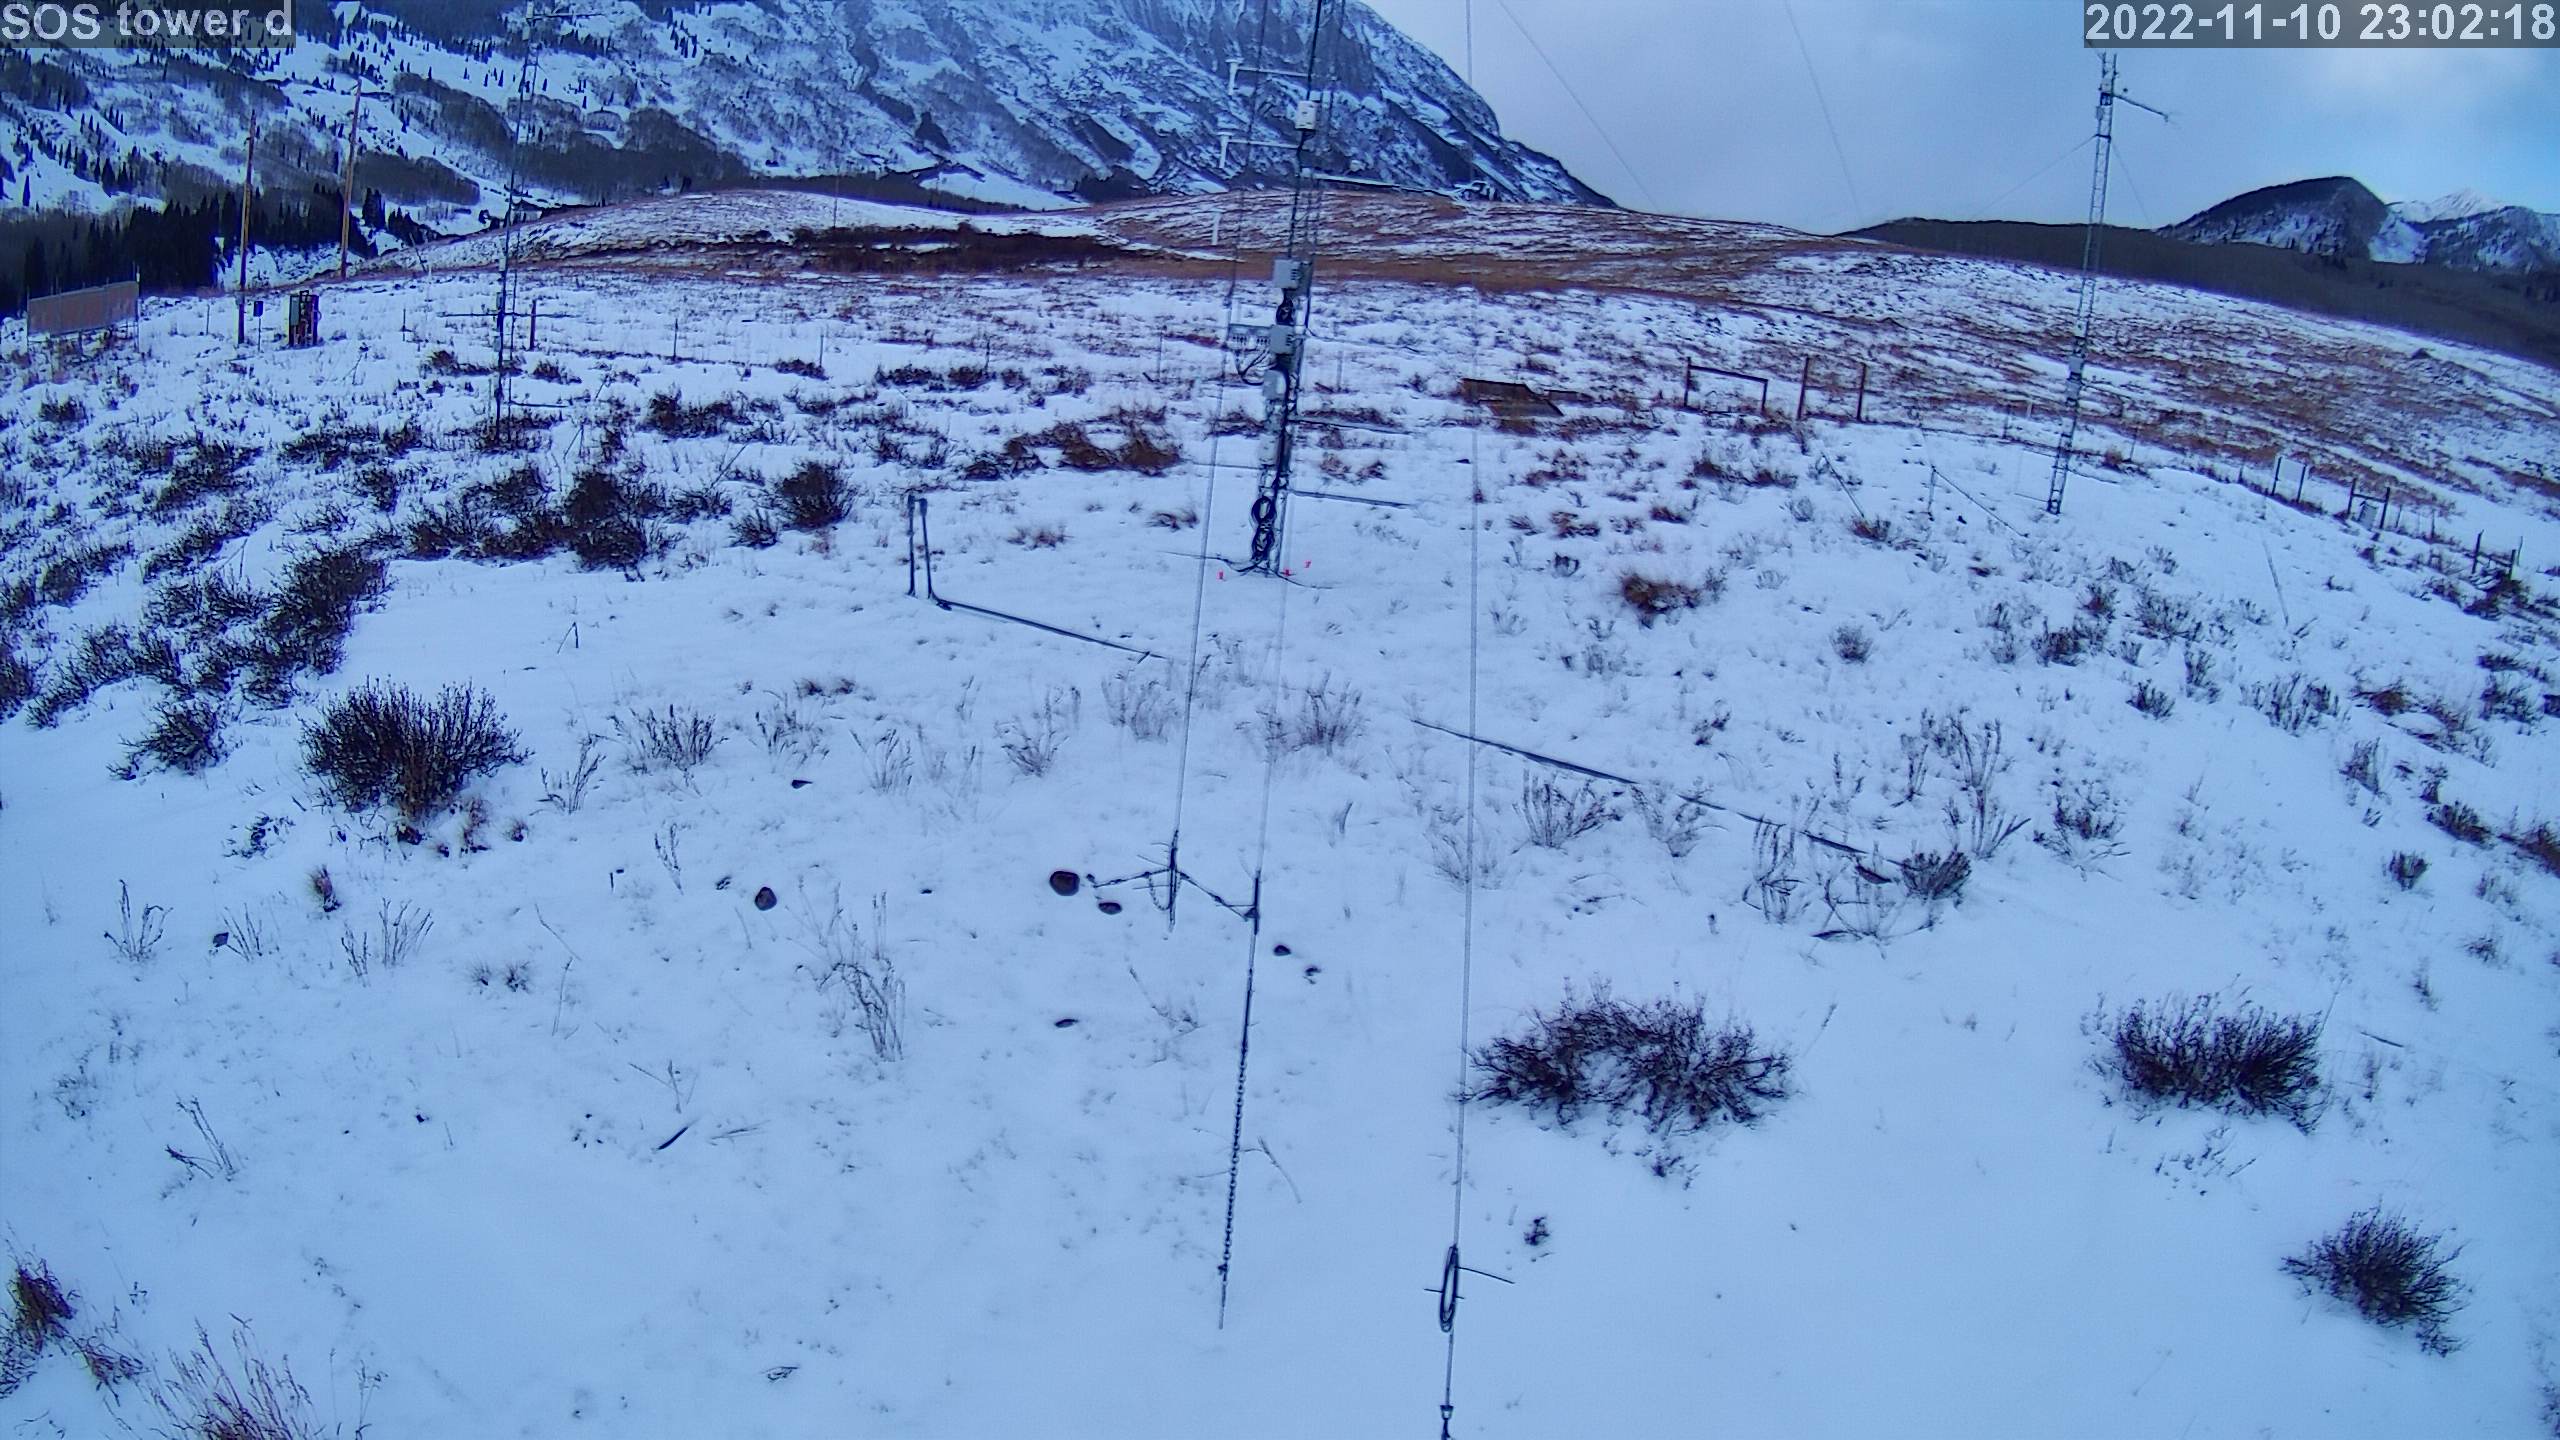
|