


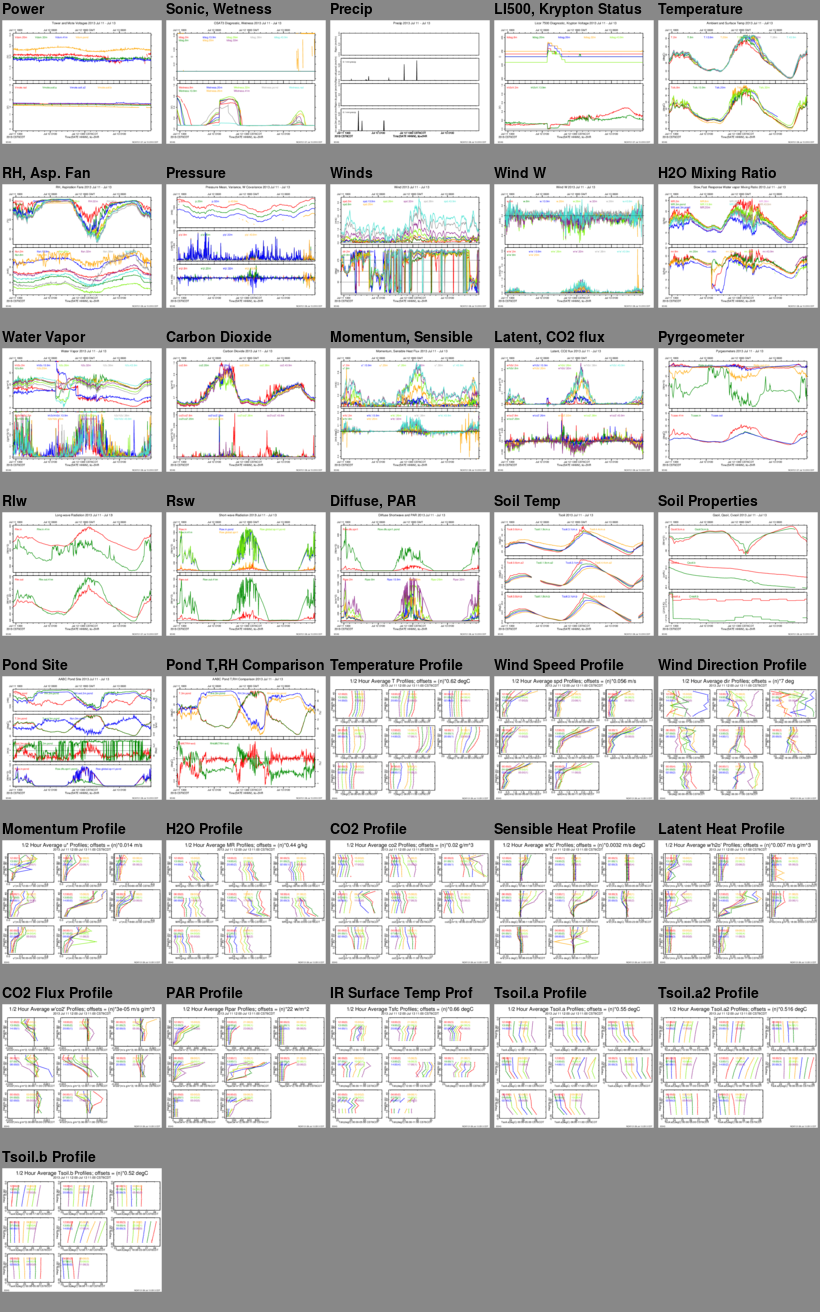
SOAS AABC Flux Tower and Pond Site Daily Plots, Jul 12, 2013
These are preliminary plots of the ISFF SOAS 5 minute statistics for QC purposes.
The data have not been checked or edited. Click on a plot image to expand.
If you right-click on an image, most
browsers will provide a menu to download or display the plot
in another window.
Last modified: Saturday, 13-Jul-2013
© NCAR/Earth Observing Laboratory
NCAR In situ Sensing Facility