| Previous day | Select day | Next day |
The most recent plots are generally updated every 15 minutes. Use the browser reload button to make sure you are seeing the latest version of a plot.
In order to distinquish the traces on the vertical profile plots, a slight offset in X is added to some traces. This is indicated by a "(n)" in the legend for the trace.
If you right-click on an image, most browsers will provide a menu to download or display the plot in another window.
Qprof 20230918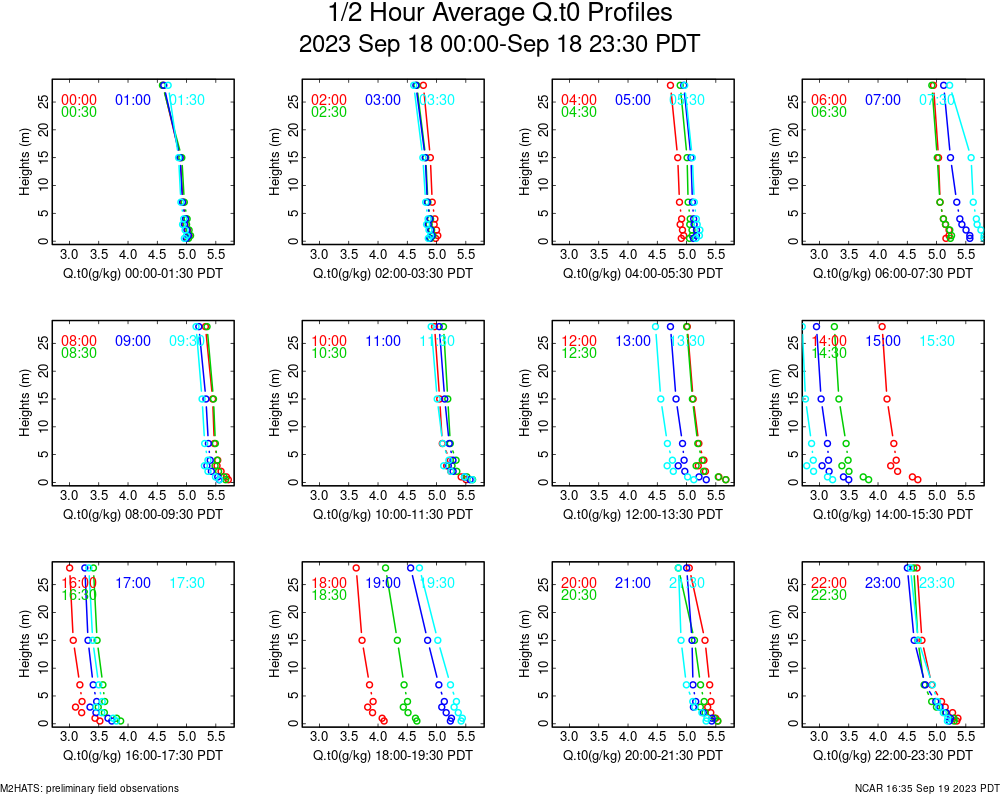
|
TP01 20230918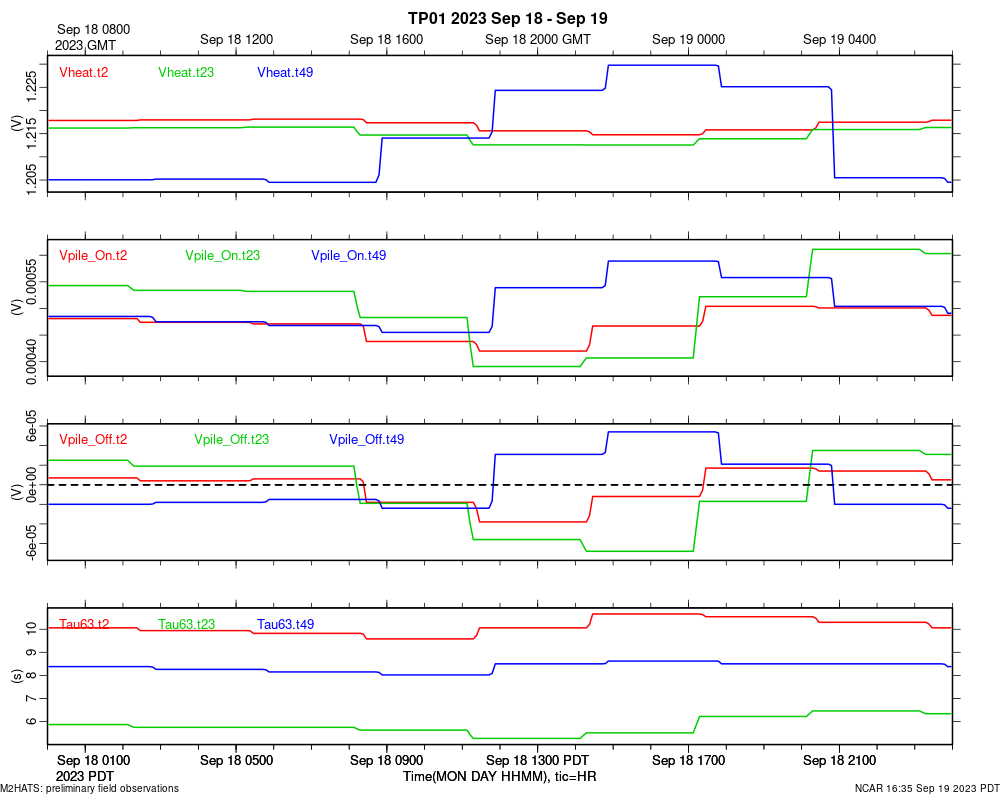
|
Tprof 20230918
|
co2prof 20230918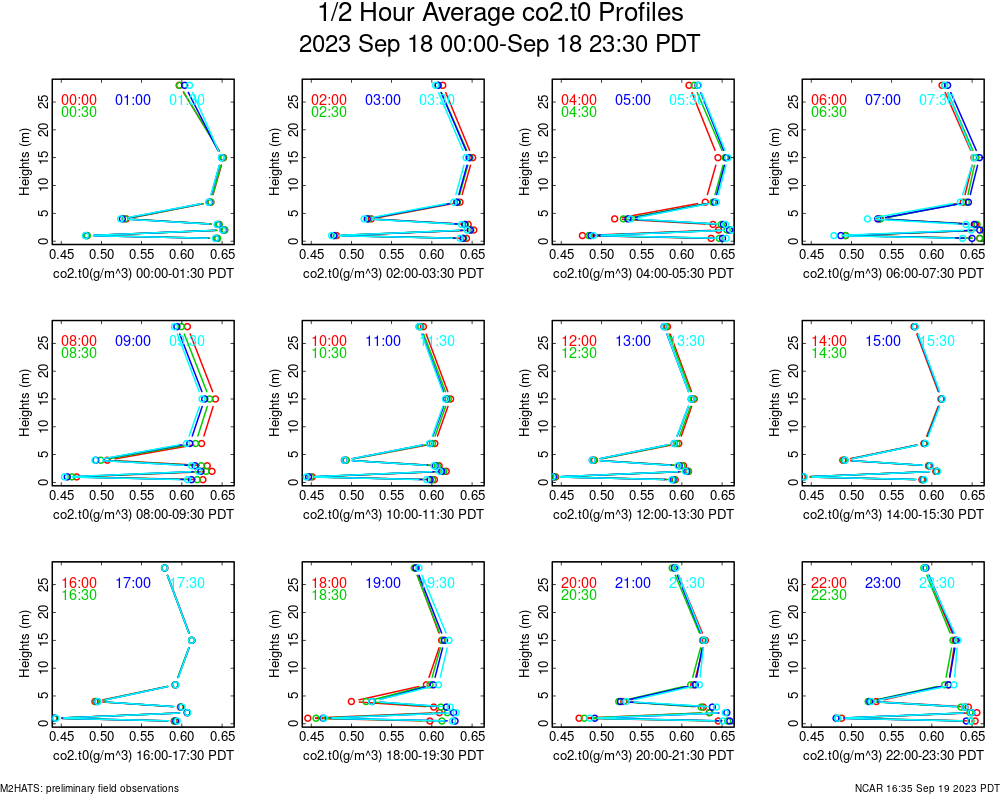
|
dirprof 20230918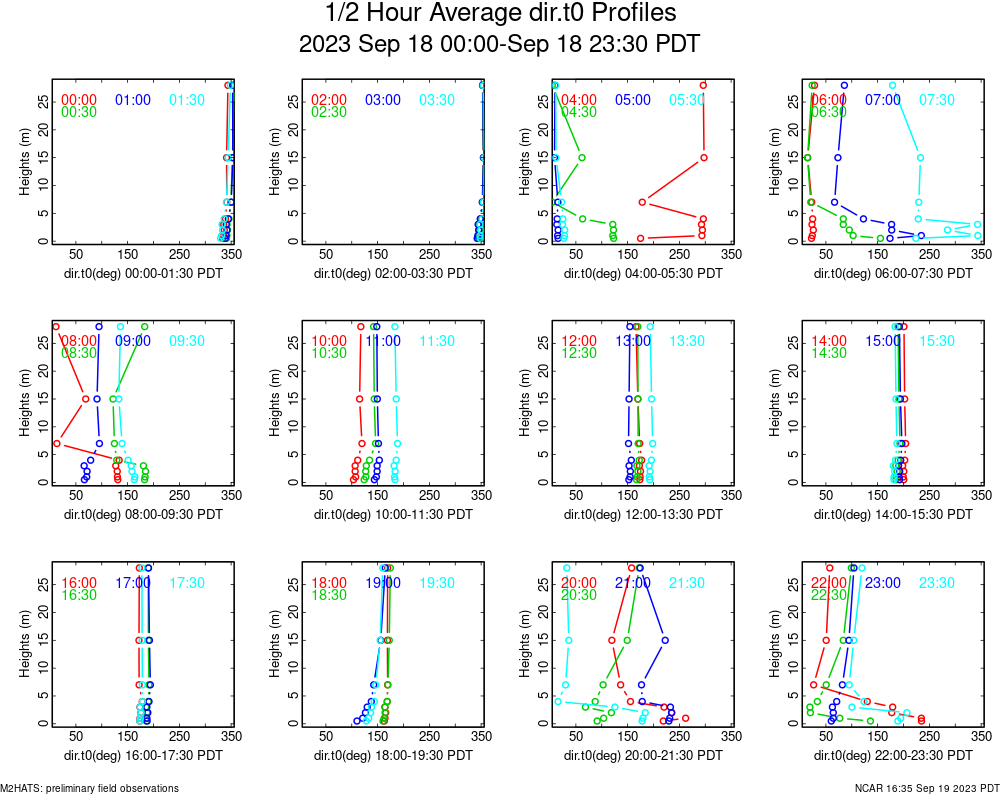
|
h2oprof 20230918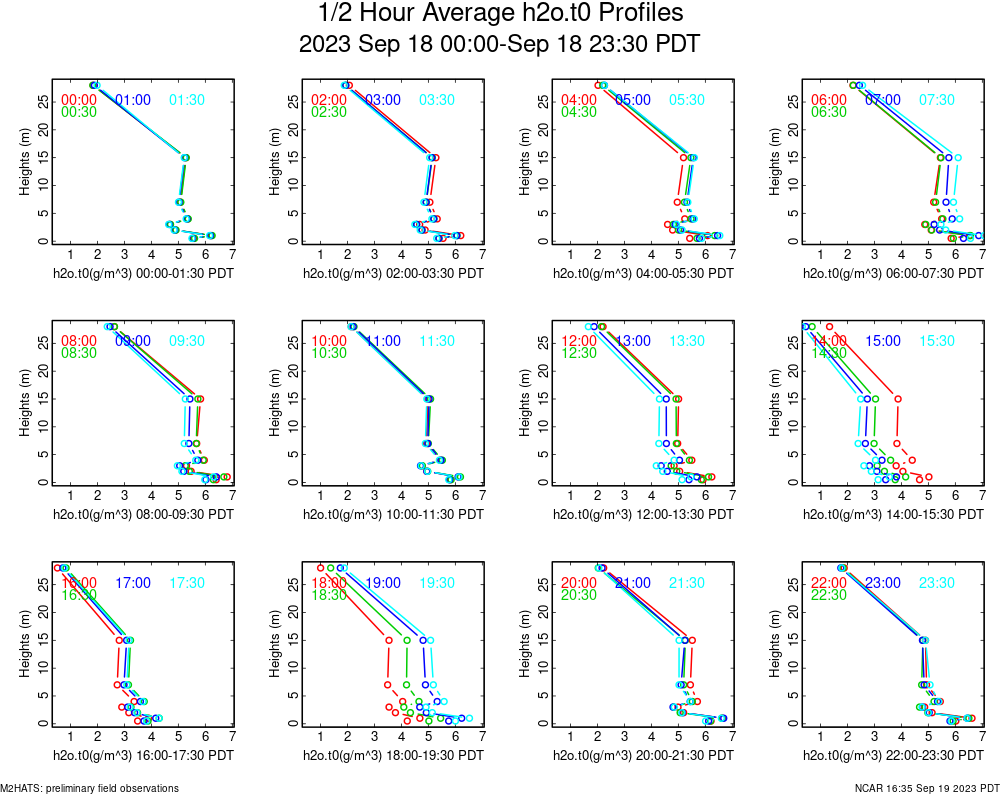
|
soils 20230918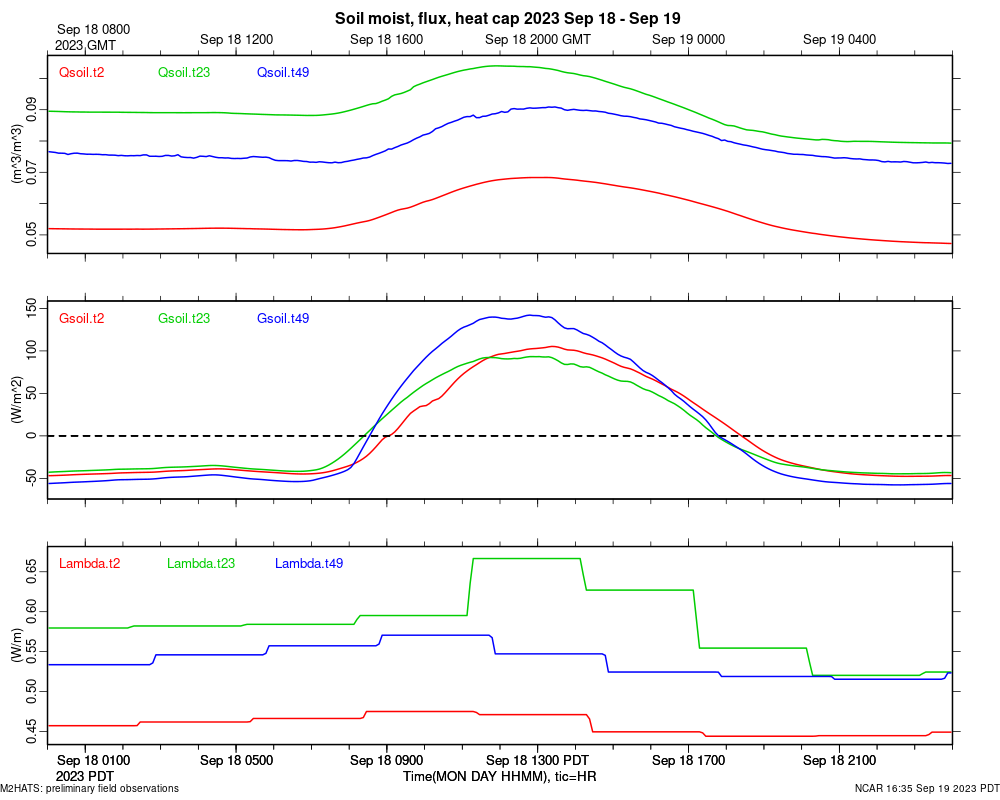
|
spdprof 20230918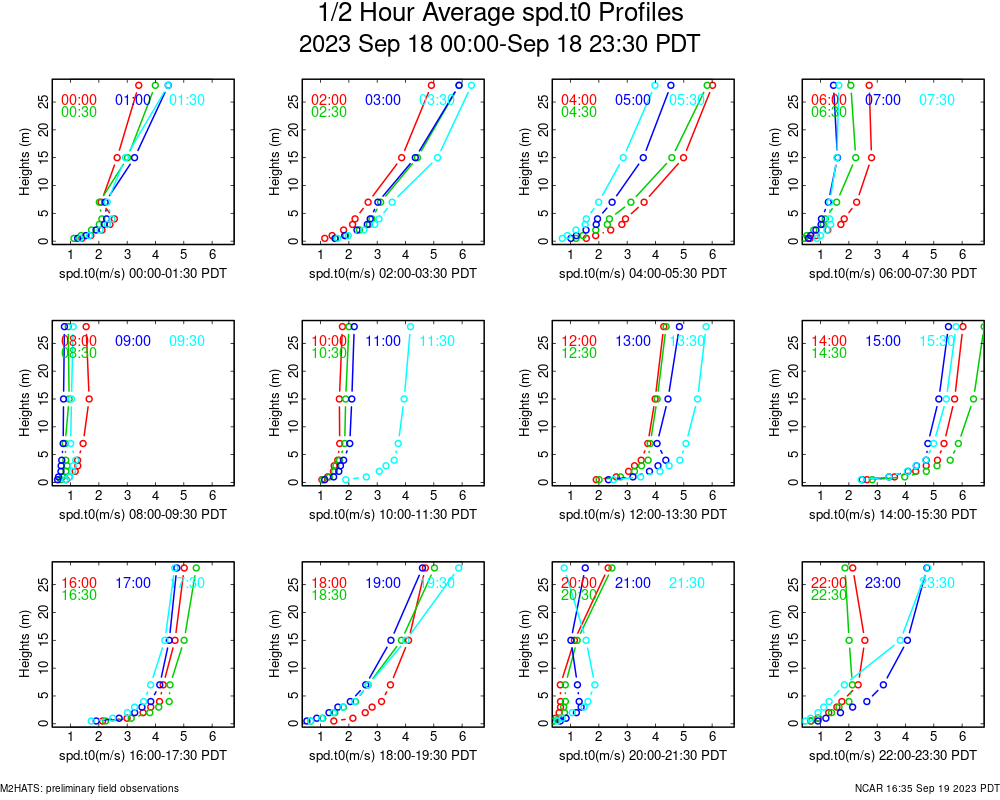
|
ttarray 20230918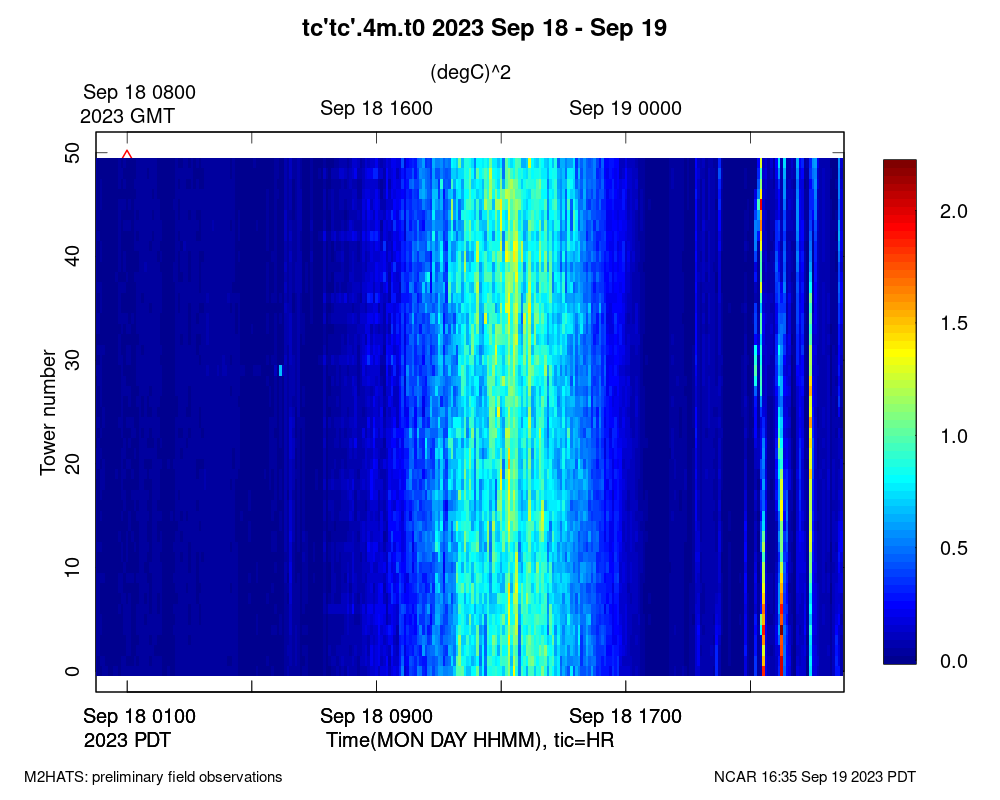
|
uprof 20230918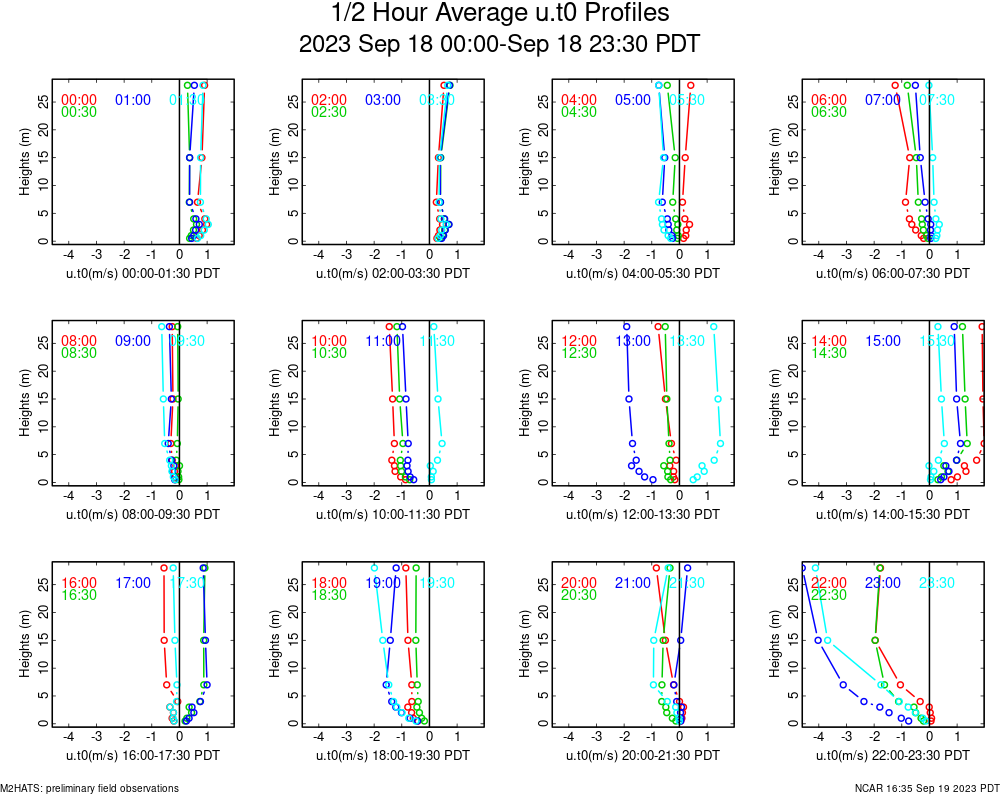
|
vprof 20230918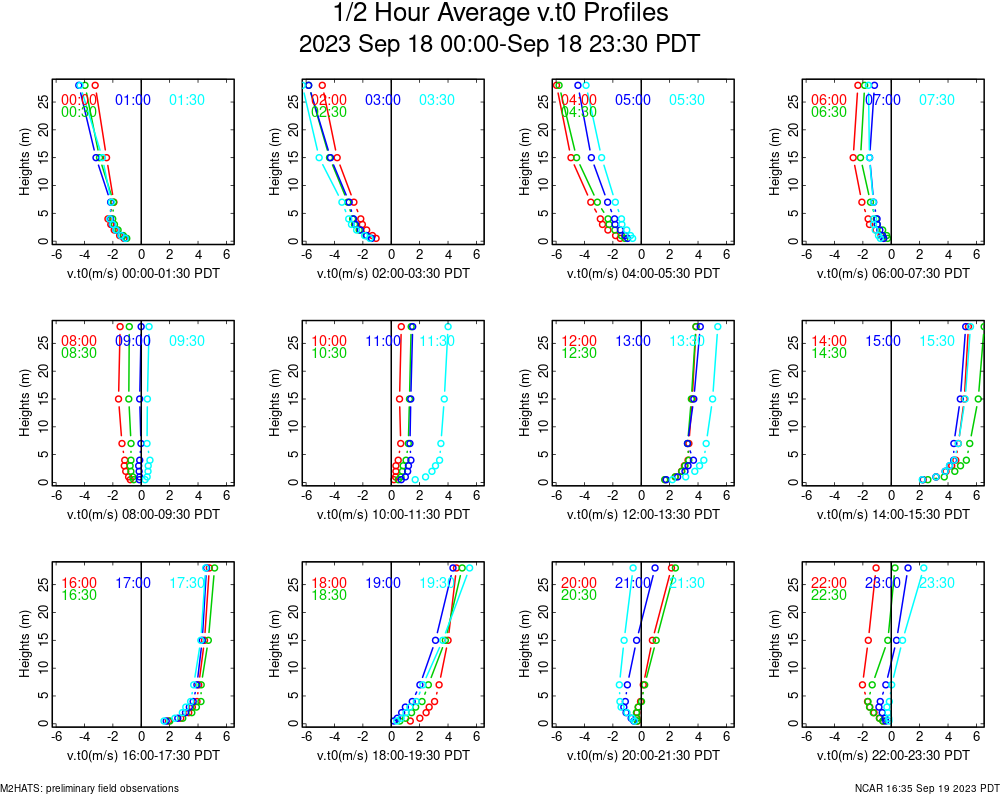
|
weather 20230918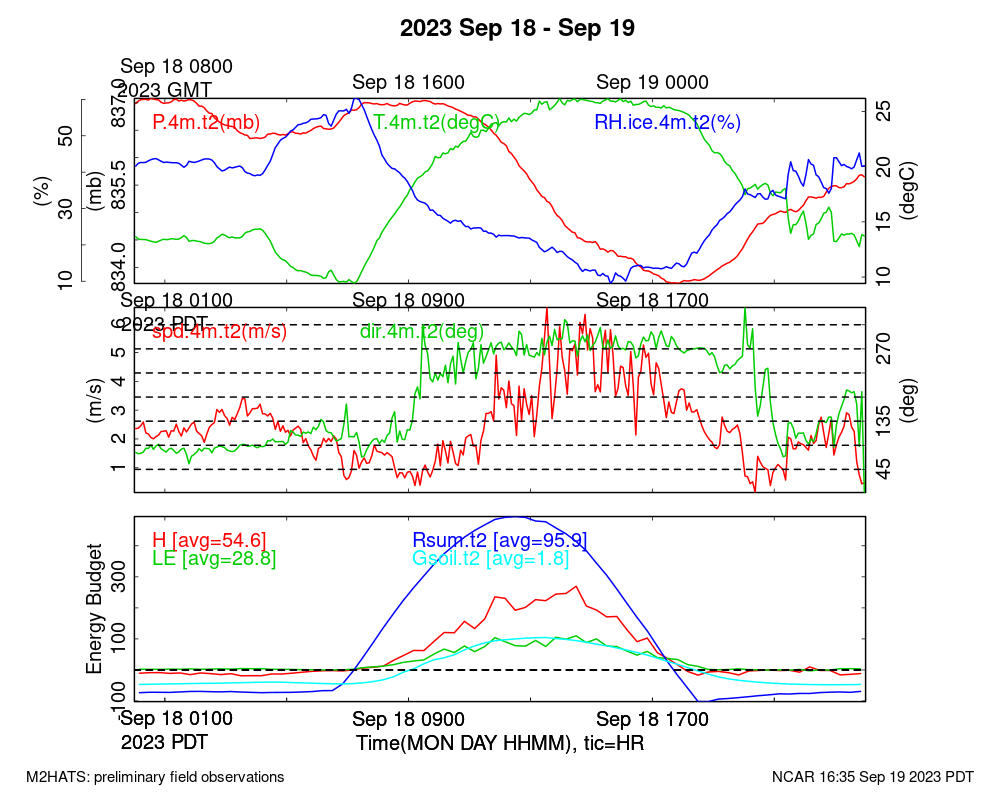
|
wwarray 20230918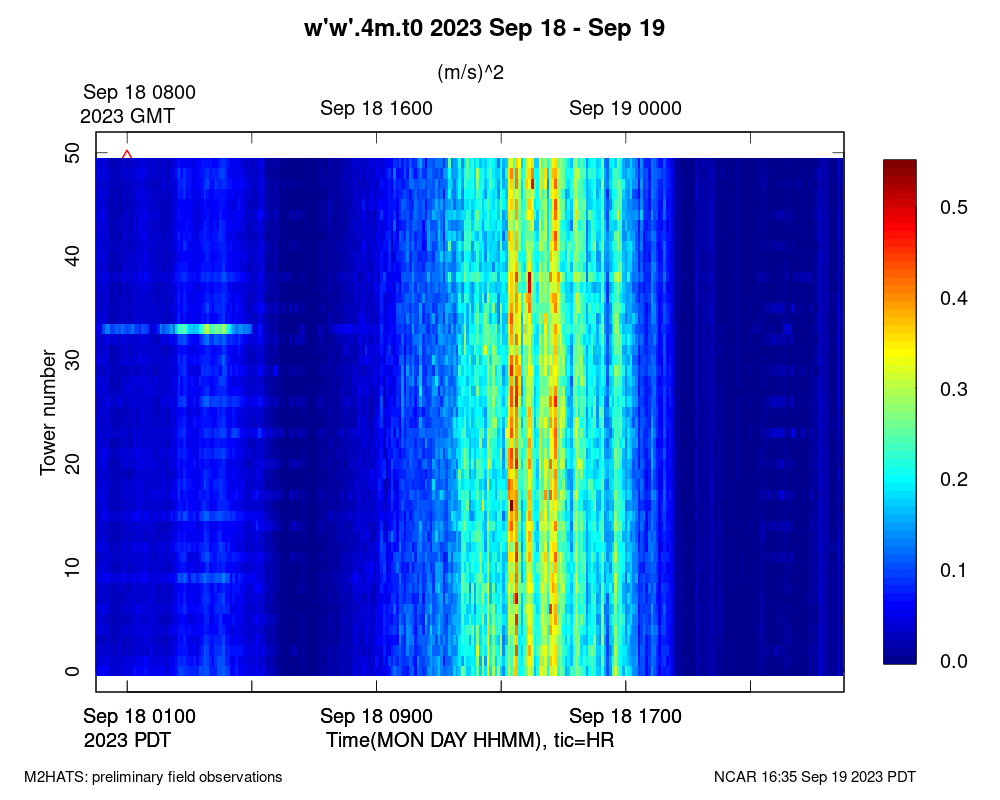
|