Fluxes Over Snow Surfaces (FLOSS)
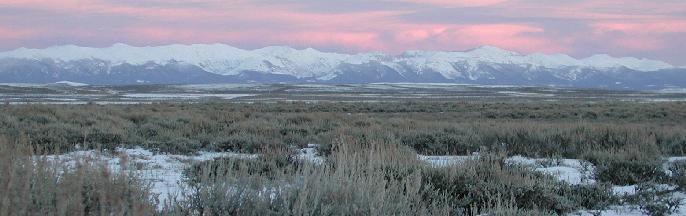
Looking east toward Medicine Bow mountains from FLOSS site.
News
Introduction
This document describes the first phase of the FLOSS project,
which studied the surface meteorology of snow-covered rangeland
in the North Park region of Colorado, near Walden, from December
2001 to March 2002.
The second phase of that project, FLOSSII, is described in a
separate document.
If you reached this page from a search engine, click here to see the full report, with frames.
This document is a standard product of
NCAR/ATD/RTF
and gives an overview of the measurements taken using the
Integrated Surface Flux Facility (ISFF)
and conditions during the FLOSS field experiment.
The ISFF Request
is available to describe the scientific goals and experiment design.
Location
Near Walden, Colorado, in the Arapahoe Wildlife
Refuge near the old Case Ranch.
Through MapQuest.com,
we've obtained an overhead
aerial photograph of this area. A year later, we took oblique aerial photos looking SW
from the NCAR C-130 (A,B).
We've produced a map using Topo
of the site, with tower locations for FLOSS01 and FLOSSII indicated with red
dots. Note that the labels are to the NE of the corresponding dot -- not
necessarily the closest.
I have written a set of driving directions for
the convenience of the many visitors we expect to see! Also, see my
contact list for our phone numbers, etc.
Chronology
The request was modified in August, 2001 to extend the measurement period.
- 9-10 Oct, 2001: 24m tower erected
- 26-30 Nov, 2001: Instrumentation set-up
- 1-15 Dec, 2001: First manned observation period
- 17 Dec, 2001: Third station installed at sagebrush site
- 18 Feb -2 Mar, 2002: Second manned observation period
- 26 March, 2002: Data acquisition systems removed from bare and sage sites.
Radiometers and soil sensors removed from all three sites.
- 1-2 Apr, 2002: Equipment teardown.
- October 2002 Setup begins for FLOSSII
Between the periods of manned observations, data was taken in a minimal maintaince
mode, with short service visits and remote data monitoring.
Measurement Sites
NCAR ISFF sensors were installed at three sites during FLOSS.
24 meter walkup tower
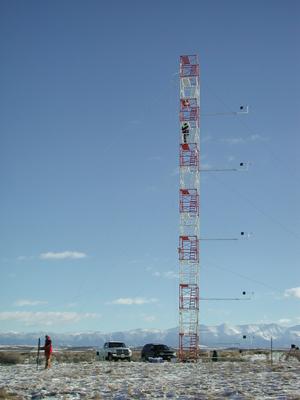
- profiles of mean air temperature and RH at 0.5, 1, 2, 5, 10, 15 and 20 meters
- profiles of mean wind speed and direction at 1, 2, 5, 10, 15 and 20 meters
- barometer
- eddy correlation sensors (sonic anemometer, fast water vapor) at 2, 10 and 20 meters.
The 2 meter level also had two fast CO2 sensors.
- OSU and NCAR MMM also installed 20 thermocouples on this tower from 0.2 to 20 meters.
- nearby radiation stand with up-and-down-looking long and short wave
radiometers, net radiation sensor, and soil temperature, moisture and heat flux sensors
- precipitation and snow depth gauges
bare site
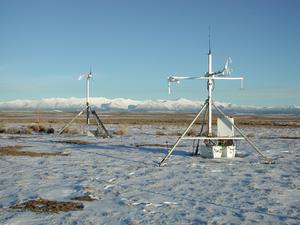
- mean air temperature and RH at 2 meters
- barometer
- one level of eddy correlation sensors (sonic anemometer, fast water vapor) at 2 meters
- Up to Dec 17th, the bare site also had a 4 component radiation stand and soil sensors like the
tower. After Dec 17th the radiation stand was moved to the
sagebrush site, keeping only net radiation and soil sensors.
sagebrush site
Installed Dec 17th.
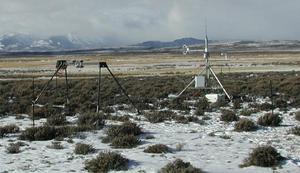
- mean air temperature and RH at 2 meters
- barometer
- one level of eddy correlation sensors (sonic anemometer, fast water vapor) at 2 meters
- 4 component radiation stand and soil sensors like the tower.
Site Locations
| Site
| Latitude (N)
| Longitude (W)
|
| 24 meter tower
| 40° 39' 32"
40° 39.53'
| 106° 19' 26"
106° 19.43'
|
| bare
| 40° 39' 56"
40° 39.93'
| 106° 19' 11"
106° 19.18'
|
| sagebrush
| 40° 40' 11"
40° 40.18'
| 106° 19' 3"
106° 19.05'
|
Sensors
The layout of the sensors on the 24 meter tower and bare/sagebrush sites is shown
here (and PostScript version).
OSU also had a hot-film and a 3-D sonic anemometer close to the
surface near the SE guy wires of the 24m tower. OSU also deployed 2-D
sonic anemometers and thermocouples to the west of the 24m tower.
Contact them for these data.
Sonic Anemometers
These were all Campbell CSAT3 anemometers, which generally performed
well. They were all nominally on booms pointing to the West. The
bare sonic was lowered from 2.9 to ~2m on 2 Dec 2001.
Krypton Hygrometers
Krypton hygrometers were used for water vapor fluctuation
measurements. Like in FLOSSII, they probably went offscale frequently
due to ice fog. Also, the wiring in the electronic boxes became
corroded due to moisture infiltration in the middle of this project,
which I think is indicated by a diurnal variation in the offset with
respect to the T/RHs.
The kryptons were mounted horizontally, with the sensing volume almost
directly underneath the front of the junction box of the sonic arms,
and even with the bottom arm of the sonic. This is far enough
displaced that any flux data should be corrected. The source tube was
usually mounted to the North, to avoid having the detector view the
sun, however this was switched (only at the sage site?) for a period
of testing when we were trying to figure out the problem which turned
out to be corrosion.
CO2 sensors
NCAR deployed a LiCor 6251 CO2 sensor with an inlet tube near the 2m
sonic anemometer at the 24m tower. It ran from 1 Dec 2001 to 1 Apr
2002. Three different pairs of calibration gases were used to
characterize its calibration. The "low cal" cylinders typically
lasted for 3 weeks and the "high cal" cylinders lasted for about 6
weeks (apparently, there was a small leak on the "low cal" side), so
there are periods when there were 0, 1, or 2 calibration gases.
The sensor was calibrated using the procedure developed for FLOSSII,
which fits the analyzer output V to CO2 density computed using the
cylinder concentration M, analyzer pressure P and temperature T, V =
a1 + a2*M*P/(T+273.15) + a3*P. During FLOSS01, the pressure in the
analyzer was not monitored, so the nearest atmospheric pressure sensor
(at the base of the 24m tower) was used instead. (The data from this
barometer were corrected for temperature -- see below.) Since
P/P_atmos is a function of flow rate and the flow rates were adjusted
when the calibration gases were changed, separate calibrations were
made for each calibration gas pair. The fits are:
                                a1          a2         a3
1 Dec 2001 to 4 Jan 2002:  -0.07692321 0.001657638 0.0007069289
4 Jan 2002 to 20 Feb 2002:  0.3992281  0.001586562 0.0001679215
20 Feb 2002 to 1 Apr 2002:  0.1187805  0.001498741 0.0005661472
A plot of these fits is shown here, where "mpot" is
M*P/(T+273.15) and "mpotc" is (V-(a1 + a3*P))/a2.
OSU also deployed a LiCor7500 open-path sensor from 10 Dec 2001 - 27
Feb 2002. This particular sensor was an early production unit which
had a light leak. Thus, the data have a diurnal cycle artifact.
Propeller-vane Anemometers
The prop-vanes were mounted pointing South from the South side of the
24m tower, to measure velocity profiles. We had several failures of
these sensors during FLOSS01 due to icing-related propeller breakage
and electronics which caused either the chopper wheel (wind speed)
counts to read zero or the encoder (direction) to read constant.
Electronics, propellers, vanes, and processors were all swapped at
various times with various sensors. By the end of the project, we no
longer had spare parts, so the top? sensor was not used. (For
FLOSSII, we used only sonic anemometers for both flux and velocity
profile measurements.)
T/RH Sensors
The data from the T/RH sensors generally were good, though we had the
usual fan outages during the project and inlets probably were clogged
with ice/snow from time to time.
Barometers
We had our standard barometers at each site. The bare and sage sites
both had Vaisala PTB220 sensors which work fine. The PTB100 at the
24m site has a temperature dependence. For FLOSS01, this was
reasonably fit by: P = P_ptb100 + 0.126*T - 3.4. Since the sensor was
mounted in the ADAM, Tbox.cosmos was used to characterize its
temperature. This correction will be applied to the data.
Precipitation
Precipitation was measured at the 24m site using our ETI weighing
precipitation gauge. This appeared to give some spurious tips.
As with FLOSSII, we also deployed an ultrasonic snow depth gauge, but
have found the data from it to be useless (except as an indicator of snow in
the air).
Radiometers
Our standard 4-component sensor suite (PSP up and down, PIR up and
down, and net) was deployed initially at the 24m and bare sites. As
mentioned above, when the sage site was established, the sensors at
the bare site were moved to sage, but a new net radiometer was
installed at the bare site. Since high accuracy was not needed from
these sensors, our standard calibration was used. All of the PSP and
PIR sensors (probably!) were aspirated, but undoubtedly, there still
were periods when they were covered with ice/frost/snow.
We also ran "dummy" radiometers as icing detectors at the main tower
site. These data have not been examined yet.
From logbook:
- sage fans disconnected 2 March 2002 to save power.
- main Rsw.out was bad until the sensor was replaced on 10 Dec.
- Even after the change, main Rsw.in varied at night more than others (at least all of Dec 2001)
Soil Sensors
Our standard sensors were used at each site: 1 REBS heat flux plate at
5cm, 1 REBS temperature probe slanted from 1-4cm, and 1 CS615 soil
moisture probe at 5cm. These sensors were deployed in late November
when the ground was frozen, so thermal coupling to the soil was not
great. Also, we now know that the CS615 probes do not "see" frozen
moisture. We also took several manual moisture measurements with our
handheld TRIME probe, but it probably suffers from the same "ice
blindness". Thus, the only reliable moisture measurements were those
done gravimetrically. We did take over 20 gravimetric samples at
various depths at the 3 sites.
All the "reliable" soil moisture measurements are plotted
here. There aren't many values.
CS615 data are only shown when Tsoil is greater than 0.
Also, the main site CS615 data have been multiplied by 1.4 to agree with the (2!)
gravimetric samples in the non-frozen period. Unfortunately, no gravimetric
samples were taken at bare and sage with non-frozen soil so that similar adjustments could
be made.
Daily QC Plots
This table displays all available QC plots, by day.
These plots are of the 5-minute statistics, covering 48 hours,
centered on local noon of each day.
These are preliminary plots for data quality control.
Variables
This table of variables
is generated from the header of a NetCDF file of 5 minute statistics.
FLOSS Data Access
The NCAR FLOSS data is available for download in the following forms:
FLOSS Field Logbook
A computer-readable field logbook
of comments noted by NCAR and other personnel is available in html form.
FLOSS Photographs
Photographs are available from site survey and during operations.
Note the repeated views of some shots to characterize the snow cover.
On Jan 17th, an Axis 2420 network camera was
installed on the tower at about 21 meters, looking south. Photos are taken and saved in
JPEG form every 15 minutes from 05:00 to 20:00 local time (MST=GMT-7).
Photos at 08:00, 12:00 and 16:00 local time each day are
available here.
Network camera photo history:
-
Jan 17-Feb 7: VGA resolution photos (704x480 pixels), but due to bug in camera
software, detailed images were truncated at 55 Kbytes.
-
Feb 7-Feb 22: Low resolution photos (352x240).
Due to operator error, photos were lost from Feb 14 thru Feb 16.
-
Feb 23-April 1: Camera software upgraded. Photos are 704x480 resolution, without truncation.
Also, here is a link
to photographs taken by Sean Burns (NCAR/MMM).
Other FLOSS Links
[an error occurred while processing this directive]
This page was prepared by
Steven Oncley,
NCAR Research Technology Facility