Energy Balance Experiment 2000 (EBEX00) ISFF Report
News
- Nov 21, 2003: 5-minute averages of Tdome/Tcase have been corrected (see below).
Introduction
This document is a standard product of
NCAR/ATD/
RTF
which gives an overview of the measurements taken using the Integrated
Surface Flux Facility (ISFF) and conditions during the EBEX2000 field
experiment. This document can be obtained in hard copy from RTF upon request.
If you reached this page from a search engine, click here to see the full report, with frames.
Steve Oncley has a separate
WWW site
now used for EBEX2000 data analysis.
Participants
- S. Oncley; NCAR/EOL, Colorado
- T. Foken, M. Mauder, C. Liebethal; University of Bayreuth, Germany
- R. Vogt, A. Christen, E.van Gorsel (now: CSIRO, Australia), I. Lehner; University of Basel, Switzerland
- C. Bernhofer; Dresden University of Technology, Germany
- W. Kohsiek; KNMI, The Netherlands
- H. de Bruin; Wageningen University, The Netherlands
- D. Grantz; University of California, Kearney Research Center, California
- H. Liu; Jackson State University, Mississippi (formerly: City University of Hong Kong, Hong Kong)
- A. Pitacco; University of Padova, Italy
- L. Ribeiro; Braganca Polytechnic Institute, Portugal
- T. Weidinger; Eotvos Lorand University, Hungary
Location
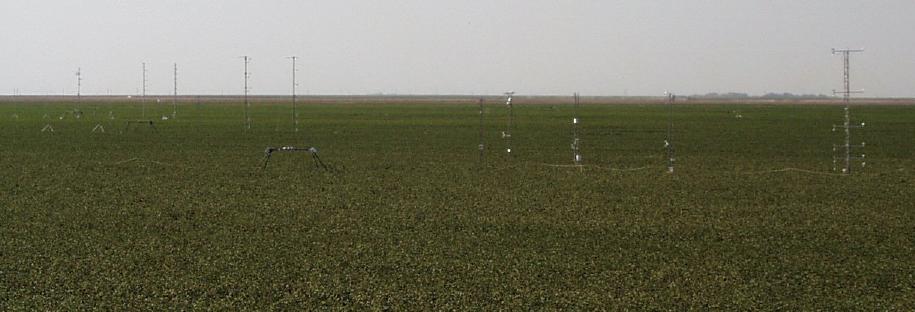
ISFF operated 9 sites with 5 and 10m towers in the eastern half of
Section 17, of T21S, R19E (about 50 miles south of Fresno, CA) in cooperation
with several other research groups.
A layout of these sites is available.
The locations of all sites were:
- Site 1: 36deg 6.277'N, 119deg 56.145'W
- Site 2: 36deg 6.184'N, 119deg 56.065'W
- Site 3: 36deg 6.091'N, 119deg 55.999'W
- Site 3 (after 14 Aug): 36deg 6.582'N, 119deg 56.135'W
- Site 4: 36deg 6.116'N, 119deg 56.131'W
- Site 5: 36deg 6.023'N, 119deg 56.066'W
- Site 6: 36deg 5.930'N, 119deg 55.998'W
- Site 7: 36deg 5.953'N, 119deg 56.131'W
- Site 8: 36deg 5.860'N, 119deg 56.066'W
- Site 9: 36deg 5.767'N, 119deg 55.999'W
- Site 10 (approx): 36deg 5.77'N, 119deg 56.13'W
Chronology
- 12 Jul: Base installed.
- ~21 Jul: Begin flux sensor intercomparison.
- 28 Jul: Start main operations.
- 14 Aug: Move site 3 to fallow field upwind.
- 24 Aug: Begin tear-down of profile and some flux sensors.
- 25 Aug: Tear-down of remaining sensors.
Table of Variables
EBEX2000 Data Access
NOTE: ALL OF THESE DATA CURRENTLY ARE PRELIMINARY IN-FIELD RESULTS AND
HAVE SEVERAL KNOWN ERRORS. EXPECT THESE VALUES TO CHANGE.
Data for EBEX2000 are currently available in these forms:
-
Preliminary, unchecked and unedited 5-minute averages of first and second-order
moments of calibrated data are available as
NetCDF files,
each containing one day's data from 00:00 to 23:59 GMT. These files include
all data from the nine tower sites that was acquired by NCAR.
We recommend combining these to obtain more statistically-significant
averages over longer time periods. These files contain data from
the intercomparison period, Jul 18-30, and the normal operations,
Jul 30-Aug 27.
Also available is a computer-readable logbook
of comments noted by field project personnel.
EBEX2000 Photographs
Images either taken with a digital camera or scanned from prints sorted
by directory. Click on a directory name, and then on a
thumbnail image on the "contact sheet" to view. Contributions from
Steve Oncley, Steve Semmer, Luis Ribeiro, Thomas Foken, Heping Liu,
and Roland Vogt.
Sensors and Data Processing
Radiometers
Table of the radiometers used to measure the radiation components.
CM21, CM14, CNR1 are models by Kipp and Zonen, PIR and PSP are by
Epply, Q7 is by REBS. A ``v'' suffix indicates that the sensor
was ventillated. All sensors were mounted on stands approximately
2~m above the ground. Two or four sensors at one height are
indicated by x2, x4, respectively. [site 9 not ventillated?]
| Parameter | Sites 1-6 | Site 7 | Site 8 | Site 9 |
| R_net | Q7 | Q7 | Q7 | Q7 |
| | | CNR1 | | CNR1 |
| | | Schultze-Dake | | |
| R_sw down | | PSP | PSPv | PSP |
| | | CM21v | | CM21x2 |
| | | CM14v | | |
| R_sw up | PSP | PSP | PSPv | PSP |
| | CM21v | CM14v | | CM11 |
| R_lw down | | PIRv | PIRv | PIR |
| R_lw up | PIRv | PIRv | PIRv | PIR |
| T_sfc | | KT15 | Everest x4 | |
I wrote a quick report of
an investigation of the difference between Rlw from stations 2 and 6.
However, we have learned that not only did our data system corrupt coefficients
used for Tdome and Tcase of the pyrgeometers (see PIR/CR10X Report),
we also applied incorrect coefficients. These data have now been corrected.
Tony Delany has written a draft report on the
radiometer calibrations used in EBEX. We expect this document to be revised
soon. I've also made a quick Table of B-values for
our radiometers.
Here is an outdated description of an
investigation which fails to correct shortwave radiation values. Supposedly,
Chris Fairall has a recent paper on this subject.
Sonic Anemometers
Table of turbulence measurements at the EBEX sites. Heights in m are in
parentheses. Two sensors at one height are indicated by x2.
| Parameter | Sites 1,3 | Sites 2,4-6 | Site 7 | Site 8 | Site 9 |
| Wind velocity | UW (4.7) | ATI-3K (4.7) | ATI-3K (4.7) | UW (4.7) | UW (4.7) |
| and T_c | | | Kaijo-Denki TR90-AH (1.76) | | CSAT3 (2.4)x2 |
| | | | Kaijo-Denki TR90-AH (2.76) | | Gill R2 (2.4)x2 |
| | | | CSAT3 (2.7) | | CSAT3 (6.0) |
| | | | CSAT3 (4.7) | | Gill HS (6.0) |
| | | | CSAT3 (8.7) | | Metek USA-1 (6.0) |
| Humidity | KH20 (4.7) | KH20 (4.7) | KH20 (4.7)x2 | KH20 (4.7) | KH20 (4.7) |
| | | | KH20 (1.7)x2 | | KH20 (2.4) |
| | | | KH20 (2.7)x2 | | KH20 (6.0) |
| | | | Li7500 (4.7) | | Li7500 (6.0) |
| | | | KH20 (8.7) | | |
| Fine-wire T | | | AIR150 (4.7) | | Heinmann (6.0)x2 |
| | | | Campbell (2.7) | | |
| | | | Campbell (8.7) | | |
Here are selected comments about the sonics from our
logbook, including the boom angles shot for all of the wind sensors for EBEX
(including props). Note that station 3 was never shot before it was moved to
the fallow field. I plan to compute it using data from strong wind cases, but
seem to recall that a first attempt wasn't very successful.
Even more worriesome is that we learned during SGS that all of our theodolite-
based sunangles were computed with the sun_angle program set to the year 1900
(a Y2K bug!). We've estimated that the angles could be off by 0.5 degree. We
might be able to correct them if we knew when the angles were shot, but we
didn't keep track of these times. The data_scope angles that were shot for
the IC period should be okay (though only good to 0.2 degree themselves).
Prop-vanes
Table of profile measurements at the EBEX sites. Heights in m are in parentheses.
[NCAR model num., KNMI ht]
| Parameter | Site 7 | Site 8 | Site 9 |
| Wind speed | Climatronics F460 | Modified RM Young | Vector A101L |
| | (1.2,1.7,2.7,3.7,4.7,5.7x2, | (1.7,2.7,4.7,6.7,8.7,10.7) |
(0.95,1.50,2.35,3.72,6.12,9.05) |
| | 6.7,7.7,8.7,9.7,10.7) | | |
| Wind direction | Climatronics F460 | Modified RM Young | Vector W200P |
| (10.7) | (1.7,2.7.4.7,6.7,8.7,10.7) | (9.0) |
| Temperature and | Frankenberger | NCAR/Vaisala | Frankenberger |
| Humidity | (0.7,1.2,1.7,2.7,3.7,4.7,5.7, | (0.7,1.7,2.7,4.7,6.7,8.7,10.7) |
(0.95,1.50,2.35,3.72,6.12,9.05) |
| | 6.7,7.7,8.7,9.7,10.7) | | |
| | Vaisala HMP223 | | |
| | (3.50?) | | |
See the sonic anemometer comments above about boom angles. We also
probably had prop collar slippage which affected directions on one sensor:
00 Aug 12 04:00 - 00 Aug 12 07:00   Dir.1.7m too large by ~40deg
00 Aug 12 08:00 - 00 Aug 16 22:00   Dir.1.7m too large by ~67deg
T/RH
Soil
Table of the soil sensors used at the EBEX sites. Depths (in cm)
of the sensors are in parentheses. Two or four sensors at one height are
indicated by x2, x4, respectively.
| Parameter | Sites 1-6 | Site 7 | Site 8 | Site 9 |
| T_soil | REBS (1-4) | REBS (1-4) | REBS (1-4) | REBS (1-4) |
| | | Pt100 (2,5,10,20,50) | | CS107x4 |
| Q_soil | CS615 (2.5) | CS615 (2.5) | CS615 (2.5) | CS615 (2.5) |
| G_soil | REBS (5) | REBS (5)x2 | REBS (5) | REBS (5) |
| | | | | Rimco x4 |
Daily Weather Plots
Click on the following to obtain once/day plots for several important measured
variables. Each plot represents 24 hours of data. Please read the scales
carefully for more details.
Other plots
Soil Moisture
A plot of gravimetric soil moisture data
corresponding to the NCAR CS-615 soil moisture measurements is available
[an error occurred while processing this directive]
This page was prepared by
Steven Oncley,
NCAR Research Technology Facility