

| Previous day | Select day | Next day |
The most recent plots are generally updated every 15 minutes. Use the browser reload button to make sure you are seeing the latest version of a plot.
In order to distinquish the traces on the vertical profile plots, a slight offset in X is added to some traces. This is indicated by a "(n)" in the legend for the trace.
If you right-click on an image, most browsers will provide a menu to download or display the plot in another window.
P_20191005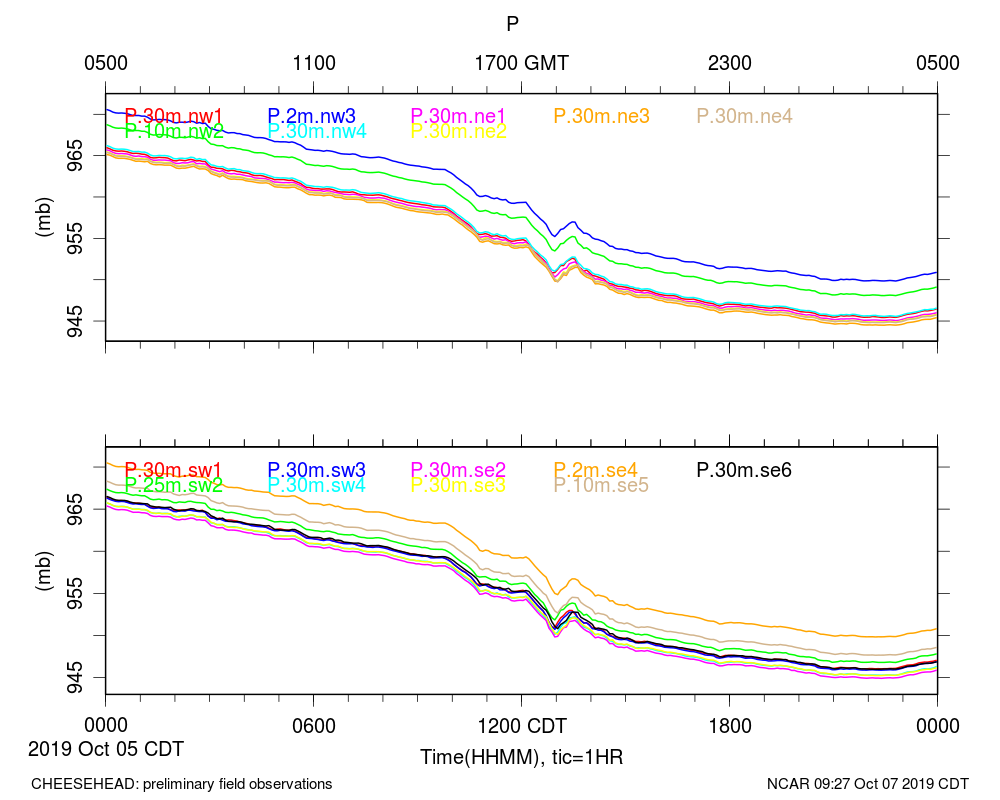
|
RH2m_20191005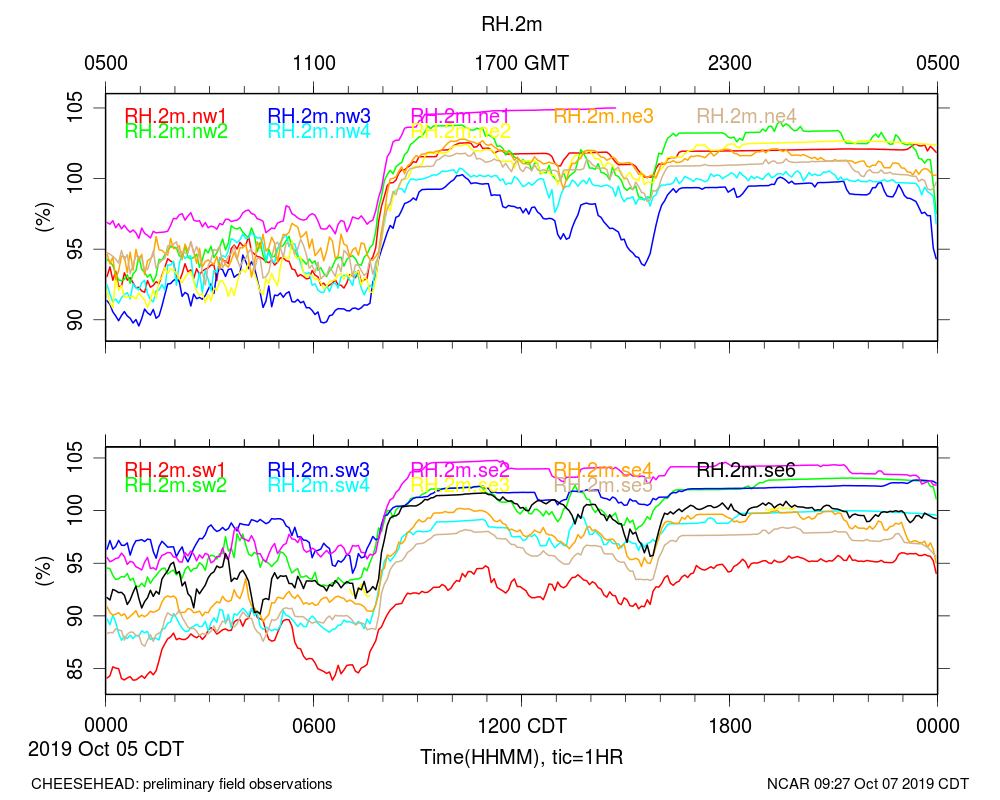
|
RHmid_20191005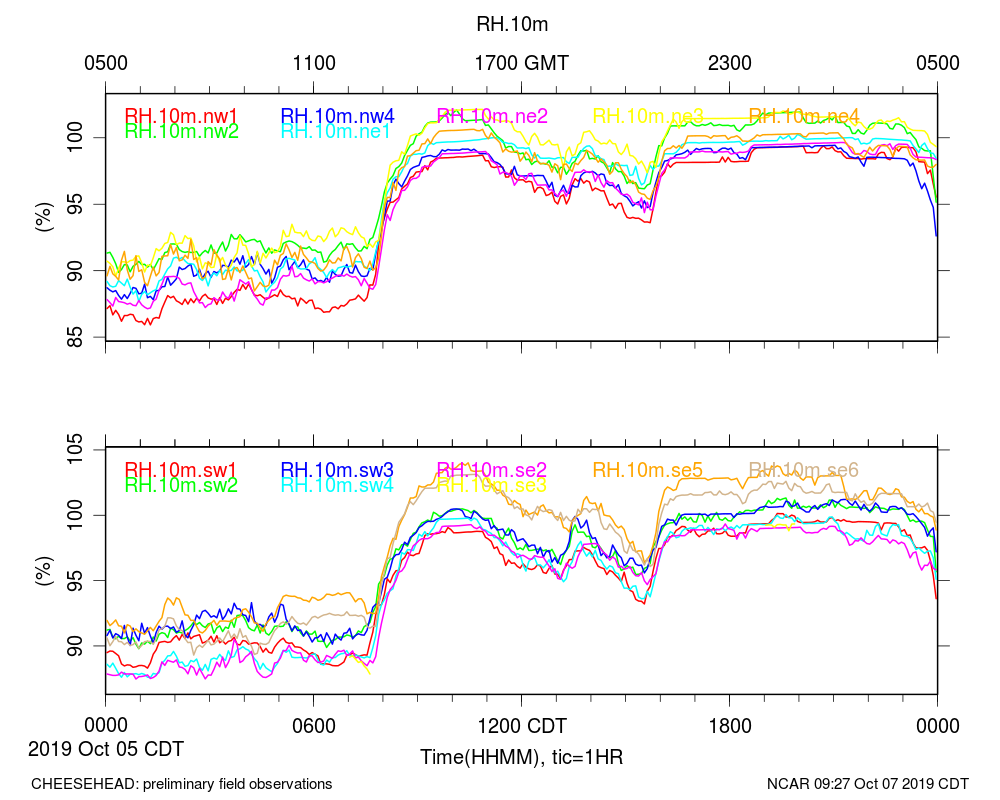
|
RHtop_20191005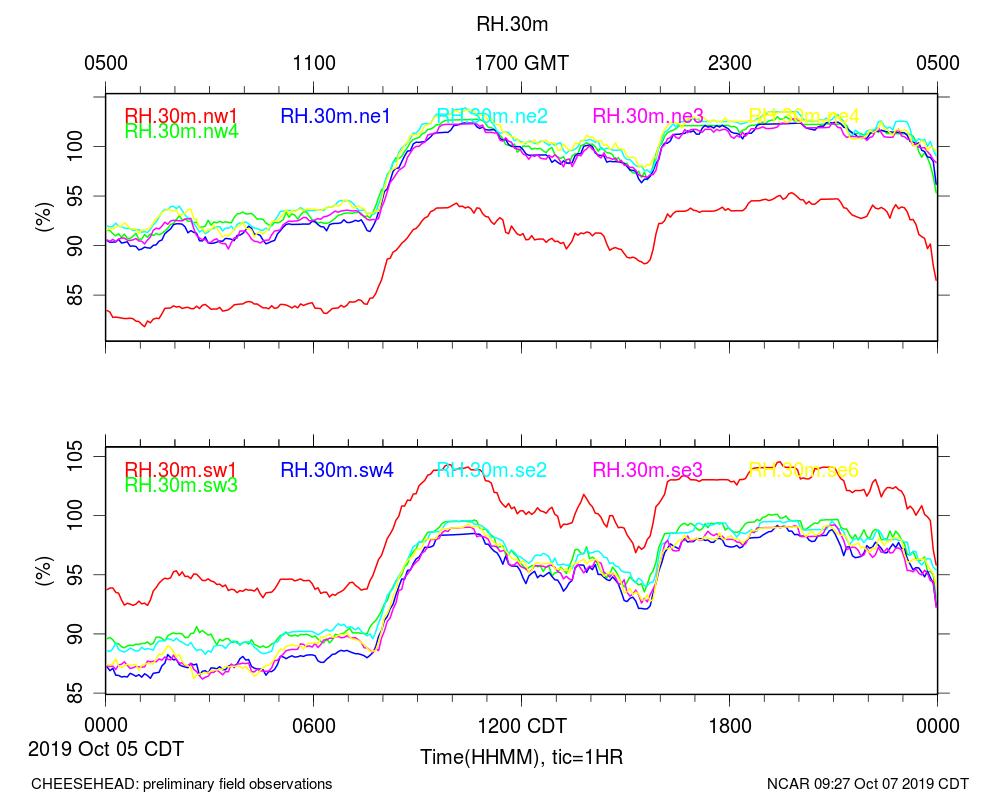
|
Raina_20191005
|
T2m_20191005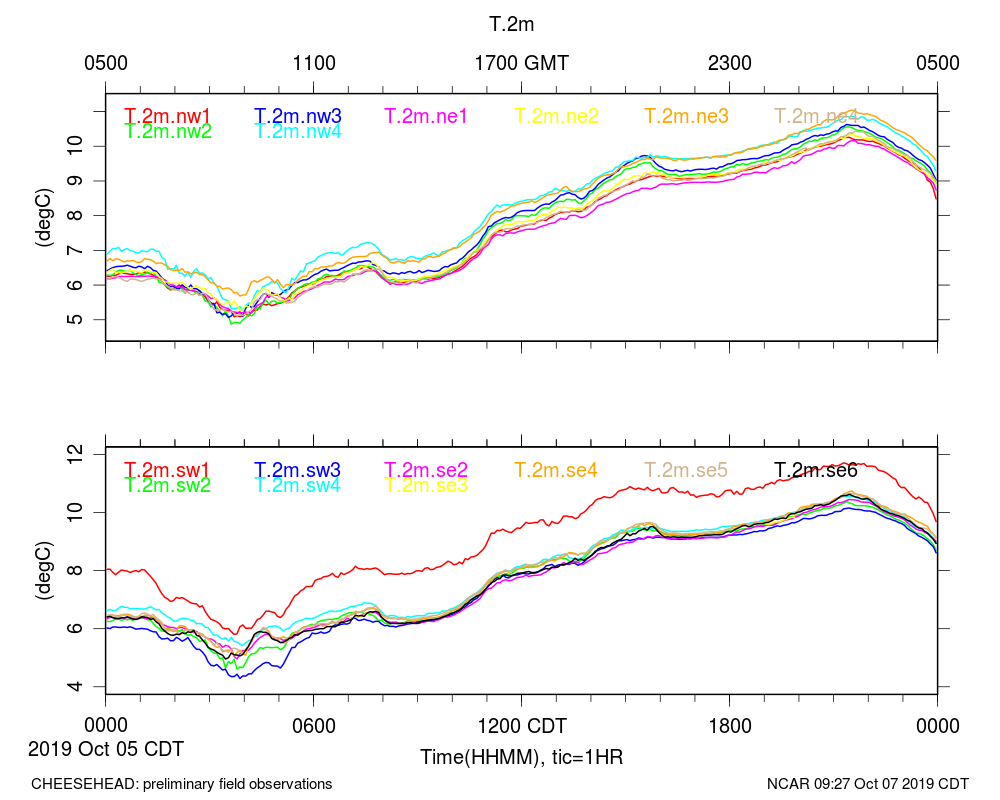
|
Tmid_20191005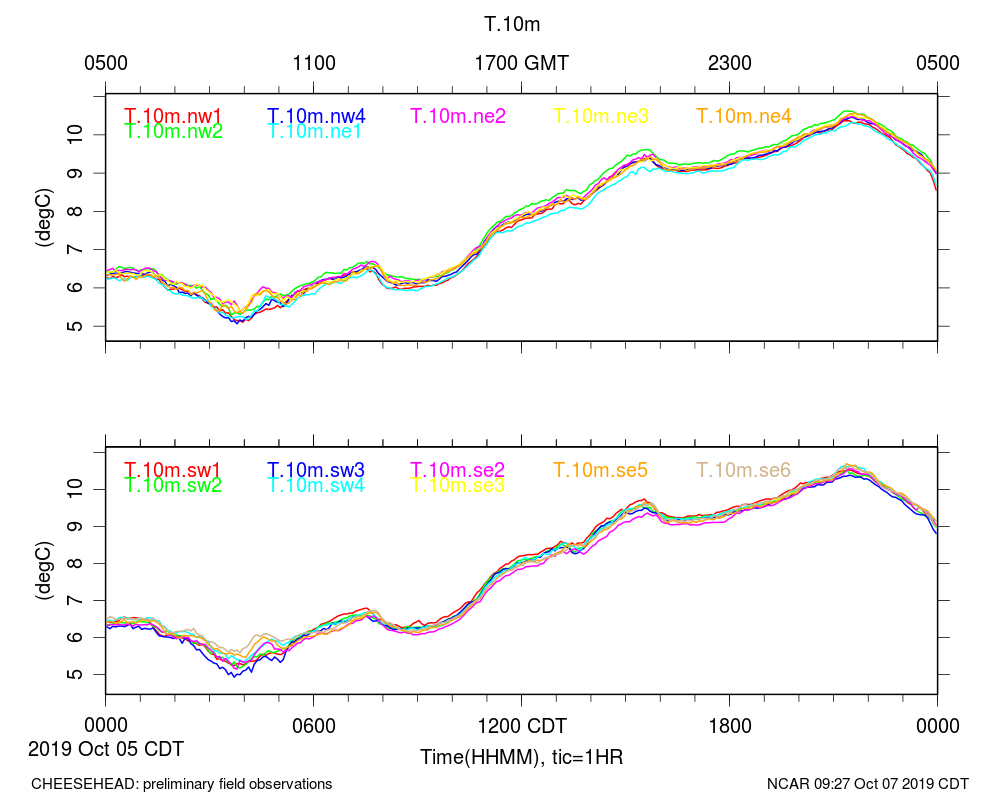
|
Ttop_20191005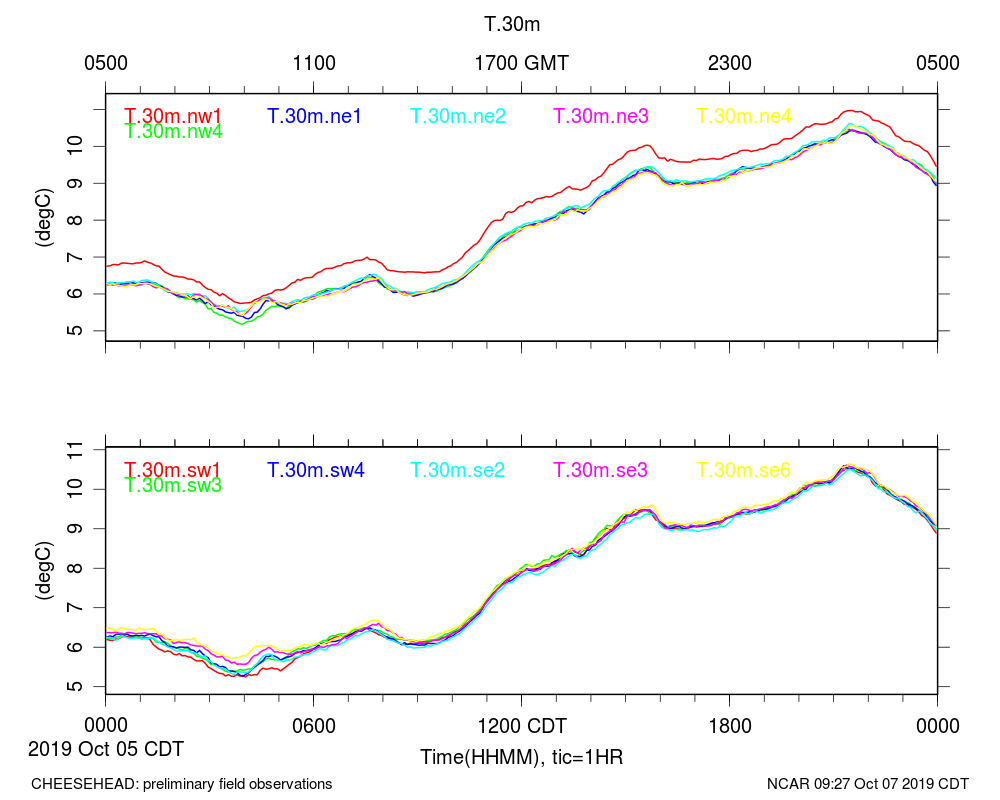
|
co2_20191005
|
h2o_20191005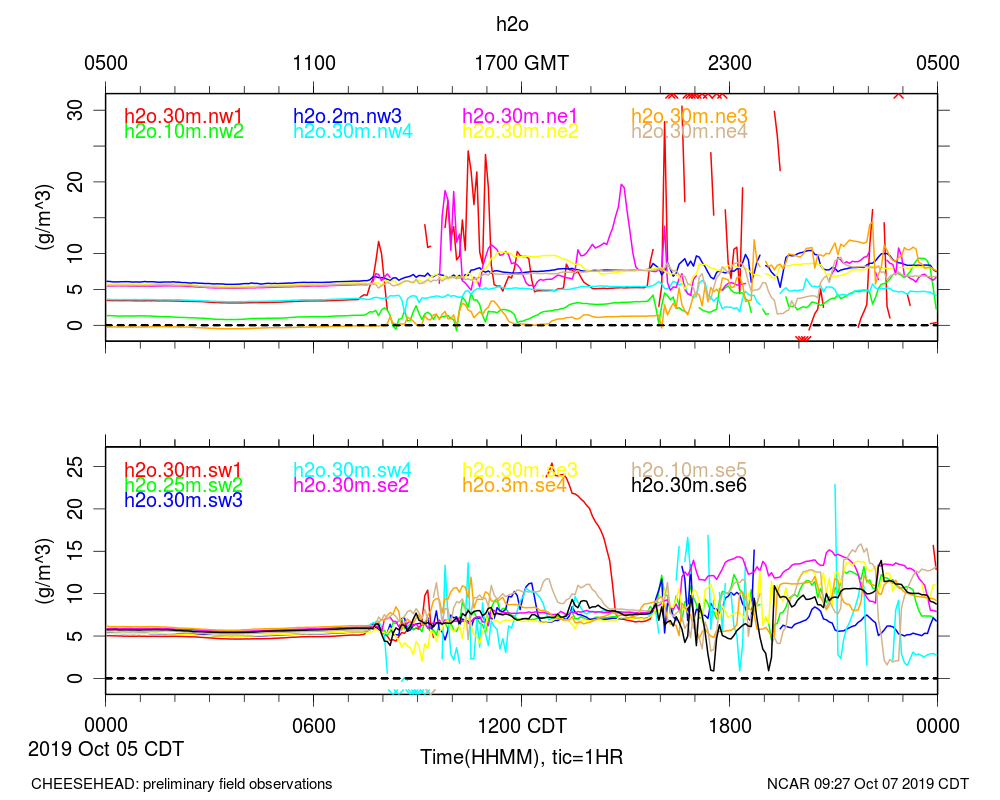
|
soils_ne1_20191005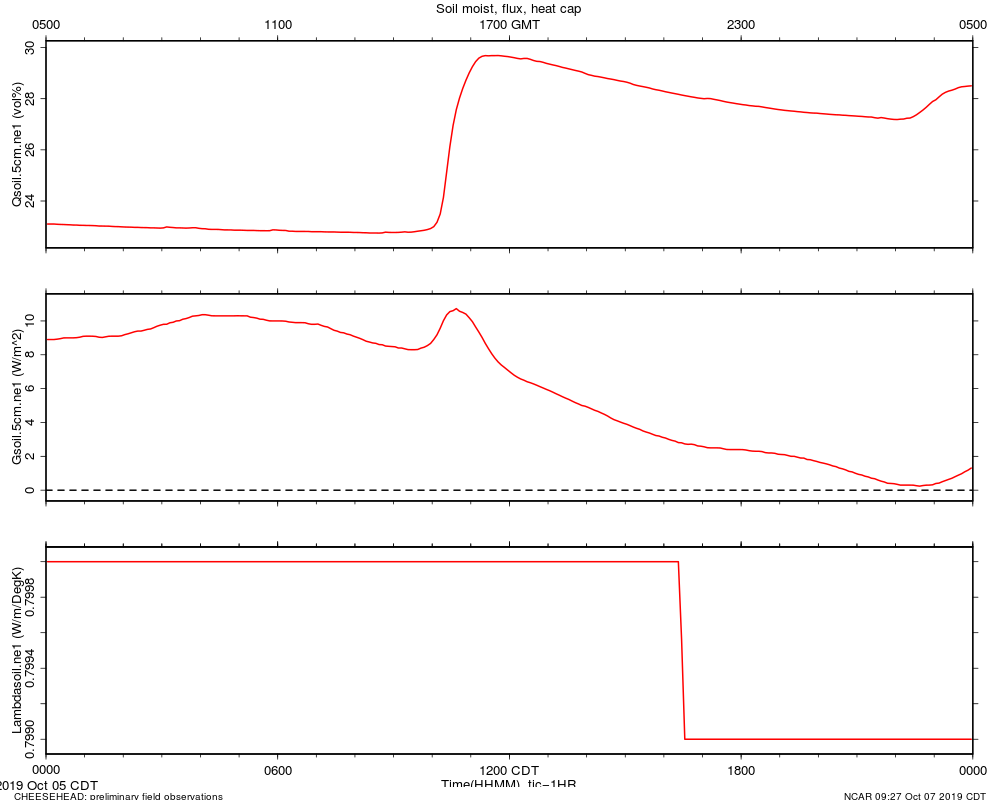
|
soils_ne2_20191005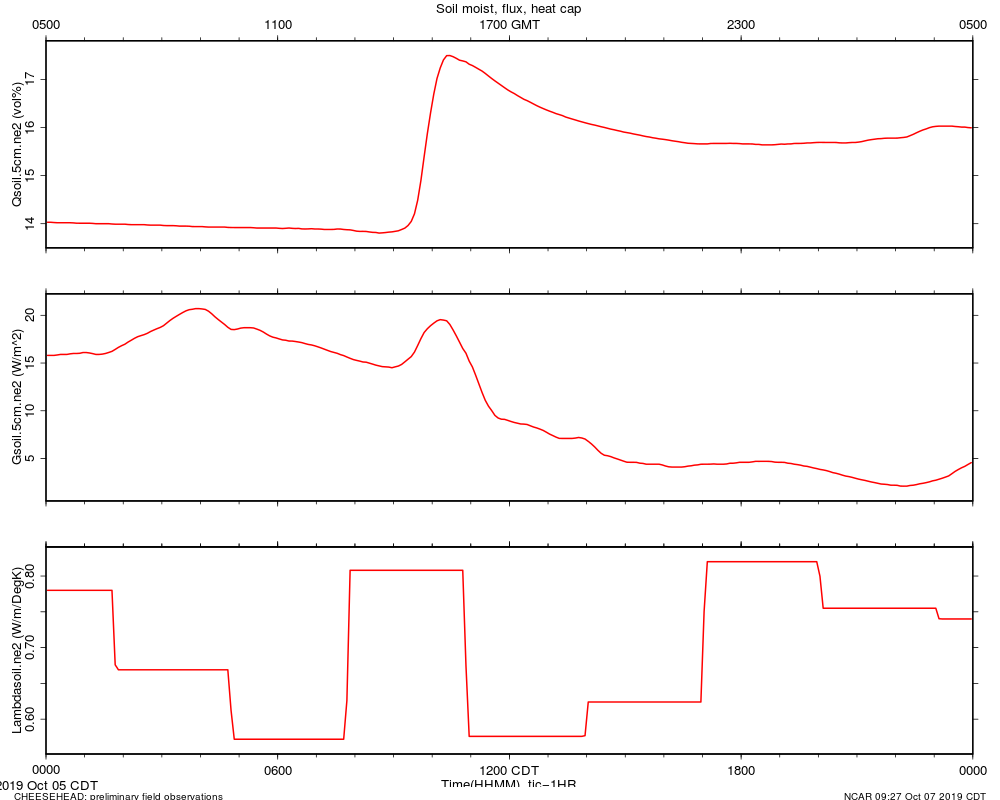
|
soils_ne3_20191005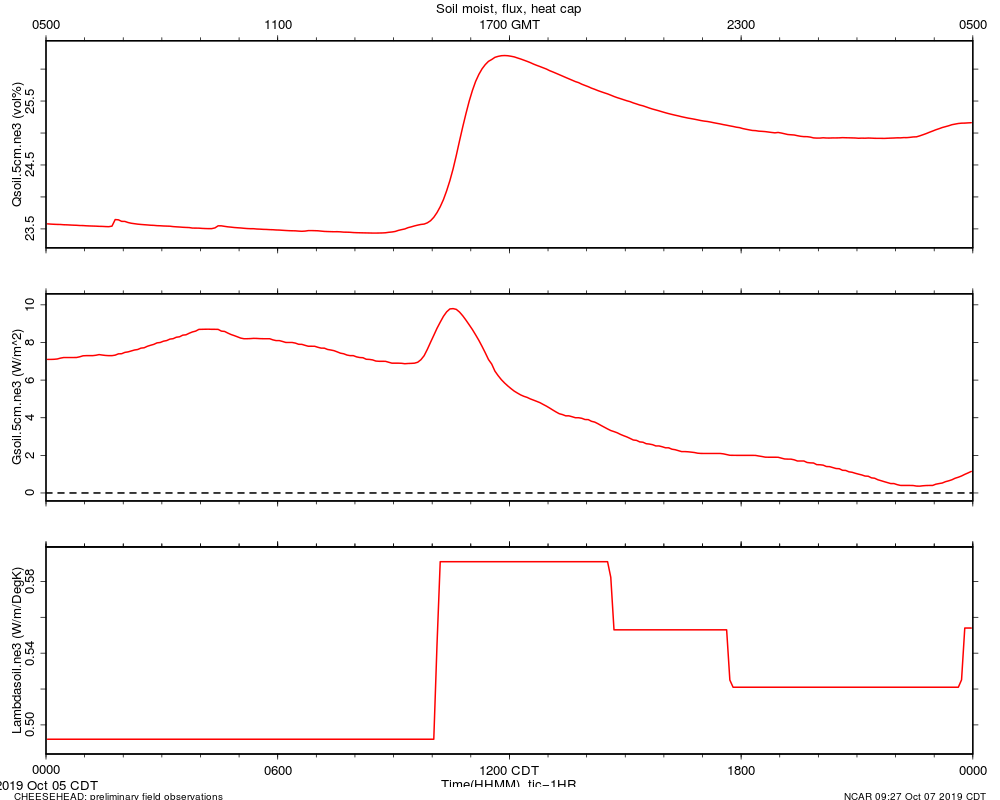
|
soils_ne4_20191005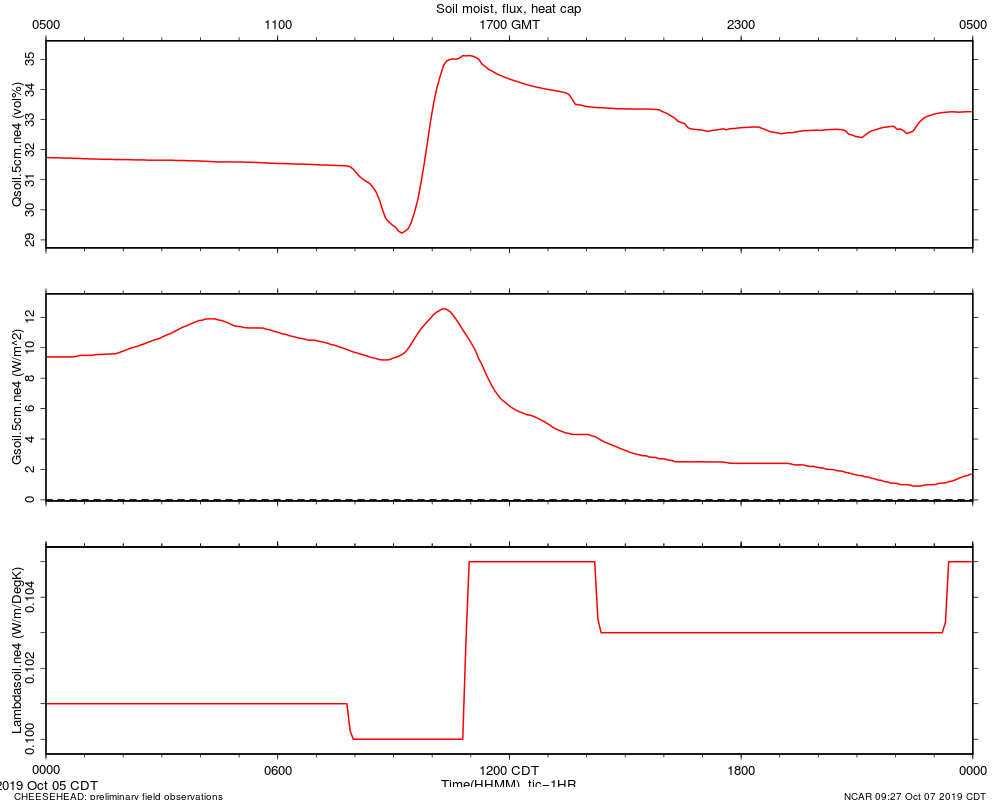
|
soils_nw1_20191005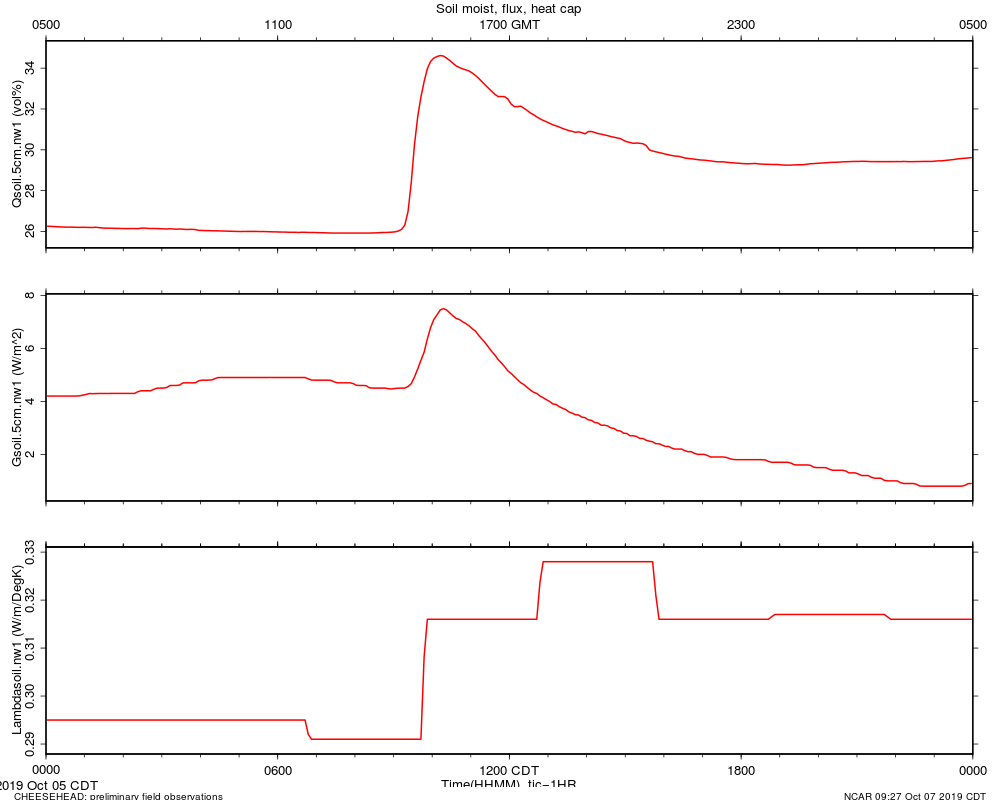
|
soils_nw2_20191005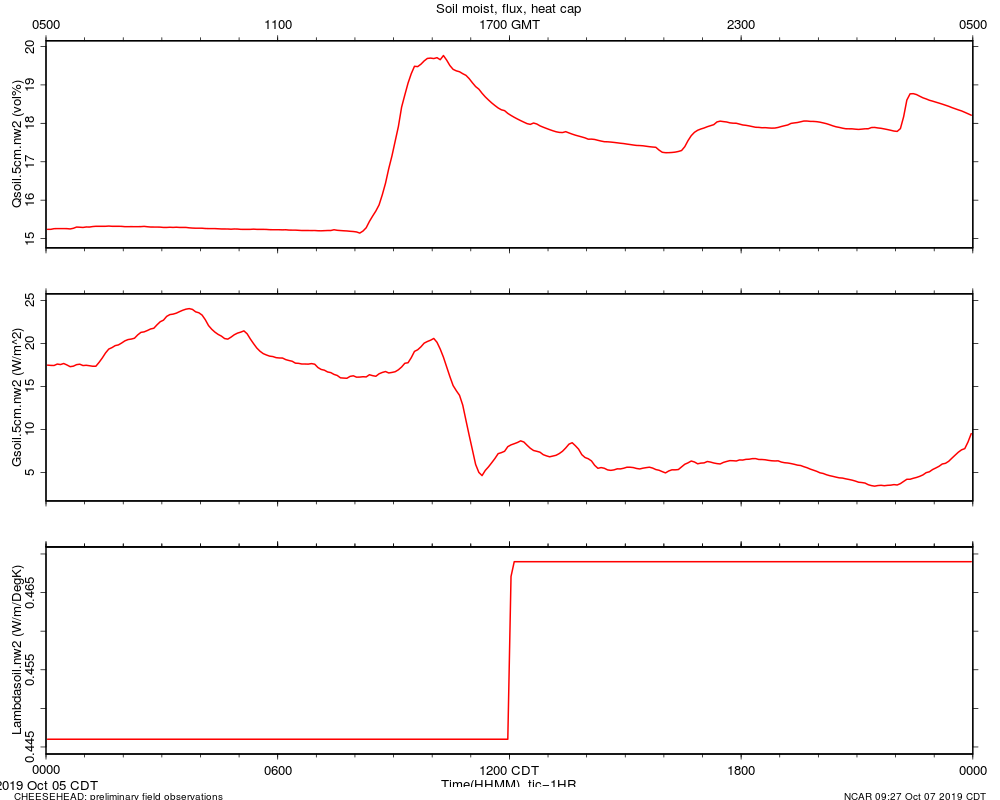
|
soils_nw3_20191005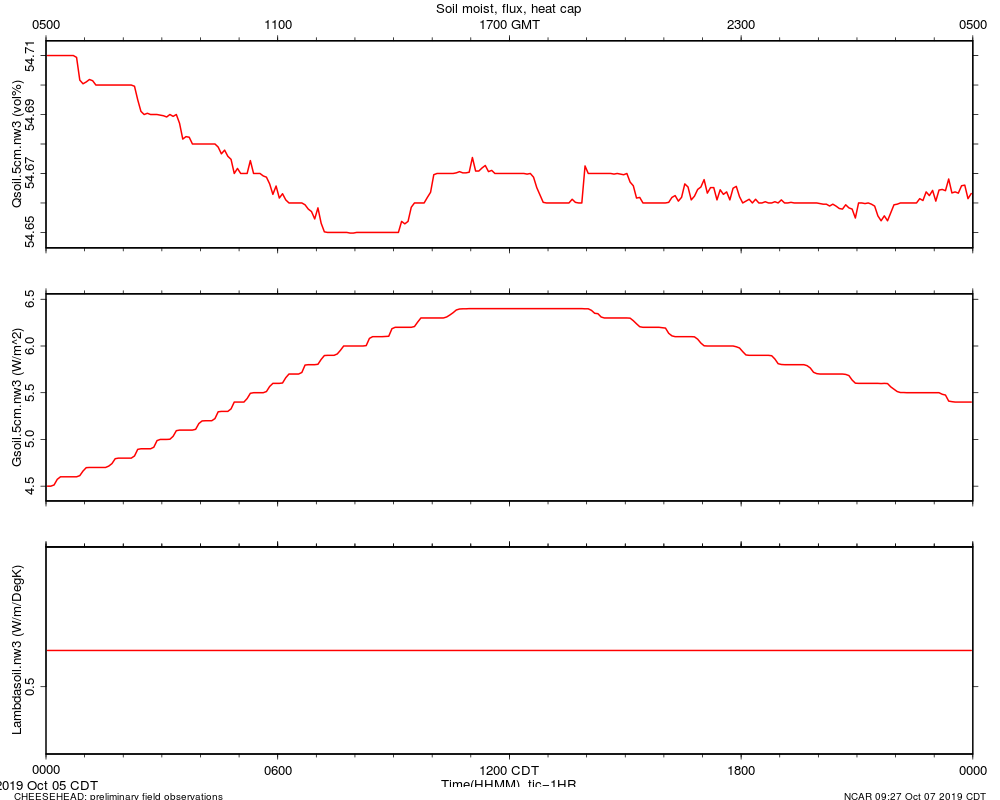
|
soils_nw4_20191005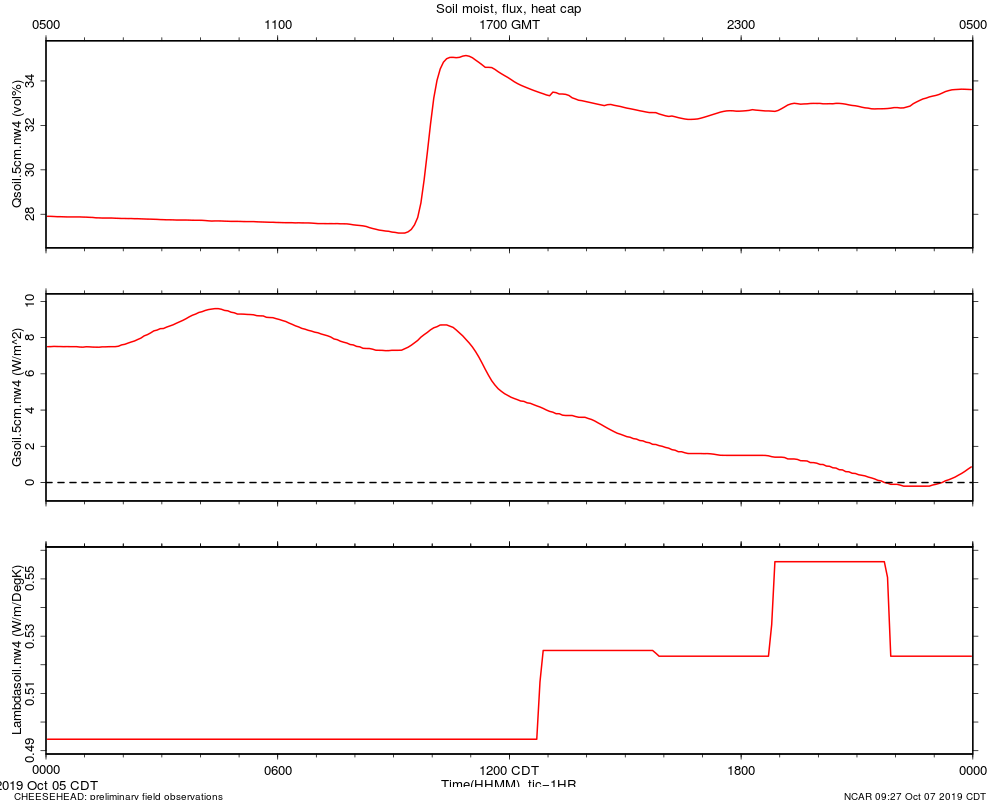
|
soils_se2_20191005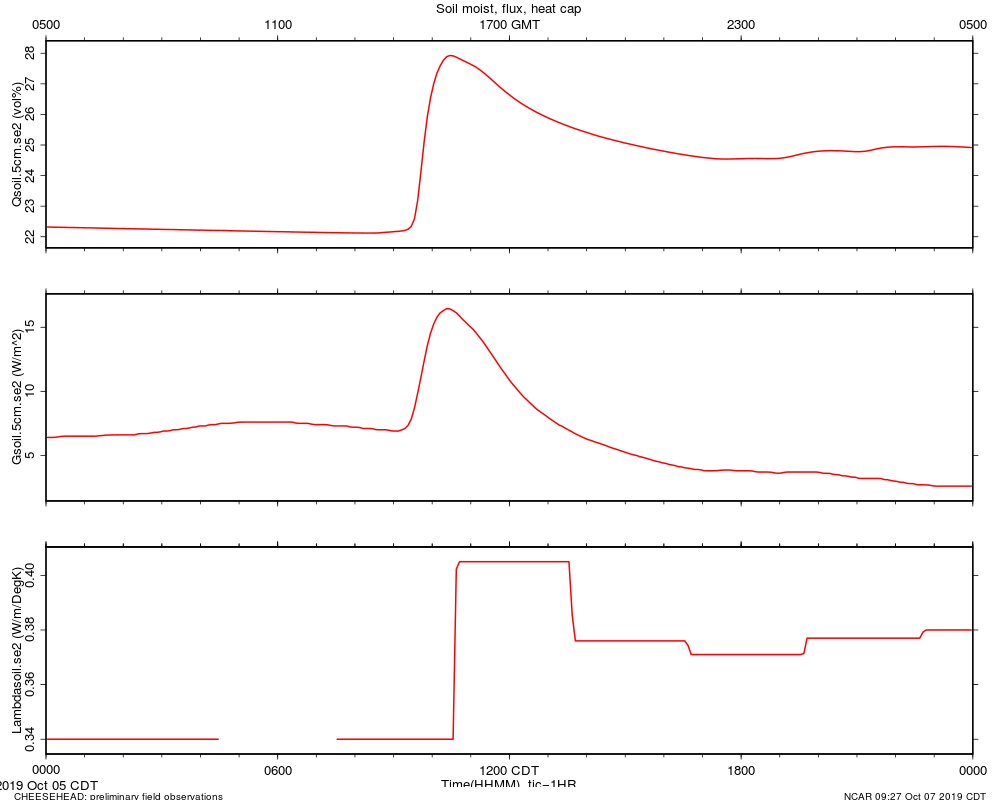
|
soils_se3_20191005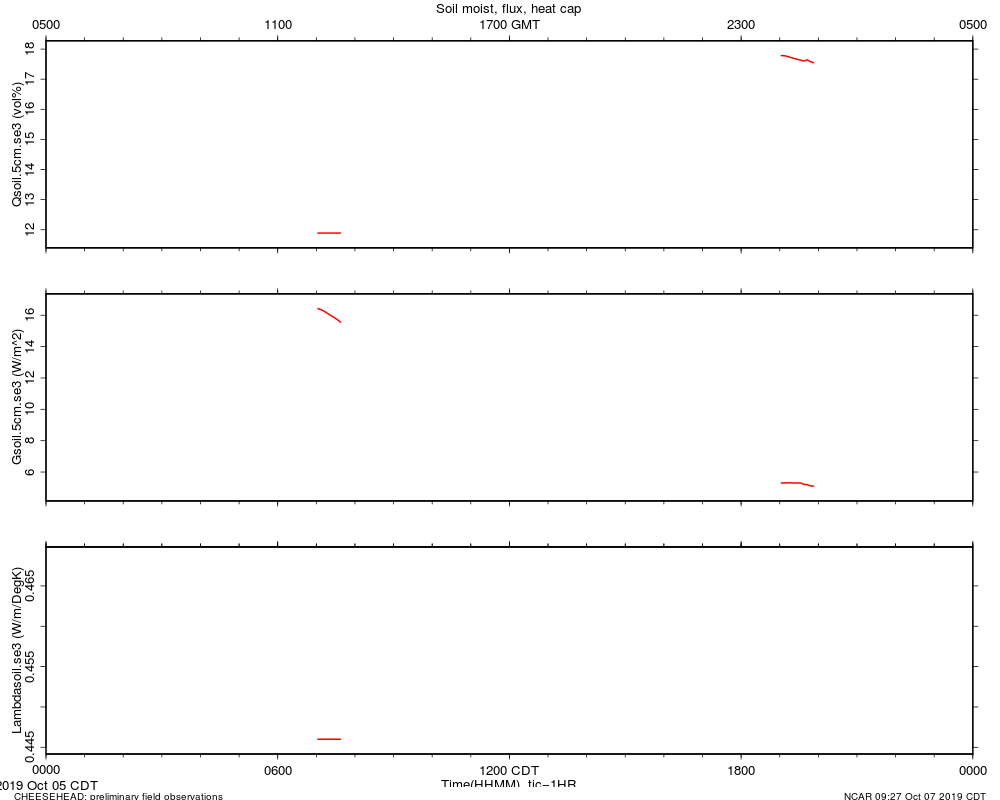
|
soils_se4_20191005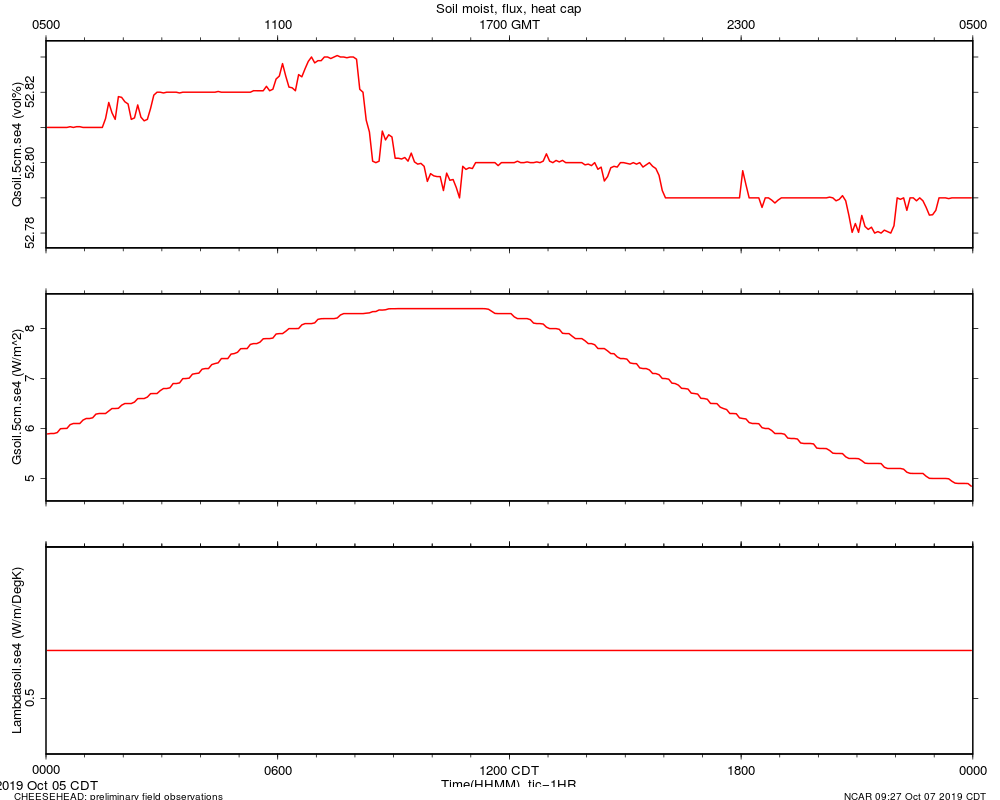
|
soils_se5_20191005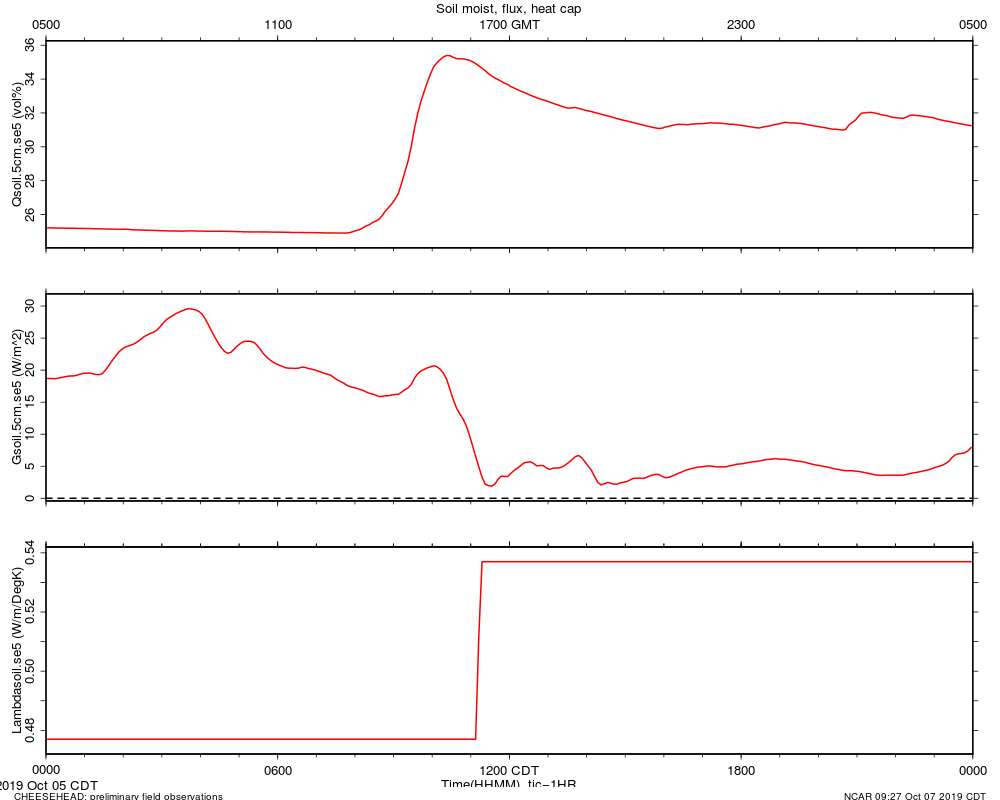
|
soils_se6_20191005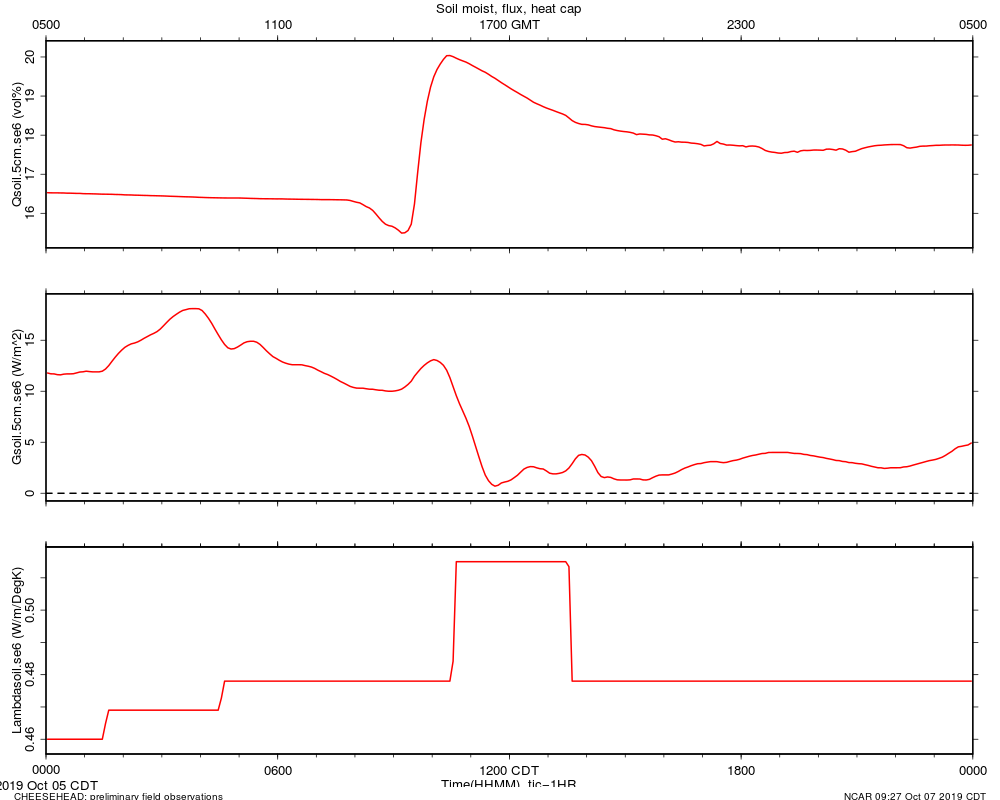
|
soils_sw1_20191005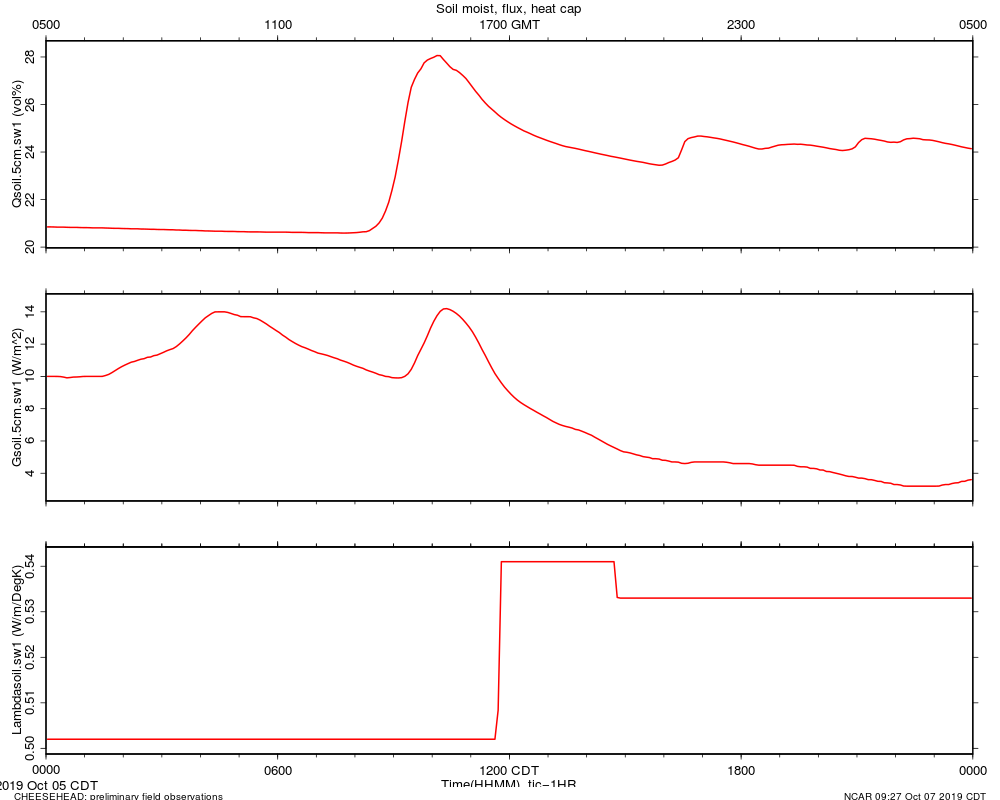
|
soils_sw2_20191005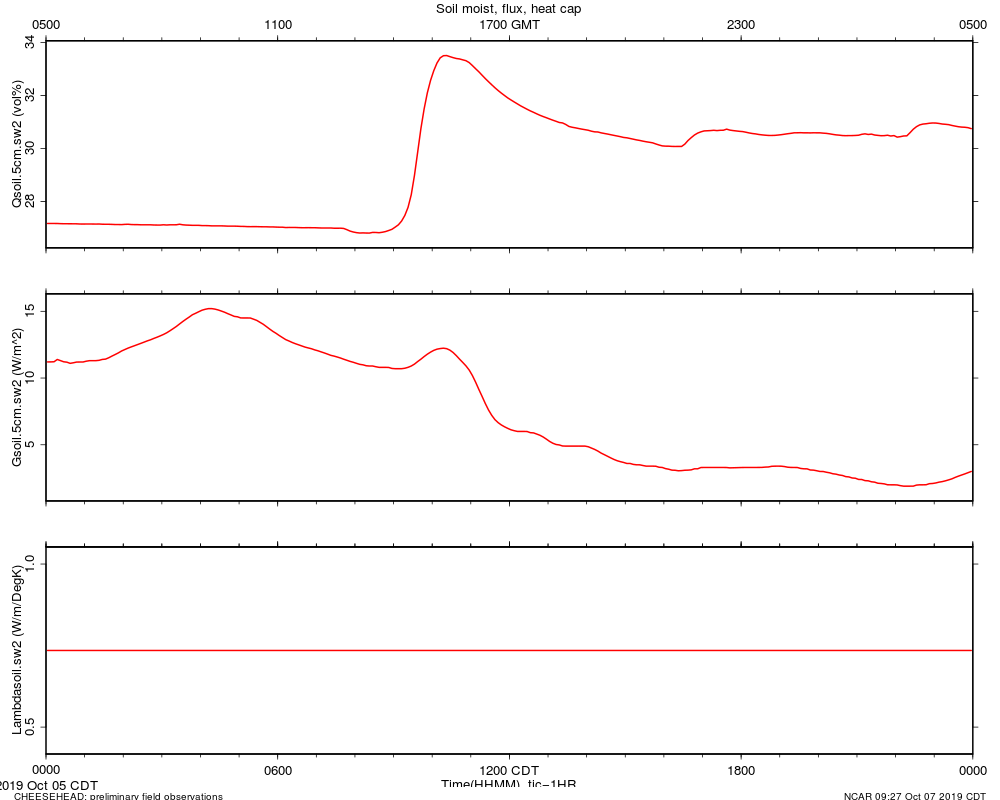
|
soils_sw3_20191005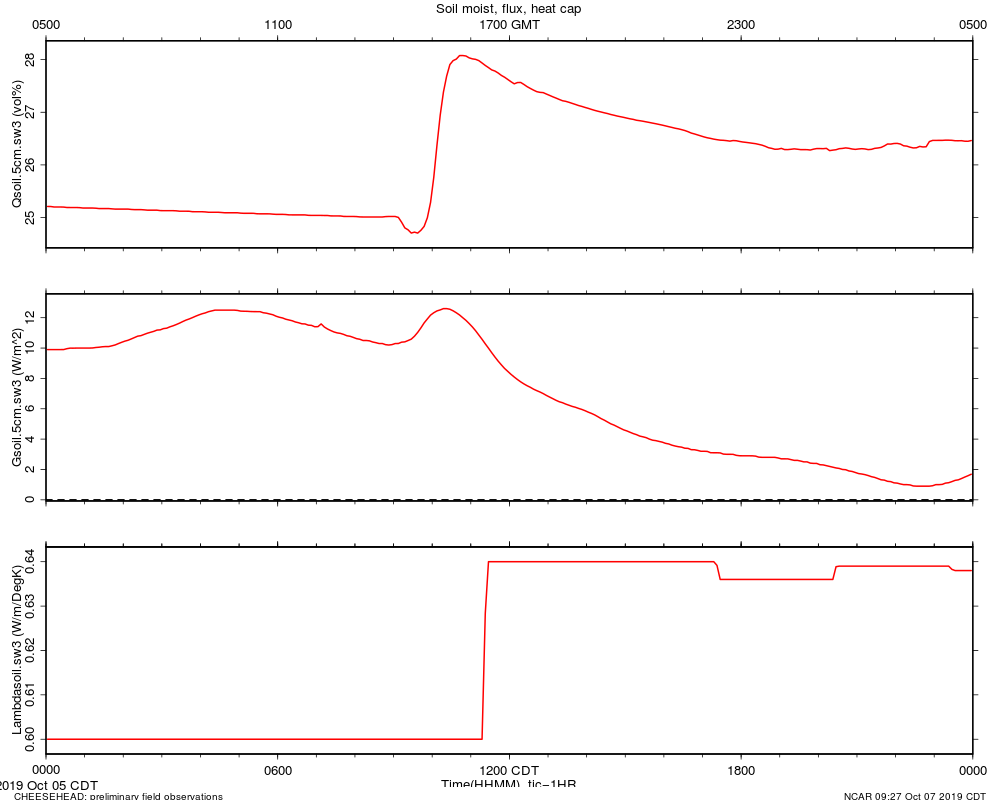
|
soils_sw4_20191005
|
spd_20191005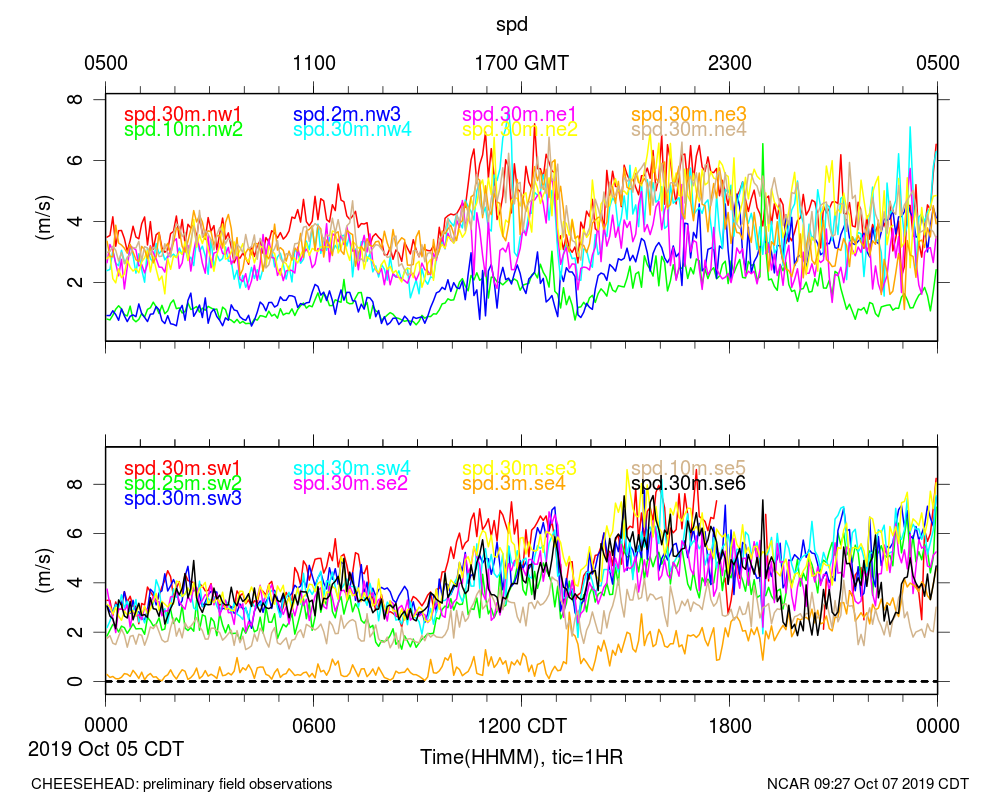
|
tc_20191005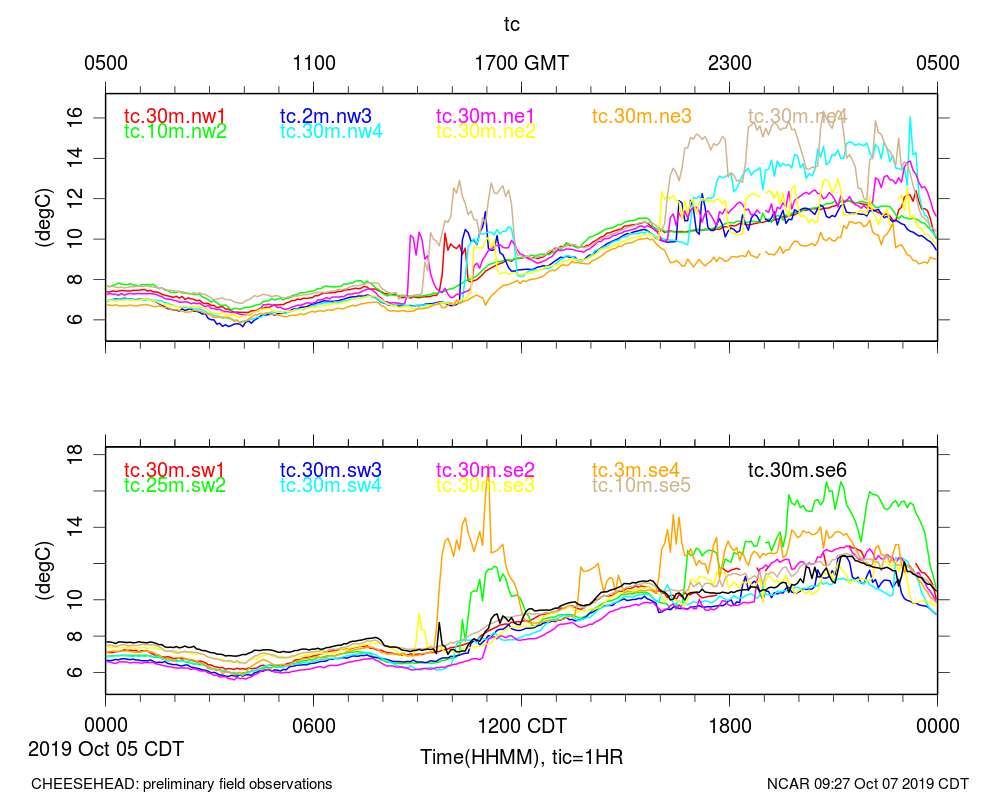
|