


AHATS Daily Plots, Aug 14, 2008
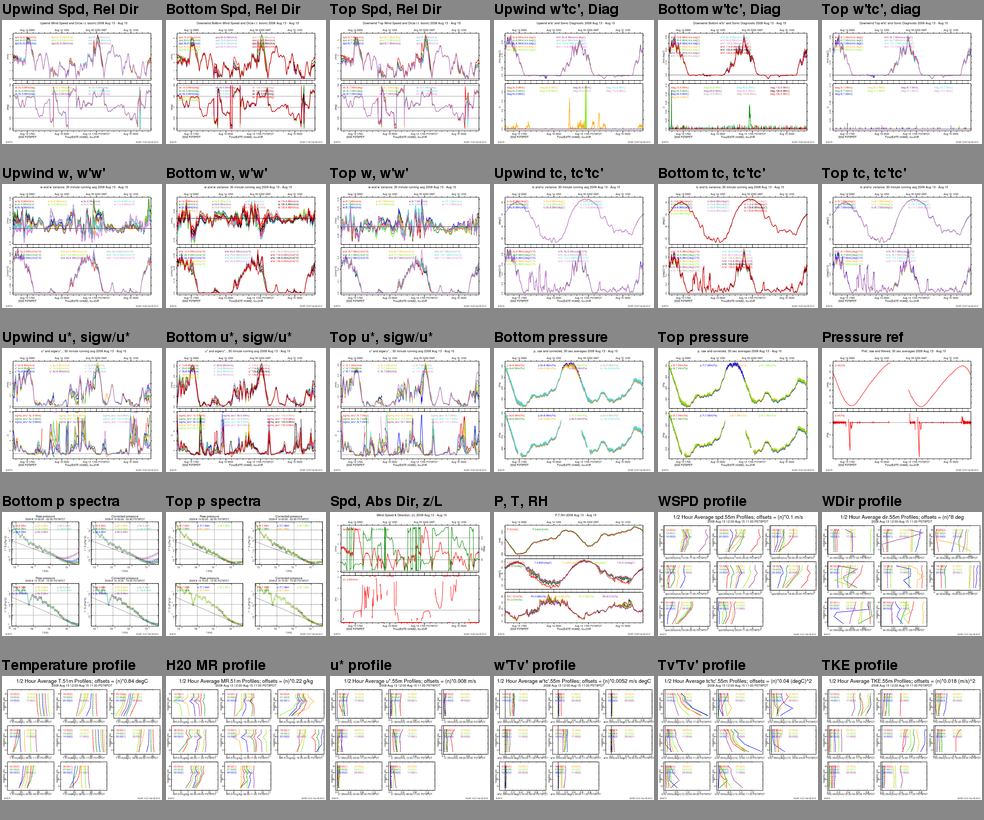
These are plots of the 5 minute statistics from the AHATS profile tower and
the
upwind, downwind-bottom and downwind-top horizontal arrays.
Click on a plot image to expand.
If you right-click on an image, most
browsers will provide a menu to download or display the plot
in another window.
Last modified: Saturday, 6-Feb-2010
© NCAR/Earth Observing Laboratory
NCAR In situ Sensing Facility